KEY WORDS:automation, global, georeferencing, orthorectification, SAR, geodesy, photogrammetry, DEM/DTM
ABSTRACT:
In this paper a process for rapid geometric correction of slant range SAR images is presented. The process is completely independent of ground control information thanks to the direct georeferencing method capabilities offered by the TerraSAR-X sensor. The process is especially rapid due to the use of readily available global DEMs and global geoid models. An additional advantage of this process is its flexibility. If a more accurate local DEM or local geoid model is readily available it can be used instead of the global DEM or global geoid model. The process is applied to geometrically correct a SSC TerraSAR-X image over a sub-urban mountainous area using the SRTM and the ASTER global DEMs and the EGM2008 global geoid model. Additionally two local, more accurate DEMs, are used. The accuracy of the process is evaluated by independent check points.
1 INTRODUCTION
Satellite remote sensing data is especially useful in crisis manage-ment as it allows the review and the evaluation of the situation, as well as the means for planning assistance and support. In-situ presence to the area of interest is usually difficult, as is the col-lection of Ground Control Points (GCPs) in order to establish the relationship of the image with the object space and the DEM col-lection for the orthorectification. In some cases GCPs and DEM are taken from remote sensing and geospatial data archives. In many cases though, data archives do not exist, or if they do exist time is usually too short to recover and exploit them. Further-more, if the crisis happens during days with cloud cover or during the night, the usefulness of optical images is little, as they illus-trate the clouds or a dark and shadowy surface of the Earth. In such cases the use of SAR data is the best solution. SAR sensors are active microwave sensors with all-weather and day-and-night capabilities which are able to provide information about the prop-erties of Earth’s surface, its geometry and its evolution over time. Additionally, modern satellite SAR sensors are able to illustrate Earth’s surface with high resolution imaging technology.
In this paper we present and evaluate a process for the rapid geo-metric correction of slant range (SSC) TerraSAR-X images. The geometric correction consists of two steps: 1) the establishment of the relationship of the 2D SAR image with the 3D object space and 2) the orthorectification of the image. The establishment of the relationship of the 2D SAR image with the 3D object space is usually computed with GCPs which are hard or time consum-ing to collect. In contrast, the GCPs are completely bypassed in this paper, using the direct georeferencing method (Vassilaki et al., 2011), which is based only on orbital data and other meta-data provided by TerraSAR-X’s operator. The othorectification of the slant range SAR image is usually computed using DEM collected for this purpose, which is also hard or time consum-ing to collect. In this paper two global DEMs are used instead, which are freely available on nearly global scale and can be ob-tained before any crisis happens: a) the interferometrically pro-duced DEM by the Shuttle Radar Topography Mission (SRTM), which has nominal accuracy of 16 m and offers 80% coverage of Earth’s surface (Bamler, 1999), b) the photogrammetrically
pro-∗Corresponding author.
duced DEM by the Advanced Spaceborne Thermal Emission and Reflection R adiometer (ASTER) on Terra spacecraft, which has nominal accuracy of 20 m and offers 99% coverage of Earth’s surface (ASTER GDEM validation team, 2009). The orthorecti-fication is performed by applying backward projection (Mikhail et al., 2001). Each pixel of the orthoimage is projected to the DEM and from there it is backprojected to the slant range image using the physical sensor model established by the direct georef-erencing step.
In order to implement this two-step process, the reference sys-tems used by the satellite sensor and the global DEM must be taken into account. The orbital data of the sensor is given in geo-centric coordinates of the World Geodetic System 84 (WGS84) ellipsoid, which correspond to ellipsoid (geometric) elevations. On the other hand the global DEMs provide orthometric eleva-tions. To convert between geometric and orthometric elevations the geoid undulation is necessary. Among the numerous global geoid undulation models, the Earth Gravitational Model 2008 (EGM2008) (Pavlis et al., 2008), which is used in this paper, and the EIGEN-6C2 (Foerste et al., 2012) are considered the most ac-curate, according to the evaluation of the International Centre for Global Earth Models (ICGEM).
An additional advantage of this two-step process is its flexibility: 1) if a local DEM, which is usually more accurate than the global ones, is readily available it can be used instead of the global DEM and 2) if a local geoid, which is usually more accurate than the global ones, is readily available it can be used instead of the global geoid.
The process is applied over a sub-urban hilly area, northeast of Athens using an experimental 300 MHz high resolution spotlight SSC TerraSAR-X image. The accuracy of the geometric correc-tion is evaluated by independent check points (CPs), collected from other available data.
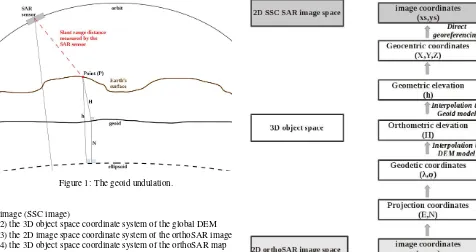
2 COORDINATE SYSTEMS
In order to perform the geometric correction of SAR images, var-ious coordinate systems must be taken into account:
Figure 1: The geoid undulation.
image (SSC image)
2) the 3D object space coordinate system of the global DEM 3) the 2D image space coordinate system of the orthoSAR image 4) the 3D object space coordinate system of the orthoSAR map The 2D SSC image coordinate system is defined by two axes (xs, ys) in pixel units. Theysaxis represents time which roughly
represents the position of the sensor along its orbit. Thexsaxis
represents the slant range distance (perpendicular to the orbit) be-tween the sensor and a point on the Earth’s surface. The 3D object coordinate system of the global DEM is in the form of ellipsoid geodetic coordinates and orthometric elevation (λ, φ, H). The coordinates are converted later to geocentric coordinates (X, Y, Z) needed by the physical model of the TerraSAR-X sensor. The 3D object coordinate system of the orthoSAR map is in form or Easting-Northing coordinates and orthometric elevation (E, N, H) of a map projection such as the Transverse Mercator (projection coordinates). The 2D orthoSAR image coordinate system is de-fined by two axes (xo, yo) in pixel units and are essentially the
projection coordinates system translated and scaled.
3 THE PROPOSED PROCESS
The geometric correction of slant range (SSC) TerraSAR-X im-ages consists of 2 steps:
1) the georeferencing of the SAR image 2) the orthorectification of the SAR image
The georeferencing used in this paper is the TerraSAR-X sen-sor’s physical model, the parameters of which are taken by sci-ence orbit data and other metadata given in the XML file that ac-companies the SAR image. The orthorectification process is well established (Mikhail et al., 2001). The intensity of the pixels of the orthoSAR image is computed by backprojecting them to the SSC SAR image and interpolating the intensity of the surround-ing pixels. However a lot of transformations are needed (Figure 2):
(xo, yo) f1
−→(E, N)−−−−−−→Redf earn (λ, φ)−DEM−−−→H −−−→geoid h f2
−→(X, Y, Z)−−−−−−−−−−→direct georef erencing xs, ys
The transformations are described in the following subsections.
3.1 Computation of projection coordinates (f1)
Assuming that the origin of the orthoSAR image isEA, NAand
its scale iss, the projection coordinates of a pixelxo, yois given
Figure 2: Transformations of coordinate systems.
by:
E=EA+s·xo
N=NA+s·yo (1)
The translation and scale are computed by the user selected scale and resolution of the orthoSAR image, as well as by the area which spans the SAR image and which is taken from the SAR metadata XML file.
3.2 Computation of geodetic coordinates (Redfearn series)
The transformation from Easting, Northing to geodetic coordi-nates of a Transverse Mercator projection is given by the Red-fearn series (RedRed-fearn, 1948):
λ=λ0+
x1
V1
1!c1(k0v1)1
− x
3
V3
3!c1(k0v1)3
− x
5
V5
5!c1(k0v1)5 −
− x
7
V7
7!c1(k0v1)7
φ=φ1−
x2
β1t1U2
2!(k0v1)2 −
x4
β1t1U4
4!(k0v1)4 −
x6
β1t1U6
6!(k0v1)6−
−x
8
β1t1U8
8!(k0v1)8
(2)
The parameters of the series are given in the Appendix.
3.3 Computation of orthometric elevation (DEM)
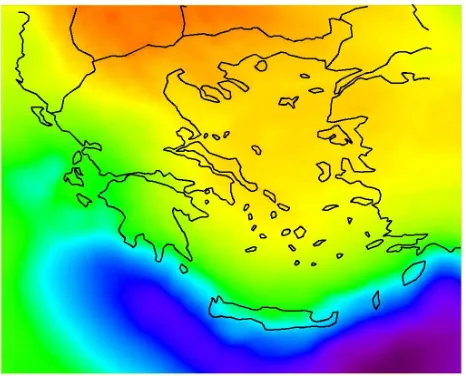
Figure 3: Geoid undulation over the country according to EGM2008.
3.4 Computation of geometric elevations (geoid)
The geometric elevationhis computed by the orthometric eleva-tion and the undulaeleva-tionN:
h=H+N (3)
The undulation (Figure 1) is computed with the EGM2008 geoid model, using the self-contained suite of coefficient files, FOR-TRAN software, and pre-computed geoid grids provided by (Pavlis et al., 2008). The software uses a1′
×1′grid (in geodetic
coor-dinatesλ, φ) and6×62D spline to interpolate the undulation.
Two optimizations were done to the FORTRAN code. First, the original code padded 7 columns and rows each time it was run in order to account for the fact that the Earth is round in both di-rections. These rows and columns were embedded into the grid in order to make the process faster. Second, in the vast major-ity of all cases the undulation is computed locally and thus it is unnecessary to read the whole grid (about 1 GB). The code was modified to input only the part of the grid that is actually needed, improving the computation time and the memory consumption. Should a local geoid model be available, the undulation is com-puted using it. If the local geoid fails to compute the undulation of a point, the computation falls back to the EGM2008.
3.5 Computation of geocentric coordinates (f2)
The geocentric coordinates are computed from the geodetic coor-dinatesλ, φand the geometric elevation h:
N′ = a
p
1−e2·sin2(φ)
X = (N′+h)
·cos(φ)·cos(λ)
Y = (N′+h)
·cos(φ)·sin(λ)
Z = [(1−e2)N′+h]·sin(φ) (4)
Figure 4: The archived local DEM over the test site.
3.6 Computation of SSC image coordinates (direct geore-ferencing)
The SSC image pixel coordinates are computed using direct geo-referencing. No GCPs are necessary as the translation and scale parametersR0,∆R, t0,∆tAZof the physical model of the
sen-sor are taken or are computed from the SAR metadata XML file (Vassilaki et al., 2011):
xs=
RP−R0
∆R , ys=
tP−t0
∆tAZ
The distanceRP from the sensor to the target point P, and the
timetPof the point acquisition are computed from the geocentric
coordinatesX, Y, Zof point P, and orbital data taken from XML file.
4 APPLICATION
The study area is in the greater north-eastern region of Athens, Greece. It has steep mountainous terrain, with average elevation 270 m and it is generally covered by sparse vegetation. It also includes two small urban regions. The data used is:
(a) a whole scene of a Single Look Slant Range (SSC) TerraSAR-X product which was captured in 2009 with 300 MHz High Res-olution SpotLight imaging mode. The scene covers an area of about 50 Km2(5x10 Km) (Figure 8). The polarisation is HH and the scene centre incidence angle is 53◦. The projected spacing values for range and azimuth are 0.45 m and 0.87 m, respectively. (b) the EGM 2008 global geoid model (Figure 3).
(c) the tiles of the SRTM-CGIAR (Figure 5) and the ASTER (Fig-ure 6) global DEMs over the test site. The nominal absolute ver-tical accuracy of the used global DEMs is 16 m and 20 m respec-tively.
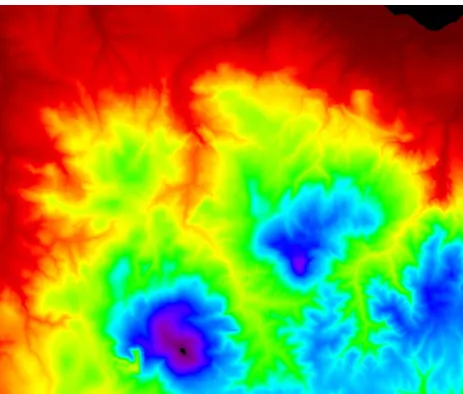
(d) two local, more accurate, DEMs one archived (Figure 4) and one recent (Figure 7). The nominal absolute vertical accuracy of the both local DEMs is 4 m. The archived local DEM is available in the form of paper maps with contours of 4 m interval while the recent local DEM is available in digital form with 5 m pixel size. Preprocessing was performed in order to convert the archive DEM in digital form (geodetic reference system transformations and resampling, digitization of the contours and computation of the Delaunay triangulation).
(e) a recent optical orthoimage which has been produced using the recent DEM. Its pixel size is 0.5 m and it is of nominal abso-lute planar accuracy 2.5 m.
Figure 5: The global SRTM DEM over the test site.
Figure 6: The global ASTER DEM over the test site.
Figure 7: The recent local DEM over the test site.
Figure 8: The distribution of the CPs on the SSC TerraSAR-X image.
Figure 9: The geometrically corrected image using the ASTER DEM.
using the direct georeferencing method (Vassilaki et al., 2011), without using any form of ground control information. The or-thorectification was based on backprojecting as stated before and the proposed process was implemented in FORTRAN and was embedded into an open source CAD (Stamos, 2007) for conve-nience and usability (Figure 9).
The accuracy of the orthorectification was evaluated using 108 independent CPs. The points were collected independently on the four 2D orthorectified SAR images. The same points were also collected in the 3D object space using the recent optical orthoim-age and the corresponding recent local DEM. Figure 8 shows the distribution of the CPs on the SSC SAR image. The planar resid-uals of each point between the measured coordinates in the 3D object space and the measured coordinates in the 2D orthorec-tified SAR images were then computed. The minimum and the maximum residuals as well as the RMSE in meters are shown in Table 1 for the SRTM, the ASTER, the archived and the recent DEMs.
min 0.8 0.1 0.8 n/a
Recent max 1.9 -7.5 7.7 n/a
RMSE 3.0 2.4 3.9 n/a
Table 1: The CPs errors.
DEM Expected error Expected error elev. error sensor’s specifications analytic computation
2 1.7 1.8
6 4.9 5.3
8 7.0 7.0
16 13.0 14.0
Table 2: The expected planar error (m) for incidence angle 50◦.
However, the analytic computation of the error assumes that the vertical accuracy is 3/2 of the planar accuracy, which is not the case here. Since direct georeferencing is used, the planar error is the nominal planar error of the georeferecing which is 1-2 m (Bresnahan, 2009), (Roth et al., 2004), while the vertical error of the global DEMs is much higher (16 m and 20 m for the SRTM and ASTER respectively). Using the analytic formulas of (Vas-silaki, 2012) taking into account these errors, the expected pla-nar errors are 9.5 m and 12 m, which are closer to the computed RMSE.
Furthermore, in Europe the vertical accuracy is better than the nominal (Rodriguez et al., 2006), and in fact, in the test site, the vertical errors are by chance even smaller (7.4 m and 5.9 m), as computed by the CPs (Table 1). Using the analytic formulas tak-ing into account these vertical errors, the expected errors are 4.6 m and 3.6 m, which are even closer to the computed RMSE (Ta-ble 1).
The high accuracy computed in the present test site, though not unique (Rodriguez et al., 2006), does not generaly represent other areas of the world. For example the computed planar RMSE of the 2D ortho SAR image produced using the ASTER DEM is 3.8 m, while in the general case it should be about 12 m.
5 CONCLUSIONS
In this paper a process for the rapid geometric correction of slant range (SSC) TerraSAR-X images was presented. The process is fully automated as it is independent of GCPs and uses global geoid model and global DEMs which are readily available. The process gives more than satisfactory results in the present test site. For future research other test sites could be used, and perhaps more accurate CPs.
APPENDIX
The parameters of the Transverse Mercator projection are:
x=E−E0, y=N−N0
Figure 10: Expected planar error according to the sensor’s speci-fications (in black) and according to analytical equations (in red).
V1= 1
whereaandbare the semi-major and semi-minor axis of the el-lipsoid,λ0is the longitude of the central meridian,k0is the scale
factor on the central meridian andE0, N0are the false Easting
and false Northing of the Transverse Mercator projection.
ACKNOWLEDGEMENTS
REFERENCES
ASTER GDEM Validation Team: METI/ERSDAC, NASA/LPDAAC, USGS/EROS, 2009. ASTER Global DEM Validation, Summary Report, 28 p.
Bamler, R., 1999. The SRTM Mission: A World-Wide 30 m Res-olution DEM from SAR Interferometry in 11 Days. Photogram-metric Week 99, pp. 145–154.
Bresnahan, P., 2009. Absolute Geolocation Accuracy Evaluation of TerraSAR-X Spotlight and Stripmap Imagery – Study Results. Civil Commercial Imagery Evaluation Workshop, 31 March – 2 April, 2009, USGS, Fairfax Virginia, USA.
Foerste, C., Bruinsma, S., Flechtner, F., Marty, J-C, Lemoine, J.-M., Dahle, C., Abrikosov, O., Neumayer, K.H., Biancale, R., Barthelmes, F., Balmino, G., 2012. A preliminary update of the Direct approach GOCE Processing and a new release of EIGEN-6C presented at the AGU Fall Meeting 2012, San Francisco, USA, 3–7 Dec, Abstract No. G31B-0923, 2012.
Fritz, T., Eineder, M., Lachaise, M., Roth, A., Breit, H., Schaet-tler, B., Huber, M., 2007. TerraSAR-X Ground SegmentLevel 1b Product Format Specification. DLR, 257 p.
Mikhail, E.M., Bethel, J.S., McGlone, J.C., 2001. Introduction to modern photogrammetry. John Wiley and Sons, Inc. New York, 479 p.
Pavlis, N.K., Holmes, S.A., Kenyon, S.C., Factor, J.K., 2008. An earth gravitional model to degree 2160: EGM2008. 2008 General assembly of the European Geosciences Union in Vienna, Austria, April 13–18.
Redfearn, J.C.B., 1948. Transverse Mercator formulae. Survey Review, 9(69), pp. 318–322.
Rodriguez, E., Morris, C.S., Belz,J.E., 2006. A global assessment of the SRTM performance. Photogrammetric Engineering and Remote Sensing, 72(3), pp.249–260.
Roth, A., Huber, M., Kosmann, D., 2004. Geocoding of TerraSAR-X Data. International Archives of Photogramme-try, Remote Sensing and Spatial Information Sciences, 35(3), pp. 840–845.
Stamos, A.A., 2007. ThanCad: a 2dimensional CAD for engi-neers. Proceedings of the Europython2007 Conference, Vilnius, Lithuania.
Vassilaki, D.I., Ioannidis, C., Stamos, A., 2011. Georeference of TerraSAR-X images using science orbit data. EARSeL Sympo-sium Proceeding: Remote Sensing and Geoinformation not only for Scientific Cooperation in Prague, Czech Rebublic, May 30 – June 2, pp. 472–480.