VOLUME BASED DTM GENERATION FROM VERY HIGH RESOLUTION
PHOTOGRAMMETRIC DSMS
B. Piltz*, S. Bayer, A.M. Poznanska
German Aerospace Center (DLR), Institute of Optical Sensor Systems, Berlin Adlershof, Germany (bjoern.piltz, steven.bayer, anna-maria.poznanska)@dlr.de
Commission III, WG III/1
KEY WORDS: digital surface model; digital terrain model; multi-directional; ground filtering
ABSTRACT:
In this paper we propose a new algorithm for digital terrain (DTM) model reconstruction from very high spatial resolution digital surface models (DSMs). It represents a combination of multi-directional filtering with a new metric which we call normalized volume above ground to create an above-ground mask containing buildings and elevated vegetation. This mask can be used to interpolate a ground-only DTM. The presented algorithm works fully automatically, requiring only the processing parameters minimum height and
maximum width in metric units. Since slope and breaklines are not decisive criteria, low and smooth and even very extensive flat objects are recognized and masked. The algorithm was developed with the goal to generate the normalized DSM for automatic 3D building reconstruction and works reliably also in environments with distinct hillsides or terrace-shaped terrain where conventional methods would fail. A quantitative comparison with the ISPRS data sets Potsdam and Vaihingen show that 98-99% of all building data points are identified and can be removed, while enough ground data points (~66%) are kept to be able to reconstruct the ground surface. Additionally, we discuss the concept of size dependent height thresholds and present an efficient scheme for pyramidal processing of data sets reducing time complexity to linear to the number of pixels, !(#$).
1. INTRODUCTION
The heterogeneity and continuous change in cities and urban areas pose a challenge for geographic information system (GIS) professionals. Very high-resolution remote sensing data serve as a suitable basis for many urban applications and have become the de facto industry standard. With the availability of digital frame cameras, an additional benefit emerges through the simultaneous availability of multispectral true orthophoto mosaics (TOMs) and highly accurate digital surface models (DSMs). These data form an indispensable basis for reliable urban research, but to obtain detailed thematic and geometric information on urban objects – a prerequisite for further semantic labelling and analysis – absolute height information is necessary. This, however, requires a digital terrain model DTM, which is used to produce a normalized DSM (nDSM) containing object heights normalized to the ground. While there are many methods for DTM generation from LIDAR data, the number of methods for photogrammetric DSM is rather moderate and either not time-effective or robust enough. In particular, commercial software has its limitations, lack of sufficient documentation being one of them.
We present a DTM generation algorithm well-suited for very high spatial resolution (VHSR) airborne data which robustly identifies and eliminates man-made objects and elevated vegetation (trees and shrubs) in a time-efficient manner. Following the work of Perko et al. (2015) we use a multi-directional approximation of the global problem to achieve the necessary speed, but add a novel robust metric called normalized volume above ground.
1.1 State of the Art
Automatic ground classification is a necessary part of DTM generation. To differentiate between elevated artificial objects
* Corresponding author
1
Quote: „The DTM has then been processed out of the DSM using a ‚Winston-Salem’ algorithm developed by Microsoft “.
and ground, different filter algorithms were developed which can be divided into two main groups: directional filtering methods and neighbourhood-based methods. Examples of filtering approaches are morphological filtering (Vosselman, 2000), adaptive TIN models (Axelsson, 2000), sturdy interpolation (Kraus et al., 1997), hierarchical robust linear prediction (Kraus and Pfeifer, 2001) and Multi-Directional Ground Filtering (MGF) (Meng et al., 2009). A comparison of different filtering algorithms can be found in Sithole and Vosselman (2004) and Meng et al. (2010). Recent progress in using multispectral high-resolution aerial images to derive Digital Surface Models (DSM) with high absolute and relative accuracy (Hirschmüller, 2005; Hirschmüller, 2008) have led to several image-based methods for DTM generation. These methods can be categorized into commercial and scientific approaches.
1.1.1 Commercial vendors: One example of image-based DTM generation is the UltraMap software for UltraCam camera systems. UltraMap offers a full photogrammetric workflow including DSM and DTM generations. For the DTM filtering process an undocumented algorithm1 is used to classify an image into around 15 object classes. This classification is used for the automated filtering of the DSM (Wiechert and Gruber, 2010). Another commercial software for image-based DTM generation, DTMaster, supports a wide range of optical sensors. Filtering is performed on a photogrammetric point cloud to separate buildings and elevated vegetation from ground points. (Trimble, 2016).
1.1.2 Several academic approaches have been developed in addition to the commercial approaches.
A simple and common method is the morphological opening. The morphological opening uses the erosion and dilation filtering operations to find the minimum and maximum pixel value.
Simple opening operations have many disadvantages like the underestimation of the ground level. Due to the disadvantages of the morphological opening most of the already published approaches are two-stage processes: first the identification of relevant pixels (ground or elevated pixel) and second the interpolation of the DTM. Mayer (2003) developed a region-based approach for photogrammetrically produced DSM for urban areas. The height information of the DSM is used to distinguish between elevated and ground pixels. Elevated pixels can be found through a higher pixel value in comparison with neighbour pixels. Based on the generated above-ground-model all elevated objects can be derived through a threshold. Finally, all elevated pixels are interpolated by Delaunay-triangulation to generate the DTM. Schiewe (2001) presents a further region-based method: Segments are classified in elevated and ground segments with segmentation methods which are not executed on the DSM directly but on an image which represents the slope of the DSM. Bochow (2009) published a method for DTM generation that is based on the identification of ground points. The identified ground pixel will be checked and used for the interpolation to a DTM.
Perko et al. (2015) developed a fully automatic filtering approach for DSMs from satellite images. This approach is a further development of already existing DTM generation algorithms and based on three main steps. First, the determination of all points that are located on bare-earth regions. Second, the elimination of the non-bare-earth regions. Third, filling of holes through interpolation. The main innovation of this method is the integration of multi-directional processing with the local slope of the terrain within the DTM processing, the so-called multi-directional slope dependent (MSD) filtering. MSD filtering is a robust and simple filtering method which is expanded by the algorithm presented in this paper.
1.2 Motivation
Our primary concern has been to develop a method to robustly identify buildings in a DSM. We do this by first generating an intermediary product called a normalized DSM (nDSM) which consists of the difference between a DSM and a DTM.
&'() = '() − ',) (1)
In the interest of generating an optimal nDSM for the purpose of detecting buildings we make some demands on the DTM which might deviate from the conventional definition of a DTM.
1. We prefer to leave most of the DSM untouched. Traditionally DTMs are preferred to be smooth and void of detail. This could be achieved by post-processing the DTMs produced by our algorithm.
2. We prioritize completeness of our elevated mask. In other words, the cost of misclassifying part of an elevated object as ground is high since it leads to the terrain being interpolated up to roof top height, whereas misclassifying ground areas typically only leads to ground pixels being interpolated by neighbouring ground pixels.
3. We want to keep larger man-made structures, like terraces, in the DTM, so we can detect buildings on top of these.
In addition, general problems that have to be overcome when calculating a DTM from DSM are:
1. Regional search leads to bad (quadratic) performance. This has been alleviated by the multi-direction search methods.
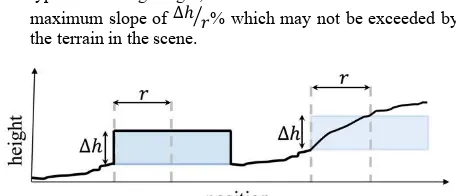
2. Methods based on height difference to a local minimum will have problems with flat extended structures (e.g. warehouses). When choosing a search radius . large enough to accommodate the largest structures in the scene and large (100 m kernel) Gauss filter on the DSM, but this only works on gradual height changes and not on terraces and terrace-like terrain.
2. ALGORITHM
Our method builds upon the multi-directional filtering method. In this section we concentrate on the second step in that algorithm and describe how to generate a ground/elevated mask from a DSM.
2.1 Input
The algorithm takes as its input a DSM and the parameters height threshold1 and maximum object size2345.
• 1 signifies the lowest height at which an object is classified as elevated.
• 2345 is the largest width an elevated object can
display. It has a direct influence on the processing time of the algorithm.
2.2 Overview
The algorithm consists of the following steps:
1. First the DSM is cut up into 1-dimensional height profiles, henceforth referred to as scanlines. We traverse the DSM four times. Once for each of the directions East-West, North-South, and the two diagonals.
2. For each scan line V and the threshold1, we define a function which assigns a score to each pair (6, 2) representing the cross-sectional area of a hypothetical elevated object starting at position x and extending w
pixels.
3. Using the function defined in step 2 and a graph algorithm we find the set of (6, 2) pairs which together add up to the largest volume. We use these pairs to create a mask for the scanline.
4. We then combine the four directional masks we have generated for the DSM by a simple majority voting, i.e. a pixel is classified as elevated if three or more of the directional masks agree.
5. Finally, the height data is interpolated in the areas indicated by the mask. This step is beyond the scope of this article.
2.3 The normalized volume above ground function
Given a single line of DSM data V and a minimum height threshold21, we define a function which assigns a score to any
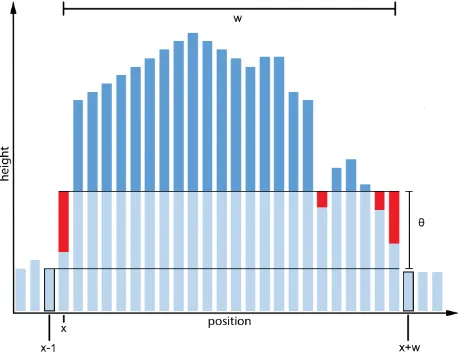
(6, 2) pair. The score represents the volume of a hypothetical elevated object starting at position 6 and extending 2 pixels. Our first attempt sums up the area between 6 and 6 + 2. and normalizes it by subtracting the maximum of the two neighbouring values (6 − 1 and 6 + 2).
Figure 2. The normalized area between 6 and 6 + 2
; 6, 2 = <=− max <5AB, <5CD
5CDAB
=E5
(2)
This is a first approximation, but it has the disadvantage that it is
greedy: it will classify unwanted pixels as elevated, even though their contribution to the total area is marginal. (See Figure 4) Therefore, we add a negative term to the equation. This leads to the actual definition of the normalized volume above ground,
&FGH:
Figure 3. The &FGH area function. The cross-sectional area is defined as the dark blue area minus the red area.
2
For now, we assume 1 is a fixed value. In section 2.3.1 we discuss the possibility of making the threshold dependent on object size.
&FGH 6, 2 = <=− max <5AB, <5CD − 1 5CDAB
=E5
(3)
In plain English the fact that z = nvag(x, w) (where N > 0) can be interpreted as “There is an elevated object starting at position x, extending w units, with an average height of N/2 + 1”
Figure 4. The effect of the negative 1 term. Above: the elevated objects found without the term. Below: the solution found when using the term. Including the term makes the algorithm less
greedy.
2.3.1 Size dependent threshold: In general, the height of an object correlates to its size in other directions. Therefore, it makes sense to choose a different height threshold when detecting a 100-metre-wide house than when detecting a smaller house, a car or a small bush. This can easily be accommodated by letting the user define a threshold function 1D. This is achieved by selecting a set of height/width pairs and interpolating between them. For example: a 1 m wide object is detected if it is taller than 50 cm, a 2 m broad object if it is taller than 1 m, etc.3
2.4 Maximizing the volume above ground
Once the &FGH function has been defined for one scanline of DSM data, the goal becomes to find a list of non-overlapping (6, 2) pairs (each representing an object at position 6 of width 2) which maximize the function
&FGH 6=, 2=
=
(4)
This problem can be formulated as the longest path problem in a graph, where each 6 is a vertex and each pair (6, 2) an edge between 6 and 6 + 2with weight &FGH(6, 2). An example path can be seen in the lower third of Figure 7. This task is known to have a linear time solution for directed acyclic graphs (Sedgewick and Wayne, 2011). We include pseudo code below.
Input:
• A function nvag(x, w) a volume value • A maximum for w, w_max.
• Size of the current DSM scanline, n.
Output:
• A list of (x, w) pairs. struct Node {x=0, sum=0, pred=0}
Node nodes[n] = {0} pred=0, best=0
Table 1. Pseudo-Code for finding the best set of (x, w) for one row of DSM data.
3
For Vaihingen the set of height/width pairs appeared as follows: h:0.1m@w:0.1m, h:0.5m@w:1m, h:1m@w:5m, h:2m@w:10m
for(x in [1… n])
for(w in[1 …w_max])
sum = nodes[pred].sum + nvag(x, w)
if (sum > nodes[x+w].sum)
nodes[x+w] = Node { x, sum, pred }
if (sum > nodes[best].sum
best = x+w
end if
end if
endfor
if(nodes[x].sum > nodes[pred].sum)
pred =x
endif endfor
while (best > 0)
output result (nodes[best].x, best-nodes[best].x)
best = nodes[best].pred endwhile
Table 1. continued.
2.5 Combining different directions
The preceding steps produce four masks: one for each of the N-S, E-W, NW-SE, NE-SW directions. In this last step we iterate over each pixel and decide whether it should be classified as elevated based on a consensus voting; i.e. if more than three directions have classified this pixel as elevated. One can optionally use a harsher constraint and only accept elevated objects where all four directions are in agreement. This would only accept completely free-standing structures and exclude elongated objects like bridges and walls etc.
2.6 Complexity and outlook
The computation time of the algorithm is determined by the image dimensions #×$ and maximum window size 2345,
resulting in time complexity.
!(#$2345) (5)
This leads to fast processing times for typical aerial scenarios. For instance, processing the scene Vaihingen in 45 cm resolution
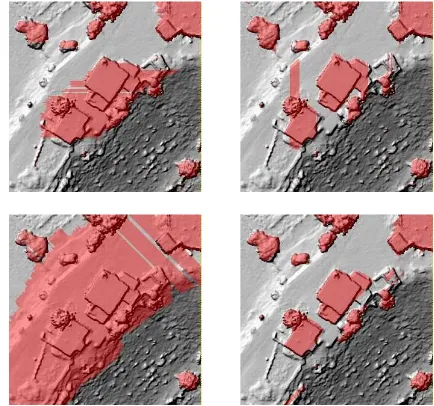
Figure 5. A visualization of the four masks representing four directions. Clockwise starting from top left: E-W, N-S, NE-SW and NW-SE.
Figure 6. A combination of all four masks. The steep cliff side is left untouched while the buildings and trees are masked out.
Figure 7. Evaluating the volume above ground function. The three areas of the diagram show, top to bottom: • The input DSM data with one row highlighted in red
• The same row as a 1D-height profile with the elevated areas marked in blue.
• The &FGH function for this row of data and a 1 value of 1m. White means zero; higher values are darker. The optimal solution for this row is shown as a graph with blue vertices and green edges. The blue vertices have been marked with blue lines to show the extent of the objects.
with a maximum window size of 120 mtakes less than a minute per km2 on commercial off the shelf hardware4.However, processing the same scene in its full 9 cm resolution with the same window size would take approximately 5T= 125 times
longer (i.e. a couple of hours per km2) which might be prohibitive. 5 A solution which has been shown to be practical is to process the same scene at different resolution levels with different window sizes and then combine the masks. The underlying assumption is that any object that is large enough to necessitate a large window size is tall enough to be detected in a degraded image.
2.7 Multi-resolution processing
Following this approach to its logical conclusion, one can build an image pyramid of the original DSM and process each pyramid level n once with the window size 2U= min(2, HWX ∙ Z) where w is the original window size in metres, gsd the ground sampling distance in metres per pixel and the newly introduced constant c, the maximum window size in pixels6. This variant produces results similar to the original algorithm with the added benefit of an improved time complexity.
!(#$) (6)
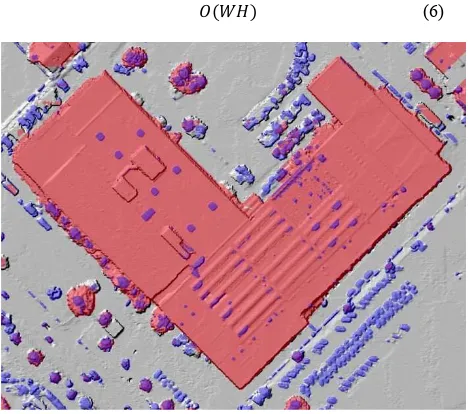
Figure 8. A combination of masks for two resolution levels. The red mask worked on a degraded DSM with a large 2345 and 1 designed to capture large buildings. The blue mask worked on the full resolution DSM, but with smaller values for 2345 and 1.
3. EVALUATION 3.1 Data Sets
Two ISPRS benchmark data sets (WG III/4), which serve as a reference for urban object detection and 3D building reconstruction (Rottensteiner et al., 2014) were used to evaluate the presented algorithm. The data is particularly well-suited for this purpose since it represents state-of-the-art airborne imagery with variable topography and heterogeneous building development. Moreover, the contained reference data serves as a basis for the quantitative evaluation of the generated elevated mask. The Potsdam data shows a typical German historic city centre with dense settlement structures and narrow streets, whereas the terrain is predominantly flat. The data of Vaihingen,
4
All our tests were performed on an 8-core Xeon 3.4 GHz CPU. 5
5# ∙ 5$ ∙ 52345= 125 ∙ # ∙ $ ∙ 2345
which is a small city in southern Germany, is characterized by many detached buildings and small multi-storey buildings. Due to the city’s location in the Enz river valley, the terrain varies in height from 200 to 300 m above ground. Small dome-like hills as well as vineyards constitute an additional challenge for DTM generation.
Both data sets consist of a true orthophoto (TOP) and a DSM. The Vaihingen data was acquired using an Intergraph/ZI DMC camera. Detailed information about the acquisition of the Potsdam data is not included. The ground sampling distance amounts to 5 cm for both the TOP and the DSM of Potsdam, and 9cm for Vaihingen. In both cases, the DSM was generated via dense image matching with Trimble INPHO software. For the Potsdam data a normalized DSM representing the absolute heights above the ground is provided. In addition, a labelled ground truth including six of the most common land cover classes (impervious surfaces, buildings, low vegetation, trees, cars, as well as background/clutter) is available for both test areas. For further description of the data sets see Rottensteiner et al. (2009).
3.2 Qualitative evaluation
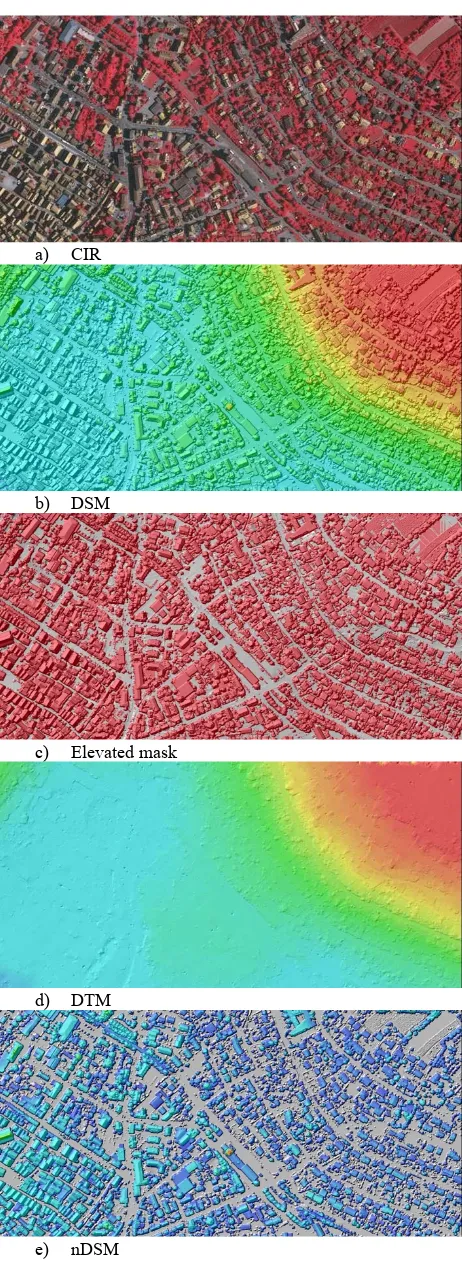
A qualitative assessment of the presented algorithm was conducted by means of a visual validation of the DTM and nDSM generated from the Vaihingen data set. The subset presented in Figure 10 shows a densely built up residential area with flat terrain in the western part and a suburban area extending up the steep hillsides. The resulting mask demonstrates the accuracy of the algorithm. It almost completely covers all elevated objects while only including some of the ground pixels. This is described in detail in the next chapter. Since a height dependent height threshold was used, both extensive buildings as well as small and low objects like cars are included in the mask. This has a positive impact on the DTM, which is spared of clutter. The elevated mask is reliable, though one dome shaped hilltop (see Fig. 9) was falsely included in the elevated mask. This is due to the fact that there are insufficient criteria to distinguish between this type of elevation and e.g. a large building.
Figure 9. A problematic area in the Vaihingen scene. Left to right: CIR orthophoto, hill shaded DSM, elevated mask. Instead of separating the castle and trees on the hill from the ground, the whole hill is detected as one single object.
3.3 Quantitative Accuracy Assessment
The immediate output of the workflow is a mask representing elevated objects but without further classification of the object type. We make a pixel-wise comparison between the mask for both data sets and the classes provided in the ground truth and present the result in one confusion matrix per considered class. A confusion matrix is an appropriate tool, due to the binary nature of the examined data. In order to ensure comparability, the reference classes buildings, trees and cars are merged into one class and then compared with the resulting elevated mask.
6
For our tests we have chosen Z = 200.
a) CIR
b) DSM
c) Elevated mask
d) DTM
e) nDSM
Figure 10. Vaihingen. From top to bottom: CIR, Ortho image, DSM, Elevated Mask, DTM, nDSM.
7
The poor sensitivity rate for cars in the Vaihingen scene is explained by the fact that a large percentage of the cars in the
There are four possible cases of accordance between the compared data: true positives (TP), true negatives (TN), false positives (FP) and false negatives (FN). From these four classes, different measures can be derived: (Fawcett, 2006; Rutzinger et al., 2009). We compute the sensitivity (also called recall or
completeness) for each class and in addition, for the elevated mask, specificity (also called true negative rate) and precision
(also called correctness). The results of the accuracy assessment for both test sites are presented in Table 2.
Accuracy Assessment Potsdam
elevated mask (buildings
, trees & cars)
Build ings Cars
Gro und
Sensitivity = TP/(TP+FN) 94,60 99,74 94,64 66,85
Specificity = TN/(FP+TN) 83,08 n. a. n. a. n. a.
Precision = TP/(TP+FP) 70,23 n. a. n. a. n. a.
Accuracy Assessment Vaihingen
Sensitivity = TP/(TP+FN) 93,82 98,03 67,877 66,17
Specificity = TN/(FP+TN) 66,17 n. a. n. a. n. a.
Precision = TP/(TP+FP) 74,23 n. a. n. a. n. a.
Table 2. Average accuracy assessment results for Potsdam and Vaihingen
The table demonstrates the quality of the outcomes. With a near 95% sensitivity rate (over 98% for buildings), the elevated mask is almost entirely complete, due to the low rate of false negatives. The higher rate of false positives has a negative impact on the remaining measures - in particular precision is affected. As shown in Figure 11, the calculated elevated mask in many cases extends over a wider area than the reference objects in the orthophoto, producing many false positives.
Figure 11. Resulting elevated mask in comparison to the reference data. In both pictures, the contours show buildings and vehicles as provided by the ground truth data. The left image shows a hillshade of the original DSM with the elevated mask in red. The right image shows the corresponding orthophoto.
This is caused to a high degree by the quality of the available DSM or rather by the fact that the reference was manually created based on TOP and not DSM. Since the presented algorithm only considers the DSM, it reproduces any errors caused by the matching process. Ironically, this will lead to better DTMs, since the false height values are masked out. More substantial are the false negatives, causing false heights in the final DTM. One
ground truth data are only visible in the orthophoto and are not present in the DSM.
exemplary FN-caused error is presented in figure 12. It does not occur in our final result, but was an effect of choosing a too low value for 2345. It is caused by the large extent of the building
block in both horizontal and vertical directions, which in combination causes the omission.
Figure 12. False negatives in the elevated mask cause errors in the final DTM and nDSM8.
In order to verify how accurately the particular reference classes are represented in the elevated mask, the sensitivity per class is calculated. It is impossible to determine the other measures, since the TN and FP values cannot be estimated. The sensitivity of buildings and cars is almost perfect. the sensitivity for the ground, in contrast, (incl. low vegetation and impervious surfaces) can be regarded as sufficient at approximately 67%. In general, the overall accuracy of the elevated provides a reliable basis for the subsequent interpolation of the DTM.
3.4 Discussion
A DTM classification relying solely on DSM analysis will not generate a perfect result. In particular, we expect problems in the following areas:
1. Mountain peaks will be classified as elevated objects if they are sufficiently steep.
2. Dense forests will not necessarily be detected. This will especially be the case on hillsides, where the neighbouring ground pixels have significantly different heights.
3. Non-free standing (i.e. bunker like) objects might not be detected.
Strengths of the algorithm are:
1. Robustness: Choosing volume as a central metric makes for an intuitively robust classifier.
2. Objects which have non-vertical walls to one or more sides9 are detected fully, that is all the way down to the ground and not starting at some arbitrary height threshold.
3. Efficiency, simplicity and ease of use.
8
a) The elevated mask. b) The DTM produced by interpolating with the mask. c) Hill shade representation of the same DTM showing an artificial hill. d) False colour representation of the nDSM showing an erroneous ‘hole’ in the building.
3.5 Conclusion
We have presented a multi-directional DSM filtering method that generates bare-ground DTM models for the specific purpose of creating normalized DSMs. Exemplary results were shown based on the two ISPRS benchmarks Potsdam and Vaihingen and a quantitative comparison was made with ground truth data. The experiments show that the method displays sufficient sensitivity (>98%) to robustly remove buildings while at the same time leaving enough bare earth pixels (>66%) to reconstruct the ground surface. This is done in ! #×$×2345 complexity
which, at the least, can be expected for a local image operator. We also presented a pyramidal approximation which reduces the complexity to ! #×$ , making it feasible to process extremely high resolution(<5cm) scenes. Additionally, we have described how to use size dependent height thresholds to clear a scene of objects of widely different sizes (shrubs, cars, trees, buildings) in one sweep.
3.6 Outlook
This paper has introduced the new metric normalized volume above ground and shown how to use it to efficiently produce elevated/ground masks based purely on DSMs. It remains to be seen how this metric can be combined with other image-based GIS metrics like NDVI/slope/variance.
ACKNOWLEDGEMENTS
This study was funded by the German Aerospace Center, DLR. The Vaihingen data set was provided by the German Society for Photogrammetry, Remote Sensing and Geoinformation (DGPF) (Cramer, 2010):
http://www.ifp.uni-stuttgart.de/dgpf/DKEP-Allg.html. The Potsdam dataset was provided by BSF
Swissphoto The support is gratefully acknowledged by the authors.
REFERENCES
Axelsson, P., 2000. DEM Generation from Laser Scanner Data Using adaptive TIN Models. International Archives of Photogrammetry and Remote Sensing, 33(Part B4/1), 110–117.
Bochow, M., 2009. Dissertation Automatisierungspotenzial von Stadtbiotopkartierungen durch Methoden der Fernerkundung.
Cramer, M., 2010. The DGPF-Test on Digital Airborne Camera Evaluation – Overview and Test Design. Photogramm. - Fernerkundung - Geoinf. 2010, 73–82.
Mayer, S., 2003. Automatisierte Objekterkennung zur Interpretation hochauflösender Bilddaten in der Erdfernerkundung. http://edoc.hu-berlin.de/dissertationen/ mayer-stefan-2004-02-13/PDF/Mayer.pdf
Fawcett, T., 2006. An introduction to ROC analysis. Pattern Recognit. Lett. 27, 861–874.
Hirschmüller, H., 2005. Accurate and efficient stereo processing by semi-global matching and mutual information. IEEE Int. Conf. Comput. Vis. Pattern Recognit. 2, 807–814.
9
An extreme case of this would be a pyramid or cone-shaped building, but there are many real life examples where a combination of a building and neighbouring structures and vegetation complete a gradual slope from the roof top to he ground in the DSM.
Hirschmüller, H., 2008. Stereo processing by semiglobal matching and mutual information. IEEE Trans. Pattern Anal. Mach. Intell. 30, 328–341.
Kraus, K., Fernerkundung, P., Wien, T.U., Wien, A., 1997. Eine neue Methode zur Interpolation und Filterung von Daten mit schiefer Fehlerverteilung. VGI, Österreichische Zeitschrift für Vermessung und Geoinf. 85, pp. 25–30.
Kraus, K. and Pfeifer, N., 2001. Advanced DTM Generation from LIDAR Data. International Archives of Photogrammetry Remote Sensing and Spatial Information Sciences, vol. 34, no. 3/W4, pp. 23-30
Meng, X., Currit, N., Zhao, K., 2010. Ground filtering algorithms for airborne LiDAR data: A review of critical issues. Remote Sensing. 2, pp. 833–860.
Meng, X., Wang, L., Silván-Cárdenas, J.L., Currit, N., 2009. A multi-directional ground filtering algorithm for airborne LIDAR.
ISPRS Journal of Photogrammetry and Remote Sensing, 64(1),
pp. 117-124.
Perko, R., Raggam, H., Gutjahr, K.H., Schardt, M., 2015. Advanced DTM Generation from Very High Resolution Satellite Stereo Images, ISPRS Annals of Photogrammetry, Remote Sensing and Spatial Information Sciences, II-3/W4, pp. 165–172.
Rottensteiner, F., Sohn, G., Gerke, M., Wegner, J.D., 2009. ISPRS Test Project on Urban Classification and 3D Building Reconstruction: Evaluation of Object Detection Results http://www2.isprs.org/tl_files/isprs/wg34/docs/ComplexScenes _revision_v4.pdf
Rottensteiner, F., Sohn, G., Gerke, M., Wegner, J.D., Breitkopf, U., Jung, J., 2014. Results of the ISPRS benchmark on urban object detection and 3D building reconstruction. ISPRS J. Photogramm. Remote Sens. 93, pp. 256–271.
Rutzinger, M., Rottensteiner, F., Pfeifer, N., 2009. A Comparison of Evaluation Techniques for Building Extraction From Airborne Laser Scanning. IEEE J. Sel. Top. Appl. Earth Obs. Remote Sens. 2, pp. 11–20.
Schiewe, J., 2001. Ein regionen-basiertes Verfahren zur Extraktion der Geländeoberfläche aus digitalen Oberflächen-Modellen. Photogramm. - Fernerkundung - Geoinf. 2, pp. 81–90.
Sedgewick, R., Wayne, K., 2011. Algorithms, Advances in neural information processing systems. Addison-Wesley Professional.
Sithole, G., Vosselman, G., 2004. Experimental comparison of filter algorithms for bare-Earth extraction from airborne laser scanning point clouds. ISPRS Journal of Photogrammetry and Remote Sensin, 59, pp.85–101.
Trimble, Inpho Software : DTMaster http://trl.trimble.com/
docushare/dsweb/Get/Document-789929/022516-019C_Inpho_DTMaster_TS_A4_0815_LR.pdf
Vosselman, G., 2000. Slope based filtering of laser altimetry data. International Archives of Photogrammetry and Remote Sensing, 33, Part B3/2 33, pp. 678–684.
Wiechert, A., Gruber, M., 2010. DSM And True Ortho Generation With The Ultracam-L - A Case Study. ASPR Annual Conference, pp. 26-30.