RETRIEVING SURFACE SOIL MOISTURE FROM MODIS AND AMSR-E DATA: A
CASE STUDY IN TAIWAN
C.F. Chen a,b*, Y.J. Lin b, L.Y. Chang b, N.T. Son a
a
Center for Space and Remote Sensing Research – (cfchen, lychang, ntson)@csrsr.ncu.edu.tw
b
Department of Civil Engineering - [email protected]
National Central University, Jhongli, Taiwan
Commission III, WG III/5
KEY WORDS: MODIS data, Surface soil moisture, Taiwan.
ABSTRACT:
Soil moisture is a key factor that controls the exchange of water between land surface evaporation and plant transpiration. Information on surface soil moisture variations in both time and spatial domains is important for numerous applications, especially agricultural and environmental monitoring. This study aimed at retrieving surface soil moisture from daily MODIS and AMSR-E (Advanced Microwave Scanning Radiometer - Earth Observing System) data. A case study was conducted in Taiwan for 2009. Data were processed using the Temperature Vegetation Dryness Index (TVDI). This index is developed based on an empirical analysis of the relationship between land surface temperature (LST) and normalized difference vegetation index (NDVI) data. The comparison between the TVDI results and the daily precipitation data collected from meteorological stations throughout the study area indicated that there were close relationships between the two datasets. The TDVI results (values range from 0 to 1) were converted to the same unit with the AMSR-E soil moisture data (i.e., g cm-3) by linear regression analysis between these two datasets. The results achieved by this analysis were soil moisture maps that had a better spatial resolution (1 km × 1 km) than the AMSE-E soil moisture data (25 km × 25 km). The soil moisture achieved by TVDI – AMSR-E regression analysis showed the comparable spatial patterns with those from the AMSR-E soil moisture data. A quantitative analysis between the soil moisture (deduced from TVDI-AMSR-E analysis) and the AMSR-E soil moisture data also reaffirmed significant correlations between the two datasets. This study has demonstrated a method of surface soil moisture retrieval from MODIS and AMSR-E data.
1. INTRODUCTION
Information on surface soil moisture conditions is important for water management for specific crops. This parameter influences the transpiration rate of crops (Kramer, 1969). Thus, monitoring soil moisture is an important activity because agricultural planners need such information to devise better water and crop management strategies for agricultural development. Surface soil moisture can be monitored using climatic indices such as Palmer drought severity index (PDSI) (Palmer, 1965) and standardized precipitation index (SPI) (McKee et al., 1993). The use of these indices for regional soil moisture monitoring is infeasible because the data are usually insufficient over a large area and the cost of data acquisition is expensive.
Satellite-based indices have been developed and used for large-scale monitoring of soil moisture in the top few centimeter of soil. For instance, AMSR-E (Advanced Microwave Scanning Radiometer-Earth Observing System onboard Aqua satellite) index (g cm-3, 25-km resolution) can be used for global soil moisture monitoring. However, this index is coarse and unsuitable to be applied for the monitoring purpose in Taiwan. The temperature vegetation dryness index (TVDI) developed based on the empirical interpretation of the relationship between the normalized difference vegetative index (NDVI) and land surface temperature (LST) has widely been applied for soil moisture monitoring (Patel et al., 2008; Sandholt et al., 2002; Sun et al., 2008). The NDVI and LST were used to derive TVDI because NDVI characterizes the greenness of vegetation indicating water stress, whilst LST reflects soil moisture. Thus, the combination of these two NDVI and LST can provide more complete information on soil moisture (Carlson, 2007).
In this study, we aimed to develop an approach to retrieve surface soil moisture (g cm-3) from MODIS data for Taiwan. The
TVDI results were verified with precipitation data.
2. STUDY AREA
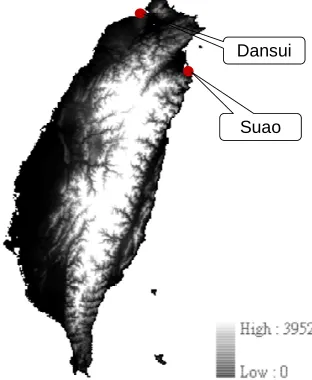
The study area (Taiwan) covers approximately 36,000 km2 and lies between 23°46′N 121°00′E (Figure 1). The elevation ranges from 0 to 3,952 m above the sea level. The study area has subtropical monsoonal climate with the mean annual precipitation of approximately 2,500 mm. The hottest month is July with the mean temperature of 27 - 28 °C and the coolest month is February (15 °C).
Suao Dansui
Figure 1. The study area showing the elevation levels and locations of two rain gauge stations used for verification of the TDVI results.
* Corresponding author.
3. DATA
MODIS and AMSR-E data for 2009 were acquired from NASA. The 8-day MODIS products used to compute TDVI include MOD09A1 (500-m resolution) and MOD11A2 (1,000-m resolution). TVDI was computed using LST and NDVI data. The spatial resolution of the NDVI data (derived from MOD11A2) is different from that of LST (derived from MOD09A1). Re-sampling of the NDVI data was necessary in order for the NDVI data to have the same resolution as the LST data. Daily volumetric surface soil moisture from AMSR-E data for 2009 were acquired and used for linear regression analysis between TVDI and AMSR-E data. The purpose of doing so was to convert TVDI to soil moisture data that had the same unit with the AMSR-E soil moisture data (i.e., g cm-3). The AMSR-E data used are given as surface volumetric soil moisture (g cm-3) in 25-km spatial resolution acquired in ascending pass (1:30 pm). The AMSR-E data formatted using cylindrical equal-area were reregistered through a geometric look-up table using latitude and longitude information. Daily rainfall data for 2009 obtained from rain gauge stations throughout the study area were collected and used for the sensitivity verification of the TVDI results.
4. METHODS
This study used TVDI method (Sandholt et al., 2002) to retrieve surface soil moisture from MODIS data. This index is calculated using NDVI and LST data. A simplified representation of TVDI is presented in Figure 2. The linear combination of NDVI-LST normally shows a strong negative relationship and could form a triangle shape if the study area is large enough to provide a wide range of NDVI and LST conditions (Gillies et al., 1997). The TVDI for each pixel can be defined using the following equation.
min
T
is the observed surface temperature at a given pixel.max
s
T
is temperature of the dry edge (the upper straight line in thetriangle). min
s
T
is the temperature of the wet edge (lower horizontal line of the triangle). The dry and wet edges were calculated from the NDVI-LST space regression with small intervals of NDVI.The values of TVDI range from 0 (maximum evapotranspiration) to 1.0 (limited water availability) based on its position in the feature space. The TDVI results were converted to the same unit with the AMSR-E soil moisture data (i.e., g cm-3) by linear regression analysis between these two datasets.
Figure 2. A simplified presentation of TVDI adapted from Sandholt et al. (2002).
3. RESULTS
3.1 Comparison of TVDI with rainfall data
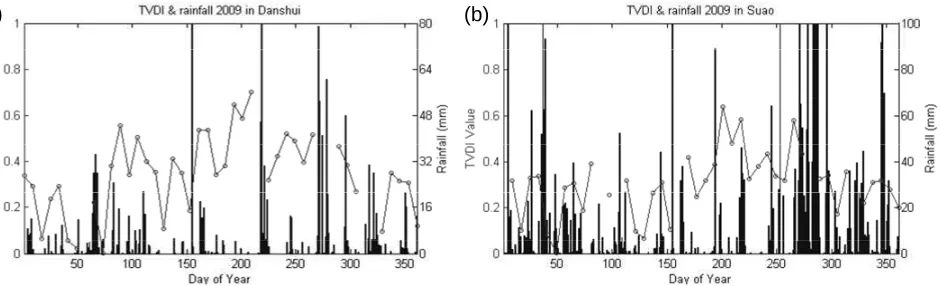
TVDI results were compared with daily rainfall data obtained from two rain gauge stations in the study area to investigate the relationships between the two datasets. In order to facilitate this comparison, TVDI values for pixels surrounding the rain gauge stations were averaged using a 3×3 kernel. The results indicated that the TVDI was generally sensitive to rainfall in most cases (Figure 3). The TVDI values declined during or after rain events, indicating greater soil moisture but increased again several days later, indicating less soil moisture (Figure 3). For example, at Danshui station the TVDI values of DOYs 17, 73 and 225 dropped during/after rain events, but increased again after several days (DOYs 137 and 193) (Figure 3a). The same phenomenon was also observed for Suao station where the TVDI values decreased at DOYs 49, 121 and 305 after the rain events, but increased again after several days at DOYs 81, 137 and 241 (Figure 3b).
(a)
(b)
Figure 3. Comparisons between TVDI and monthly rainfall data from two sampling rain gauge stations: (a) Dansui and (b) Suao.
3.2 Spatio-temporal evolution of surface soil moisture
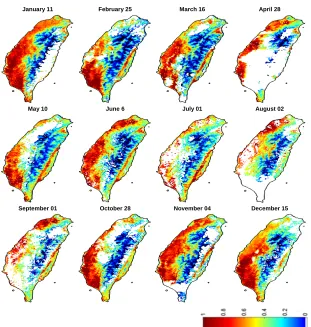
Figure 4 shows the spatio-temporal evolution of TVDI from January to December 2009. In general, the TVDI results (values from 0 to 1) show a large degree of variation in TVDI values over space and time. Low TVDI values (0 – 0.4) were generally observed at water surfaces and high elevation mountain areas. Higher TVDI values (0.4 - 0.6) were observed in the plains and lower elevation parts of the study area. High TVDI values (0.6 - 0.8 and 0.8 - 1.0) were observed mainly in coastal and residential areas. The regression analysis between TVDI results and AMSR-E soil moisture data (Figure 5) was performed to find the transformation function between the two datasets. This was done to convert the TVDI to the real soil moisture data that had the same unit with AMSR-E soil moisture data (i.e. g cm-3). The results indicated that there was good agreement between the two
datasets. The mean correlation coefficient was -0.82 and the root mean squared error (RMSE) to quantify the difference between the two datasets was 39.8. These results confirmed that the AMSR-E soil moisture data (25-km resolution) can be used to transform TVDI results to surface soil moisture data with a higher spatial resolution (1-km resolution).
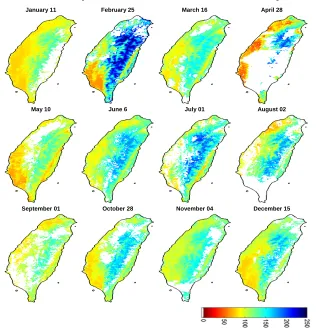
Figure 6 showed the spatial distributions of surface soil moisture (achieved by regression analysis between TVDI and AMSR-E soil moisture). In general, the spatio-temporal evolution of TVDI-derived soil moisture was comparable with those from AMSR-E data throughout the year. The areas of low soil moistures were generally concentrated in the west part of the study area, where most residents settled in the cramped plains. The areas of low soil moistures were expanded from April, but likely returned to wet conditions by the end of September due to the monsoonal influence.
January 11 February 25 March 16 April 28
May 10 June 6 July 01 August 02
September 01 October 28 November 04 December 15
Figure 4. Spatiotemporal evolution of monthly TVDI during 2009.
January 11 February 25 March 16 April 28
May 10 June 6 July 01 August 02
September 01 October 28 November 04 December 15
Figure 5. Evolution of resampled 1-km resolution AMSR-E surface soil moisture (g cm-3) in 2009.
January 11 February 25 March 16 April 28
May 10 June 6 July 01 August 02
September 01 October 28 November 04 December 15
Figure 6. Evolution of 1-km resolution surface soil moisture (g cm-3) retrieved from TVDI and AMSR-E data for 2009.
4. CONCLUSIONS
The main objective of this study was to retrieve surface soil moisture from MODIS TVDI and AMSR-E soil moisture data. The TVDI was estimated by empirical analysis of NDVI-LST space. The TVDI results verified with monthly rainfall data showed close relationship between TVDI and rainfall. The results archived by regression analysis between the TVDI results and AMSR-E soil moisture data indicated strongly negative correlation between both datasets (R2 = -0.82) and RMSE of 39.8. The areas of low soil moisture were mainly distributed in western part of the study area. The temporal evolution of TVDI showed expanded areas of low soil moisture in April that typically returned to wet conditions by the end of September. This study has shown a merit of using MODIS data to retrieve high-resolution surface soil moisture compared to AMSR-E soil moisture. Such a method for retrieving surface soil moisture with a better spatial resolution than the available ASMR-E soil moisture data in Taiwan could be transferable to other places in the world.
REFERENCES
Carlson, T., 2007. An Overview of the "Triangle method for estimating surface evapotranspiration and soil moisture from satellite imagery. Sensors, 7, pp. 1612-1629.
Gillies, R.R., Kustas, W.P., Humes, K.S., 1997. A verification of the “triangle” method for obtaining surface soil water content and energy fluxes from remote measurements of the Normalized
Difference Vegetation Index (NDVI) and surface radiant temperature. International Journal of Remote Sensing, 18, pp. 3145–3166.
Kramer, P.J., 1969. Plant and soil water relationship. McGraw Hill Inc.
McKee, T.B., Doesken, N.J., Kleist, J., 1993. The relationship of drought frequency and duration to time scales, The 8th conference of applied climatology. American Meteorological Society, Anaheim, CA, pp. 179−184.
Palmer, W.C., 1965. Meteorological drought. US Weather Bureau, Washington, D.C. .
Patel, N.R., Anapashsha, R., Kumar, S., Saha, S.K., Dadhwal, V.K., 2008. Assessing potential of MODIS derived temperature/vegetation condition index (TVDI) to infer soil moisture status. International Journal of Remote Sensing, 30, pp. 23-39.
Sandholt, I., Rasmussen, K., Andersen, J., 2002. A simple interpretation of the surface temperature/vegetation index space for assessment of surface moisture status. Remote Sensing of
Environment, 79, pp. 213-224.
Sun, W., Wang, P.X., Zhang, S.Y., Zhu, D.H., Liu, J.M., Chen, J.H., Yang, H.S., 2008. Using the vegetation temperature condition index for time series drought occurrence monitoring in the Guanzhong Plain, PR China. International Journal of Remote
Sensing, 29, pp. 5133-5144.