MONITORING MARGINAL EROSION IN HYDROELECTRIC RESERVOIRS WITH
TERRESTRIAL MOBILE LASER SCANNER
A. M. G. Tommaselli a, *, M. V. A. Moraes a, L. S. L. Silva a, M. F. Rubio b, G. J. Carvalho b, J. T. G. Tommaselli a a
Faculty of Sciences and Tecnology, UNESP, 19060-900 Presidente Prudente, S.P. Brazil, (tomaseli, tadeu)@fct.unesp.br [email protected], [email protected]
b
Duke Energy Internacional – Geração Paranapanema S.A. (mauricio.rubio, guilherme.carvalho)@duke-energy.com
Commission I/V, ICWG I/Va
KEY WORDS: Mobile terrestrial laser scanner, Monitoring, LIDAR, Point Cloud
ABSTRACT:
Marginal erosions in reservoirs of hydroelectric plants have caused economic and environmental problems concerning hydroelectric power generation, reduction of productive areas and devaluing land parcels. The real extension and dynamics of these erosion processes are not well known for Brazilian reservoirs. To objectively assess these problems Unesp (Univ Estadual Paulista) and Duke Energy are developing a joint project which aims at the monitoring the progression of some erosive processes and understanding the causes and the dynamics of this phenomenon. Mobile LASER scanning was considered the most suitable alternative for the challenges established in the project requirements. A MDL DynaScan Mobile LASER M150 scanner was selected which uses RTK for real time positioning integrated to an IMU, enabling instantaneous generation of georeferenced point clouds. Two different reservoirs were choose for monitoring: Chavantes (storage plant) and Rosana (run-of-river plant), both in the Paranapanema River, border of São Paulo and Paraná States, Brazil. The monitoring areas are scanned quarterly and analysed with base on the point cloud, meshes, contours and cross sections. Cross sections are used to visualize and compute the rate and the dynamics of erosion. Some examples and quantitative results are presented along with an analysis of the proposed technique. Some recommendations to improve the field work and latter data processing are also introduced.
* Corresponding author.
1. INTRODUCTION
Marginal erosions in reservoirs of hydroelectric plants have caused economic and environmental problems concerning hydroelectric power generation, reduction of productive areas and devaluing land parcels. The real extension and dynamics of these erosion processes are not well known for Brazilian reservoirs. To objectively assess these problems Unesp (Univ Estadual Paulista) and Duke Energy are developing a joint project which focuses on monitoring the progression of some erosive processes and to understand the causes and the dynamics of this phenomenon.
Based on this knowledge a classification system will be developed regarding to the critical zones in which some techniques of erosion mitigation will be tested. Due to the characteristics of the Brazilian reservoirs, most of the existing Geomatics techniques are sometimes unaffordable or unfeasible to provide spatial information with suitable accuracy and temporal frequency. Mobile LASER scanning was considered as the most suitable alternative for the challenges established in the project requirements, concerning productivity, sample density and final costs.
2. BACKGROUND
Monitoring coastal areas and fluvial processes are critical tasks to which several techniques have been used, from aerial photographs, orbital images, land surveying, terrestrial photogrammetry and, more recently Terrestrial and Mobile Laser Scanning. These new technologies are advantageous because of its high accuracy and time of response.
As it was pointed out by Hohenthal et al (2011) the use of high-resolution light detection and ranging altimetry (LiDAR) data in fluvial studies increased rapidly in the last years but the accuracy level of Airborne laser scanning (ALS) may not be suitable for some studies. Instead, more dense and accurate topographical data may be obtained by terrestrial laser scanning (TLS) or mobile terrestrial laser scanning (MLS). Some applications of MLS techniques are boat-based mobile mapping system (BoMMS). In this case laser scanning and imaging are performed from a boat moving along a river course and are used to enlarge the coverage of terrestrial scanning.
Alho et al (2009) presented some approaches with Multi-temporal static TLS (Terrestrial Laser Scanner) and Mobile Laser Scanning (MLS), with BoMMS (Boat Based Mobile Mapping System) and CartMMS (Cart Based Mobile Mapping System). 3-D mapping of fluvial landforms were carried out with these technologies on a centimetre scale. Change detection and volume calculations of the riverine environment were feasible with these accurate multi-temporal data. The authors also highlighted that the positioning accuracy of the GPS-IMU (Inertial Measurement Unit) system is the most critical part in the total error.
Bitenc et al (2009) assessed the performance of a Land-based Mobile Mapping System (LMMS) in mapping a stretch of sandy Dutch coast, in particular the relative quality of laser point heights and of a derived Digital Terrain model (DTM). It was shown that on a flat beach a relative precision of 3 mm was achieved, concluding that a LMMS enables the acquisition of a high quality DTM product, which is available within two days.
Pfennigbauer et al. (2011) presented practical results from a measurement campaign in surveying prehistoric lake dwellings in Germany, performed with a RIEGL’s hydrographic laser scanner aiming at the determination of the exact position, shape, and attitude of the remainders of piles. The authors showed that the assessed technique allowed a detailed view of archaeological underwater bankside structures and a precise map of the sediment surface but the periods for this kind of acquisition require clear view down to ground of the lake.
Mitchell et al. (2013) presented an approach to monitor the retreat of coastal cliffs at Carry-le Rouet, in Provence-Alpes-Côte d'Azur, France. The project was conducted with two phases of field data collection. During November 2011, a mobile laser scanning survey was undertaken, recording a first state of the cliff morphology. A second survey was successfully completed in July 2012. The processing of the two sets of data led to a first comparison that provides a complete image of the changes. The results of the survey comparison located 23 significant changes in the cliff over the span of the 3.5 km survey in a span of 8 months. The authors concluded that periodic repetition of these mobile laser scanning surveys was a satisfactory method for tracking changes. In the case studied they also recommended an annual campaign track changes at the site over time and to help coastal planning activities.
Wang et al (2013) used Mobile laser scanning (MLS) for measurements of coarse fluvial sediments in a large survey area. Their research aimed to investigate the capability of single-track MLS data for individual particle-based sediment modelling. The grain size and the sphericity as well as the orientation of each individual particle were estimated based on the extracted MLS points. The authors concluded that it is feasible to detect and to model sediment particles above 63 mm from a single-track MLS point cloud with a high reliability.
Saarinen et al (2013) developed an approach for mapping and monitoring the vegetation structure along a river channel. This is important because vegetation plays a fundamental role in stabilizing the soil and decreasing fluvial erosion. The authors
presented some metrics describing vegetation density and height from mobile laser-scanning (MLS) data. The proposed approach successfully classified vegetation cover.
Vaaja et al (2013) evaluated the data processing steps and quality of BoMMS data for generating terrain and vegetation points in a river environment, to detect shorelines and other features.
Puente et al. (2013) presented a review of performance of some mobile terrestrial laser scanning systems with an overview of the positioning, scanning and imaging devices integrated into these systems. The authors suggested that mobile laser scanning systems can mainly be divided into two categories (mapping and surveying) depending on their final purpose, accuracy, range and resolution requirements.
Amaro et al. (2013) described and assessed the application of Terrestrial Laser scanner (TLS) to monitor geomorphological changes in Natal city, Northeastern Brazilian coast. Besides the natural factors, the Ponta Negra Beach has suffered intense anthropogenic changes. The analysis based on TLS data showed intense sedimentary fluxes between the dune system and beach face. The authors evidenced that these combined factors led to hazards like the disappearance of sand, destruction of the boardwalk and other infrastructure, affecting the socioeconomic activities.
Some other works dealt with the technology of both static and mobile laser scanning, for example: (Lim et al., 2013; Mitchell et al., 2013; Alho et al., 2011; Hobbs et al., 2010; Poulton et al., 2011; Mitchell and Chang, 2011).
3. METHODOLOGY
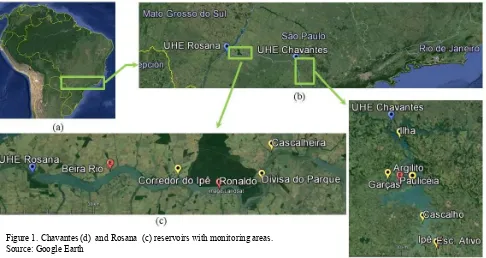
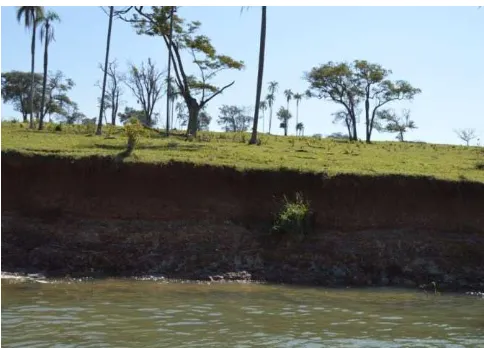
Two different reservoirs were choose for monitoring: Chavantes and Rosana, both in the Paranapanema River, border of São Paulo and Paraná States, Brazil. (see Figure 1). A typical erosion process is shown in Figure 2.
Figure 1. Chavantes (d) and Rosana (c) reservoirs with monitoring areas. Source: Google Earth
Figure 2. Example of an erosion process in the reservoirs of Chavantes, São Paulo, Brazil.
3.1 The reservoirs, morphologic features and erosion processes (general features)
The Chavantes reservoir is located about 470 m altitude. In the São Paulo edge of this reservoir, a relief formed by hills with convex tops and altitudes predominates, ranging from 500 to 700 m. In the Paraná edge tops are usually elongated and sheds are convex with valley bottoms in “V” and “U” shapes. It is a more dissected relief with altitudes ranging from 400 to 1200 m (Ross and Moroz, 1997; Santos et al, 2006).
There is little variation in soil classes and most of the soils around the reservoir represent classes of Ultisols and Oxisols. It occurs to a lesser extent Alfisols, Entisols and Inceptisols (Oliveira, 1999; Bhering and Santos, 2008). Most of these soils are covered with pastures and the remaining areas with some annual crops and forests. It was observed that both edges of this reservoir are quite populated, perhaps due to its nice landscapes.
The erosion processes observed in the edges of this reservoir were: the basal undermining with falling blocks as a function of wave action from the water surface, subsurface flows in areas of soils with clayey lower horizons, ridges and gullies as a result of animal activities, piping in the soil rock interface and rotational landslides. It was not possible to determine the prevalence of any of the processes.
The Rosana Reservoir is about 255 m altitude. In the São Paulo edge there is the presence of broad and low hills with altitudes ranging from 300 to 600 meters. In the Paraná edge elongated predominant, with high percentage of sand. Most of the soils of the São Paulo side are covered by pastures. There is also a wide big portion of forested areas and some annual crops. In the Paraná side annual crops are predominant and the remaining areas are covered by pastures and forested areas. The reservoir borders are seldom occupied.
Due to a high content of sand, soils of the Rosana reservoir are
very friable and much more susceptible to erosion processes. In this reservoir occurs: ridges associated with falls of blocks due to wave action of the reservoir, erosion by basal undermining with falling blocks, ridges and gullies associated with the presence of animals, slip with lateral spreading. The processes of basal undermining with falling blocks are the most frequent. Although not confirmed yet, there is a hypothesis that the dynamics of the reservoir (run-of-river plant) intensifies the erosion processes.
3.2 Technical approach for monitoring
The selection of suitable techniques and equipment for those reservoirs monitoring, were based on several requirements:
The reservoirs extensions;
Accuracy compatible with change detection (centimetre level);
The distances to the base stations and small river ports;
Logistics;
Based on this preliminary requirements two approaches were considered: conventional photogrammetry with direct georeferencing and; Mobile Laser Scanning (MLS) system. The MLS was preferable in this case, mainly to the LASER penetration in the vegetation and the availability of real time response in some systems.
Considering these constraints, for this project, a MDL DynaScan Mobile LASER M150 scanner was selected. The system is lightweight, portable and may be mounted on vehicles or boats to acquire 3D data. The DYNASCAN LiDAR system contains a seamlessly integrated IMU, an RTK GNSS system and a high speed laser scanner in a single pod. The DYNASCAN system includes a complete data acquisition and post processing software suite. Data from all available sensors are synchronized and recorded. Post processed and recorded data may be exported to most 3D modelling software packages (MDL, 2014).
There are two versions of DYNASCAN; one has a single MDL Scanning laser module (Figure 3), and the other has a dual laser head (MDL, 2014). This scanner uses RTK-GNSS for real time positioning integrated to an IMU and a high speed laser scanner in a single pod, enabling instantaneous deliver of georeferenced point clouds of objects at a range up to 150 m. Due to this feature, the point cloud can be visualized on the job and, just after acquisition, it can be exported and processed for product generation. Some features of this scanner are presented in Table 1. The unit used in the project has a second GNSS antenna that is used to improve the estimated heading.
The modules operate at up to 30 Hz with Pulse Repetition Rate (PRR) values of 36 kHz, while maintaining an accuracy of 5 cm. The scanner is configured to operate at a head rotation of 10 Hz producing a point cloud with points at each 3.5 cm at a distance of 20 m. The boat speed is reduced to around 3.6 km/h to produce profiles with approximately 10 cm of separation. The INS sensor is also part of the Dynascan package and enables the Dynascan to continue recording high quality data
even when the GNSS experiences short drop-outs from bridges or overhead foliage. The RTK GNSS gives centimetre -level positioning accuracy. Real Time Differential Correction Data can be received from a local Reference Station via UHF radio, Internet based Real Time Networks or Satellite correction services (MDL, 2014).
Scanner field of view 360˚ Scanner angle resolution 0.01˚
Scan rate up to 30 Hz (1800 rpm)
Pulse Measurement rate 36 KHz Attitude Accuracy
Table 1. Technical features of the MDL DYNASCAN M150.
The Dynascan is equipped with a MDL GNSS/IMU 5000, an advanced six-axes inertial navigation system. The MDL GNSS/IMU 5000 is an integration of two GNSS receivers, to give position and instant true heading, three gyros and accelerometers with 100 Hz rate to provide three axes angular and acceleration measurements. The gyros are capable to supply measurements with 0.05° in roll and pitch, and 0.1° in azimuth. Dual GNSS system, combined with RTK technique, allow centimeter accuracy in position and precise heading determination in kinematic mode.
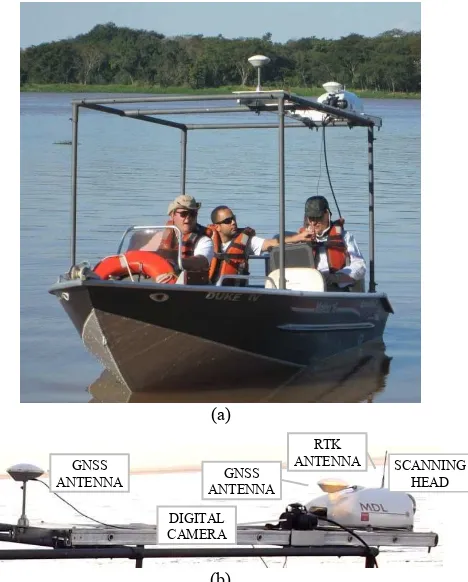
A special mount was developed to adapt an existing boat to carry the scanner and the second GNSS antenna, which is required to improve heading estimation (Figure 3.a). Besides the original scanner, a Nikon D3200 digital camera (Nikon, 2014) was adapted to the mount to produce sets of digital RGB images which are used to guide the interactive filtering and vegetation removal in the processing step. In the current implementation the camera is manually triggered and the images are geotagged with a portable GPS (GPS Unit GP-1). For future work, the acquired images will be fully integrated with the laser point cloud but this will require another camera with a compatible communication protocol to be interfaced with QINSy software, enabling synchronized triggering and accurate direct georeferencing of the images.
The suitable operation of this hardware requires a RTK base station, which has to be set in certain conditions of distance and intervisibility (for the radio signal) to the rover. A Topcon double frequency GNSS receiver with a Trimble 35W radio has been used for the base station.
A boat was specially adapted to carry the LASER scanner and a second GNSS antenna, which is required to improve heading estimation (Figure 1). A Nikon D3200 camera was also attached to provide images, which are used to guide the interactive filtering and vegetation removal in the processing step.
(a)
(b)
Figure 3. (a) Boat adapted and a Mobile Laser Scanner installed; (b) Details of the mount with the scanner parts.
Dynascan system uses customised data-acquisition and post-processing software. On-line displays allow detailed analysis and quality control of the data during the survey. Recorded data may be exported to most 3D modelling and processing software packages. The hardware communicates with Qinsy software, which was originally designed for bathymetric survey (QPS-QINSY, 2014). QINSy (Quality Integrated Navigation System) is a hydrographic data acquisition, navigation and processing software package. This software produces corrected and geo-referenced point clouds in real-time and, as a consequence, the user has a nearly finished end product after the survey was executed. The final end result can be enhanced by importing trajectory data from the Inertial Navigation System or INS, thereby improving particularly the height component to the millimetre level. A post-processed solution is also available but it requires special software.
After scanning, QLoud software is used to validate and export data. QLoud is an offline tool that is fully integrated with QINSy, importing DTM points directly from QINSy QPD files (including attributes and metadata), or from any 3rd party points files, with or without attributes and metadata (QPS-QLOUD, 2014). Automatic data cleaning tools can be applied to the entire survey or to selected sections. Validated data can be exported back to QINSy for chart production or can be exported directly to other formats. In this project, the original QPS data file is exported as a pts file that will be handled with Cyclone software and other in house developed solutions.
Cyclone (Leica-Cyclone, 2014) is a 3D point cloud processing software with several modules for different tasks, such as alignment of point clouds captured from different scanning positions (registration); modelling 3D point clouds as CAD geometry or as meshes; extraction of features; importation and
interactive edition, aiming at the elimination of noise, vegetation and other artefacts, generation of cross sections, which will be analysed to assess the evolution of the erosion process. Due to the extension of the monitoring areas three sets of products are being generated in Cyclone for further analysis:
Rendered meshes;
Cross Sections;
Contours;
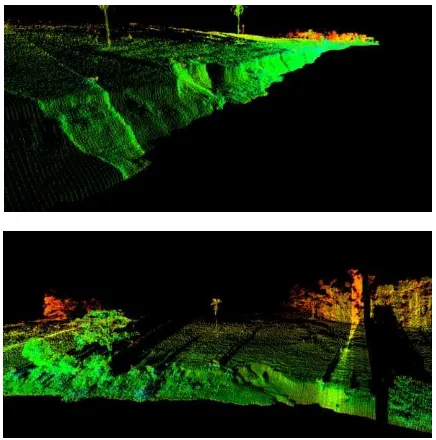
After field collection and preliminary quality control, the point clouds are filtered to eliminate points related to noise, water reflection, aquatic plants and vegetation over the margins, to left only the bare soil (Figure 4). Then, the point clouds are rendered and visually inspected (Figure 5). Cross sections with previously defined origin and orientation are generated (Figure 6) cropping a strip of the point cloud with a fixed width (1 m). Contours are also generated (Figure 7), which are used to visualize and compute the rate and the dynamics of erosion.
Figure 4. Examples of point clouds acquired with the mobile laser scanner.
Figure 5. Rendered DTM after filtering with contours overlapped.
Besides the meshes produced from filtered point clouds (Figure 4), the cross sections at predefined positions (Figure 5) and contours at a fixed elevation, are fundamental to estimate the rate of erosion. However, even after manual filtering, the cross sections may have some points that correspond to vegetation (Figure 6) and it is necessary to eliminate them using a comparison strategy. Finally, the cross sections acquired at different epochs are compared to provide quantitative
measurements of erosion evolution. Each cross section is rotated and translated to become a 2D plot (Distance from the origin and height) with all points project to this plane. The same procedure is applied for point clouds acquired in different epochs. To compare to profiles the algorithm starts with a standard height in the area; for each height the internal point for each epoch is selected, which is most likely the bare soil; then, this pair is stored and the height is increased with a previously defined value (1 m, for the examples shown later). The process is repeated until the maximum elevation. Each pair gives the distance eroded and the area of these sections can be integrated to compute the volume of erosion. The differences have to consider the uncertainty in the point position, which is around 5 cm, but can be more, depending on the scanning configurations. Being pessimistic and considering an uncertainty of 10 cm, the combined error in the distance between two points in different sections should be 14 cm. Thus, if the distance between two points in two sections from different epochs is larger than this value, it can be inferred that erosion occurred. This in-house developed application is still under assessment and only preliminary results are presented.
Figure 6. Cross sections with previously defined origin and orientation, Argilito area, Chavantes reservoir, August, 2013.
Figure 7. Contours generated from point cloud, Argilito area, Chavantes reservoir, August, 2013.
4. CAMPAIGNS AND RESULTS
In the two reservoirs, eleven areas (Figure 1) are being monitoring based on the analysis of the point cloud and in some derived products: contours and cross sections.
Monitoring activities are scheduled to occur quarterly. These monitoring activities were defined in order to obtain information on the study areas at different stages of the operational conditions of the reservoirs, which levels vary throughout the year. This sampling strategy will provide a data time series that will enable the analysis of evolution and rate of erosion.
The positional accuracy of the equipment and the resulting point cloud is one of main requirements to achieve a reliable time series. The nominal accuracy of the hardware is around 5 cm which is suitable for the target application, but the actual achieved accuracy has to be assessed either with fixed reference objects or comparing the point clouds acquired in different epochs. A preliminary accuracy analysis was performed in one of the areas (Ronaldo); some buildings façades and walls were selected and planes were adjusted to the selected points; the standard deviation of points within these selected planes were less than 6 cm, which is compatible to the nominal precision.
Further quality control is being conducted in the Garças area, in the Chavantes reservoir, with the field surveying of well-defined and stable features.
Up to now, two field campaigns in each reservoir were successfully carried out and some results are already available. Due to the limit of space some examples and quantitative results will be presented in the following paragraphs along with an analysis of the proposed technique.
Figure 9. Example of a cross section (P4), Argilito area, Chavantes reservoir: (a) August, 2013 and (b) November, 2013.
Figure 9 depicts two cross sections acquired in August, 2013 (Fig. 9.a) and November, 2013 (Fig. 9.b) in the Chavantes Reservoir, Argilito area (see Fig. 1.d). The cross sections were generated parallel with a distance of 75 m from each other. Four cross sections were analysed and the erosion evolution was measured trough distance samples, at several elevations, as presented in Table 2.
Height Cross Section
475 m 476 m 477 m 478 m
Average
P4 0.0 0.04 0.04 0.40 0.12
P5 0.08 0.09 0.08 - 0.08
P6 0.04 0.12 0.48 0.68 0.33
P7 0.04 0.08 0.08 0.04 0.06
Table 2. Distances in meters, between two points in corresponding cross sections, taken at different epochs at
Argilito area, Chavantes reservoir (August, 2013 and November, 2013).
It can be seem from the data presented in Table 2 that the erosional process is slow in this area with a maximum value of 0.68 m in cross section P6 and the average value was 0.33 m. Considering the time gap of 4 months between the scans, extrapolating to 12 months, the erosion will reach 1 m. However, taking the average value for all sections give a value of 0.15 m, which is comparable to the uncertainty in the scanning. This means that the conclusion on the erosion evolution can be taken only of a more robust and long time series. It can be also noticed the effects of variation in the water level, which hide part of the cliff. Also, vegetation and noise, even after careful editing, still prevents to define an accurate line defining the section.
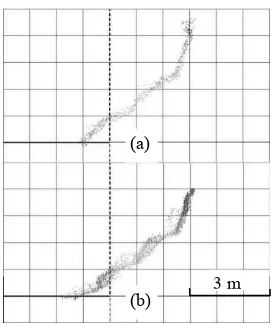
The same procedure was applied in the Rosana reservoir, for several monitoring areas. One example is presented, for the “Divisa do Parque” area (see Figure 1.c). Figure 10 depicts two cross sections acquired in June, 2013 (Fig. 10.a) and January, 2014 (Fig. 10.b). The cross sections were generated parallel with a distance of 75 m from each other. Only two cross sections were analysed and the erosion evolution was measured trough distance samples, at several elevations, as presented in Table 3.
Figure 10. Example of a cross section (P0), Divisa do Parque area, Rosana reservoir: (a) June, 2013 and; (b) January, 2014.
Height Cross Section
258 m 259 m 260 m 261 m
Average
P0 0.00 0.27 0.02 0.00 0.07
P2 0.45 0.08 0.02 0.05 0.15
Table 3. Distances in meters, between two points in corresponding cross sections, taken at different epochs at Divisa
do Parque area, Rosana reservoir. Figure 8. Overlaid contours from two epochs (Argilito area, Chavantes reservoir)
(a)
(b) 5 m
(a)
(b) 3 m
Similarly to the data presented from the Chavantes Reservoir, the data from the analysed cross sections and presented in Table 3 shows that the erosional process is slow in this area of the Rosana reservoir with a maximum value of 0.15 m in cross section P2 and the average value was 0.11 m for a time gap of 6 months. This value is comparable to the uncertainty in the scanning. The same conclusions taken previously apply even considering the differences in the reservoirs features.
5. CONCLUSIONS
The monitoring of marginal erosions in reservoirs of hydroelectric plants is the main aim of this paper and a BoMMS with Mobile Laser Scanning was integrated with commercial available components. Some results achieved with real data were also presented and analysed using commercial and in-house developed solutions. The achieved results confirm the erosional process but the magnitude is, in some cases, comparable to the measurement uncertainty. Nevertheless, it was concluded that the technique is suitable for this aim and produces reliable results. Longer time series have to be collected to show the evolution of the erosion and the differences when considering the features of each reservoir mainly the soil types.
This project will continue for more 2 years and, after this period, Duke Energy will follow its role in monitoring and mitigating the erosional processes, when feasible.
Further work is to be developed on the integration of RGB images to the point clouds, to allow more accurate editing. After that, some experiments on automatic classification and filtering will be developed.
6. REFERENCES
Alho, P.; Kukko, A.; Hyyppä, H.; Kaartinen, H.; Hyyppä, J. and Jaakkola, A., 2009. Application of Boat-based Laser Scanning for River Survey. Earth Surface Processes and Landforms, 34 (13), pp. 1831–38.
Alho, P.; Vaaja, M.; Kukko, A.; Kasvi, E.; Kurkela, M.; Hyyppa, J.; Hyyppa, H. and Kaartinen, H., 2011. Mobile Laser Scanning in Fluvial Geomorphology: Mapping and Change Detection of Point Bars. Zeitschrift Fur Geomorphologie 55 (SUPPL. 2), pp. 31–50.
Amaro, V. E.; Santos, A. L. S. ; Scudelari, A. C. ; Costa, B. C. P. 2013. Use of Terrestrial-LiDAR for quantifying morphological changes in Ponta Negra Beach, Natal City, Northeast Brazil. In: CoastGIS 2013 Conference: Monitoring and Adapting to Change on the Coast, 2013, Victoria, BC, Canada. Monitoring and Adapting to Change on the Coast, 2013.
Bitenc, M.; Lindenbergh, R.; Khoshelham, K. and Van Waarden, A.P., 2011. Evaluation of a LIDAR Land-based Mobile Mapping System for Monitoring Sandy Coasts. Remote Sensing, 3 (7), pp. 1472–91.
Bhering, S.B.; Santos, H.G. (Eds.), 2008. Mapa de solos do Estado do Paraná: legenda atualizada. Rio de Janeiro: Embrapa Florestas, Embrapa Solos, IAPAR, 74 p (in Portuguese). Hobbs, P.R.N.; Gibson, A.; Jones, L.; Pennington, C.; Jenkins, G.; Pearson, S. and Freeborough, K., 2010. Monitoring Coastal
Change Using Terrestrial LiDAR. Geological Society Special Publication, 345, pp. 117–27.
Hohenthal, J.; Alho, P.; Hyyppä, J. and Hyyppä, H., 2011. Laser Scanning Applications in Fluvial Studies. Progress in Physical Geography, 35 (6), pp. 782–809.
Leica-Cyclone, 2014. http://hds.leica-geosystems.com/en/Leica-Cyclone_6515.htm
Lim, S.; Thatcher, C.A.; Brock, J.C.; Kimbrow, D.R.; Danielson J.J. and Reynolds, B.J., 2013. Accuracy Assessment of a Mobile Terrestrial Lidar Survey at Padre Island National Seashore. International Journal of Remote Sensing, 34 (18), pp. 6355–66.
MDL, 2014. http://www.mdl-laser.com/en/the-portable-mobile-mapping-gis-data-collection-solution--18326
Mitchell, T.J. and Chang, M.N., 2011. Utilizing Vessel Based Mobile Laser and Bathymetry Survey Techniques for Survey of Four Southern California Breakwaters. In: Coastal Engineering Practice - Proceedings of the 2011 Conference on Coastal Engineering Practice, pp. 957–69.
Mitchell, T; Suarez, G; Chazaly, B., 2013. Evaluation of coastal vulnerability with Mobile Laser Scanning from a Vessel. Oceans. San Diego, CA, USA.
Mitchell, T.J.; Suarez, G. and Hogan, P., 2012. Integrated Remote Sensing of Bathymetry and Onshore Topography for Asset Inspection, Hydrology Modelling and Hazard Assessment. In: IAHS-AISH Publication, 352, pp. 239–42. Nikon, 2014 http://imaging.nikon.com/lineup/dslr/d3200/ Oliveira, J.B., 1999. Solos do Estado de São Paulo: descrição das classes registradas no mapa pedológico. Campinas, Instituto Agronômico. Boletim Científico 45, 112p (in Portuguese). Pfennigbauer, M.; Rieger P.; and Schaich M., 2011. Shipborne Hydrographic Laser Scanning. In: Proceedings of SPIE - The International Society for Optical Engineering. Vol. 8186. Poulton, C.V.L.; Lee, J.; Hobbs, P.; Jones, L. and Hall, M., 2006. Preliminary Investigation into Monitoring Coastal Erosion Using Terrestrial Laser Scanning: Case Study at Happisburgh, Norfolk. Bulletin of the Geological Society of Norfolk, pp. 45–64.
Puente, I., González-Jorge, H.; Martínez-Sánchez, J. and Arias, P., 2013. Review of Mobile Mapping and Surveying Technologies. Measurement: Journal of the International Measurement Confederation, 46 (7), pp. 2127–45.
QPS-QINSY, 2014 http://www.qps.nl/display/qinsy/laser Ross, J.L.S. and Moroz, I.C., 1997. Mapa Geomorfológico do Estado de São Paulo. São Paulo: Laboratório de Geomorfologia Depto de Geografia FFLCH-USP/Laboratório de Cartografia Geotécnica - Geologia Aplicada – IPT/FAPESP, 63p (in Portuguese).
Saarinen, N.; Vastaranta, M.; Vaaja, M.; Lotsari, E.; Jaakkola, A.; Kukko, A.; Kaartinen, H.; Holopainen, M.; Hyyppä, H. and Alho, P., 2013. Area-Based Approach for Mapping and Monitoring Riverine Vegetation Using Mobile Laser Scanning. Remote Sensing, 5(10), pp. 5285–5303.
Santos, L.J.C. et al., 2006. Mapeamento geomorfológico do Estado do Paraná. Revista Brasileira de Geomorfologia, 7(2). (in Portuguese).
Vaaja, M.; Kukko, A.; Kaartinen, H.; Kurkela, M.; Kasvi, E.; Flener, C.; Hyyppä, H.; Hyyppä, J.; Järvelä, J. and P. Alho, 2013. Data Processing and Quality Evaluation of a Boat-based Mobile Laser Scanning System. Sensors (Basel, Switzerland) 13(9), pp. 12497–12515.
Wang, Y.; Liang, X.; Flener, C.; Kukko, A.; Kaartinen, H.; Kurkela, M.; Vaaja, M.; Hyyppä, H. and P. Alho, 2013. 3D Modeling of Coarse Fluvial Sediments Based on Mobile Laser Scanning Data. Remote Sensing, 5 (9), pp. 4571–4592.
Acknowledgements
This paper presents partial results of a Research & Development project entitled "Monitoring and Control of Marginal Erosions in Hydroelectric Reservoirs" developed through a partnership between Duke Energy International, Generation Paranapanema SA and Fundunesp - Foundation for the Development of UNESP. This project is registered in the Program for Research and Technological Development of the Power Sector, coordinated by the National Electric Energy Agency - ANEEL, n. PD-0387-0311/2010.