Effects of spring precipitation on a temperate arable collembolan
community analysed using Principal Response Curves
Geoff K. Frampton
a,∗, Paul J. Van den Brink
b, Philip J.L. Gould
aaBiodiversity and Ecology Division, School of Biological Sciences, University of Southampton,
Bassett Crescent East, Southampton, Hampshire SO16 7PX, UK
bAlterra Green World Research, Department of Water and the Environment, PO Box 47, 6700 AA Wageningen, The Netherlands
Received 26 October 1999; received in revised form 3 February 2000; accepted 8 February 2000
Abstract
We hypothesized that changes in the pattern of spring precipitation would alter the species composition of a temperate soil-surface collembolan community. Experimental manipulation of precipitation during a drought in southern England was used to test this hypothesis in spring 1997. Replicated plots in a field of spring peas received spring drought (plots shielded from rainfall), reference (actual) rainfall and spring irrigation during the first 2 weeks of May. Shielding plots extended the existing drought to 58 days. Thereafter all plots received natural precipitation only, which in June considerably exceeded the long-term average for the site. Redundancy Analysis (RDA) and the recently-developed method of Principal Response Curves analysis (PRC) were used to summarise and test statistically changes in community composition under the three precipitation treatments, using counts of soil-surface species obtained by suction sampling. Irrigation decreased counts ofBourletiella hortensis, but had a positive impact on all other species studied, whilst the effect of spring drought was negative. Effects
of spring precipitation persisted for the 97-day duration of the study despite the unusually wet summer. The possibility that changes in patterns of rainfall in northern Europe would promote some species as crop pests is proposed, but not supported by our findings. We use the collembolan data to illustrate some advantages of PRC analysis over RDA and other ordination techniques for analysing community responses to experimental treatments. © 2000 Elsevier Science B.V. All rights reserved.
Keywords:Drought; Irrigation; Collembola; Community analysis; Multivariate analysis; Redundancy analysis
1. Introduction
During the last two decades, precipitation in Britain has tended to increase in winter and decrease in summer (Conway, 1998), with an increase in the frequency of droughts (Price, 1998). Other parts of Europe have also experienced a decrease in summer precipitation (Piervitali et al., 1997). Several climate
∗Corresponding author. Tel.:+44-23-8059-3112;
fax:+44-23-8059-4269.
E-mail address:[email protected] (G.K. Frampton)
change models based upon ‘business as usual’ emis-sions of greenhouse gases forecast an increase in drought intensity and frequency in south-east Eng-land (CCIRG, 1996), most of western Europe (Arnell, 1999) and some other parts of the world (e.g. Flem-ing and Candau, 1998; Kothavala, 1999). Most of the work investigating potential effects of climate change on arthropods in the UK has so far focused on changes in CO2 concentration and temperature rather than precipitation (Cannon, 1998), even though changes in patterns of rainfall are thought likely to have a greater effect on the distribution of plants and animals
than are predicted changes in temperature (CCIRG, 1996).
In Britain, long-term monitoring of biota for de-termining environmental effects of climate change is being addressed by multi-disciplinary projects such as the Environmental Change Network (Bealey et al., 1998) and component IV of the NERC Terrestrial Ini-tiative in Global Environmental Research (Cummins et al., 1995; Jamieson et al., 1998; Masters et al., 1998; Cummins and Watkinson, 1999), but these studies do not include arable farmland. Arable land occupies a large proportion (ca. 21%) of the land surface of Britain and has a diverse arthropod fauna (Potts, 1991). Collembola are numerically impor-tant in arable agroecosystems (e.g. Purvis and Curry, 1980; Röske, 1989; Kovác and Miklisova, 1997) and contribute functionally at several trophic levels to the terrestrial food web (Rusek, 1998). We hypothesized that the species composition of an arable collembolan community would change in response to alteration of precipitation in spring because: (1) collembolan sensi-tivity to humidity varies interspecifically (e.g. Davies, 1928; Joosse, 1970; Ashraf, 1971; Verhoef and Van Selm, 1983); (2) several species are tolerant to cer-tain conditions of drought (Davidson, 1932; Poinsot, 1971; Blancquaert et al., 1981; Alvarez et al., 1999); (3) fungivorous species could potentially be influ-enced indirectly by effects of precipitation on fungal populations (e.g. Schnürer et al., 1986); (4) herbivo-rous species could potentially be influenced indirectly by effects of precipitation on foodplants (e.g. Mattson and Haack, 1987); and (5) the timing of rainfall can influence the temporal dynamics of some species (e.g. Davidson, 1932). Synecological studies of collem-bolan responses to drought and irrigation have been conducted mainly in habitats with a distinct dry sea-son, e.g. in Arctic (e.g. Hodkinson et al., 1998), hot desert (e.g. Whitford, 1992) or semi-arid climates (e.g. Greenslade, 1981), but not in temperate agroecosys-tems. In this paper we describe the response of an arable soil-surface collembolan community to spring drought and irrigation in southern England in 1997.
The community response was analysed using Redundancy Analysis (RDA) and a relatively new method, Principal Response Curves (PRC) analysis. PRC analysis has advantages over traditional multi-variate ordination techniques in that differences be-tween treatments in community composition can be
more clearly visualized than in a conventional ordina-tion diagram whilst retaining interpretaordina-tion at the level of individual species (Van den Brink and Ter Braak, 1999). Hitherto applied only in aquatic ecotoxicology (Van den Brink and Ter Braak, 1997, 1998, 1999; Kedwards et al., 1999), PRC analysis has potential for wider application in experimental community ecol-ogy, which we illustrate with the collembolan data.
2. Materials and methods
2.1. Study site
The study was carried out in 1997 in an 8 ha field of seed peas cv. Eiffel (drilled 17 March) on a commercial farm in Hampshire, southern England (51◦7′N 1◦2′W). Previous cropping was oilseed rape (cv. Mars) in 1996 preceded by four crops of spring barley (cv. Chariot) (1992–1995). Soil type was a light loam over chalk (Andover series; pH=7.6; satu-ration capacity=72.5 g water 100 g−1oven dry soil). Soil composition was 8.4% OM, 8.9% clay, 30.3% silt, 18.3% fine sand, and 10.5% coarse sand.
2.2. Experiment design
applications sprayed at label-recommended rates on all plots and are realistic in terms of conventional farming practice.
2.3. Precipitation treatments
Three precipitation treatments were assigned to the 12 experimental plots. Plots were arranged in four blocks, with one replicate of each treatment allocated randomly within each block. The treatments were:
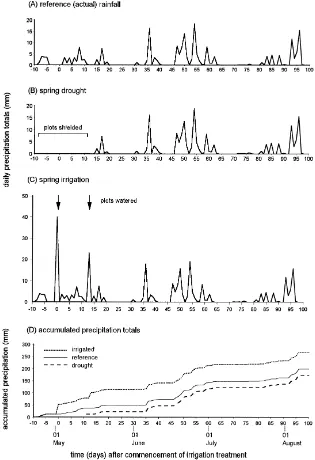
(1) Reference (actual) rainfall: The plots received only natural precipitation during the study. Monthly rainfall totals during the study were all below the 20-year site average except during June, when twice the long-term monthly average rainfall fell (Frampton et al., 2000).
(2) Spring drought: Plots were manually shielded from rainfall as necessary from 28 April until 12 May using removable polythene covers supported by ropes attached to posts located outside the plots. Thereafter the plots were left permanently uncovered to receive natural rainfall (Fig. 1). Covers were deployed only during rainfall and when in position permitted air cir-culation through the plots so as to minimise the influ-ence of plot shielding on temperature. Shielding the plots extended an existing 40-day rain-free period by a further 18 days and reduced the precipitation received by drought plots by a total of ca. 36 mm relative to the reference rainfall treatment.
(3)Spring irrigation: The plots were watered con-currently using four identical laterally-oscillating gar-den sprinklers connected in parallel to a pressurized irrigation water supply (total flow rate 14.0 l min−1) on 2 May (40.0±3.7 mm, duration ca. 1 h) and on 15 May (22.9±3.5 mm, duration ca. 40 min). On both occasions irrigation took place between 18:00 and 20:00 hours BST at low wind velocity (<5 km h−1).
Thereafter, spring irrigation plots received only natu-ral rainfall (Fig. 1). We restricted irrigation to periods of low wind speed to ensure that water deposition was homogeneous within experimental plots and to pre-vent spray drift across non-irrigated plots; high rates were chosen (up to 40 mm in 1 h) to enforce a distinc-tion between experimental treatments, as strong evap-oration was anticipated (Marsh, 1996).
The precipitation falling within each plot was mea-sured using a 5-inch diameter rain gauge (UK Mete-orological Office standard) sited in the centre of the
plot. Gauges were partially sunk into the soil and ad-justed periodically so that the top of each gauge was kept level with the top of the crop foliage.
The drought and irrigation treatments represent extreme cases of spring precipitation in southern England. The 58-day lack of rainfall in the drought treatment would equate to a severe drought in south-ern Britain, while the irrigation treatment could re-alistically represent heavy rainfall in May, or crop irrigation (Frampton et al., 2000).
2.4. Arthropod sampling
The work we report here focuses on the soil-surface community of Collembola. We consider this to be an ecologically important cohort of the arable fauna, as surface-active Collembola are widely preyed upon by predatory arthropods (e.g. Sunderland, 1975; Sun-derland et al., 1986; Burn, 1992; Nyffeler et al., 1994; Hopkin, 1997). Suction sampling is an efficient method for extracting Collembola from the soil sur-face (Frampton, 1989), and was used to estimate the abundance of surface-dwelling species. It should be noted, however, that abundance of individual species at the soil surface does not necessarily reflect their overall density in the soil profile, nor the community composition at different depths, which is temporally and spatially dynamic (Hopkin, 1997). This is be-cause some species of Collembola may occupy a wider vertical distribution than others (e.g. Hågvar, 1983); soil structure may influence the penetration of species according to body size (e.g. Marinissen and Bok, 1988); and vertical migration may occur in response to microclimatic conditions (e.g. Whitford et al., 1981; Kampichler, 1990). These aspects of the sampling method are considered when interpreting the results (Section 4).
Counts of soil-surface Collembola were ob-tained using a ‘Ryobi’ petrol-driven suction sampler (MacLeod et al., 1994) on 10 occasions, from 1 May to mid-August (−2 to +98 days relative to com-mencement of the irrigation treatment). The sampler nozzle contained a muslin net with a small mesh (<100mm) to ensure small collembolan instars were
Fig. 1. Precipitation received by the experimental treatments.
the catch. Five samples (each 0.052 m2) were taken on each sampling occasion and samples were trans-ferred in situ to vials containing 70% methyl alcohol as a preservative. The spatial order of sampling was chosen randomly on each date. To overcome the possibility that understorey vegetation would affect
short-lived as the foliage usually regained its original distribution within 1 week of sampling. Samples were taken only when the soil surface was dry. On each occasion, sampling of all plots was completed within 3.5 h. Arthropods were subsequently separated from plant material and soil by sieving, then Collembola were examined microscopically and, where possible, identified to species (Fjellberg, 1980; Christiansen and Bellinger, 1998) These keys cover Nearctic and Norwegian faunas, respectively, but include species of wider holarctic distribution; other keys to European Collembola which include British species are now considered to be out of date (Rusek, 1995). For each taxon, counts of all instars except eggs were pooled to give an estimate of overall abundance at the soil surface.
2.5. Vegetation and abiotic variables
Apart from rainfall totals in each plot, which were recorded daily, for practical reasons it was not pos-sible to sample all crop and abiotic variables on the same dates as arthropods. Random samples of 20 pea plants per plot were used to determine crop growth stage on six dates and mean crop height on seven dates. Vegetation ground cover was estimated using five randomly-placed 50 cm×50 cm quadrats per plot on each of nine dates. Mean surface soil moisture con-tent was obtained on 12 dates from the mean of two randomly-placed soil samples per plot, of diameter 4 cm and depth 5 cm. Maximum and minimum screen air temperatures above the soil surface were obtained using calibrated thermometers placed 1 cm above the soil under inverted white plastic tubs (14 cm×17 cm, height 8 cm; sides perforated to permit air circulation).
2.6. Statistical analysis
A graphical representation of the temporal response of the collembolan community to the experimental treatments was obtained using the multivariate ordina-tion method RDA. This is the constrained form of PCA (Jongman et al., 1995), meaning that it restricts the ordination to that part of the total variance explained by specified variables. The analysis was based on a method proposed by Van den Brink et al. (1996) for analysing community responses to stress. All levels of
the nominal factors experimental treatment and sam-pling date were introduced as dummy variables (sensu Ter Braak and Šmilauer, 1998) into the RDA to per-mit the analysis to focus on the variance attributed to time, treatment, and their interaction. Species counts, x, were transformed to ln(x+1) prior to analysis to nor-malize the data (Jongman et al., 1995) and analysed with the software program CANOCO 4 (Ter Braak and Šmilauer, 1998).
Vegetation parameters and abiotic variables were not recorded on the same dates as arthropods were sampled, so they could not be included in the anal-ysis directly as explanatory variables. These factors were instead included as supplementary (passive) vari-ables in the RDA to permit their relationship with the experimental treatments and species responses to be displayed in an ordination diagram; passive variables do not influence the ordination itself but are a means of obtaining an alternative interpretation of already extracted ordination axes (Ter Braak and Šmilauer, 1998).
statistical model for the abundance data
Yd(j )t k=Y0t k+bkcdt+εd(j )t k (1)
whereYd(j )t k is the abundance of specieskin repli-cate plotjof treatmentd at timet,Y0t k is the mean abundance of specieskin week tin the control (ref-erence rainfall,d0),cdtis a basic response pattern for every treatmentdand sampling datet,bkis the weight of each species with this basic response pattern and
εd(j )t k is an error term with mean zero and variance ók2. By definition,c0t=0 for everyt. The least-squares estimates of the coefficientscdtmay be obtained from partial RDA (also known as reduced-rank regression with concomitant regressors) (Davis and Tso, 1982; Ter Braak and Looman, 1994). When the coefficients cdt are plotted against sampling datet, the resulting PRC diagram displays a curve for each treatment that can be interpreted as the principal response of the com-munity (Van den Brink and Ter Braak, 1997, 1998, 1999).
The species weight bk indicates the affinity each individual taxon has with the overall community re-sponse as displayed in the PRC diagram. Species weights can be interpreted quantitatively to give the relative abundance under drought or irrigation treat-ments compared to the control (reference rainfall):
exp(bk·cdt) (2)
gives the fitted difference in abundance of speciesk under treatment d at time t relative to the control (reference rainfall) treatment (d0). Where a PRC di-agram displays a large proportion of the variation in the data set, the fitted relative abundance of individ-ual taxa inferred from the diagram may closely match the observed relative abundance (Ter Braak and Šmi-lauer, 1998). Estimates ofcdt and bk were obtained for the Collembola data using the software program CANOCO 4 (Ter Braak and Šmilauer, 1998). The val-ues ofcdt were used to plot a PRC diagram to show the overall collembolan community response to the drought and irrigation treatments relative to the ref-erence (actual) rainfall treatment. In Section 3.2 we illustrate the calculation of fitted relative abundance for the individual collembolan species data using the species weightsbk.
The significance of the PRC diagram was tested using Monte Carlo permutation tests, by permuting
whole time series in the partial RDA from which the PRC was obtained using an F-type statistic based on the eigenvalue of the component (Ter Braak and Šmilauer, 1998). The null hypothesis was that the PRC diagram does not display the treatment variance (i.e. Tdt k=0 for all t, d and k). A second series of permutation tests was performed for each sampling date in which drought and irrigation treatments were tested against the reference to determine whether the differences indicated by the PRC diagram are statisti-cally significant. In each case the null hypothesis was that the principal response under drought or irrigation did not differ from the reference response.
3. Results
3.1. Vegetation and abiotic variables
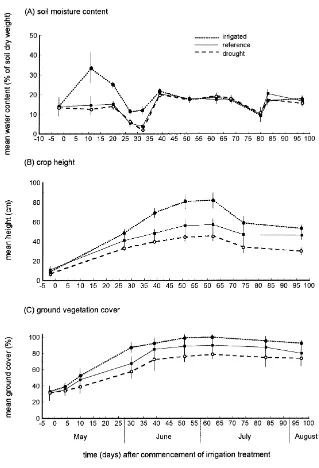
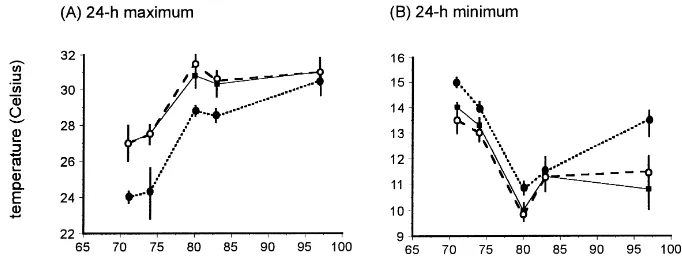
The experimental treatments applied in May had a short-term effect on soil moisture, which was higher in irrigated plots up to 33 days after plots were first watered but subsequently did not differ between ments (Fig. 2A). Long-term differences between treat-ments in crop height (Fig. 2B) and ground vegetation cover (Fig. 2C) persisted to the end of the study; both were consistently lowest under spring drought and highest under spring irrigation. Relatively few records of air temperature at the soil surface are available but they show that 71—97 days after the commencement of irrigation, daily maxima were up to 3◦C lower un-der the irrigated treatment than unun-der drought or ref-erence rainfall whereas daily minima were slightly higher (Fig. 3). Diel temperature range at the soil sur-face was thus smaller in the irrigated plots than under the other treatments.
3.2. Collembola
Fig. 2. Influence of the experimental treatments on soil moisture and vegetation. Bars show mean±S.D.
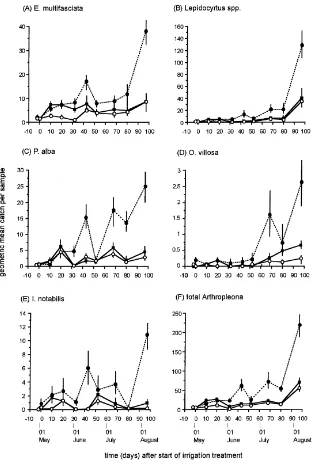
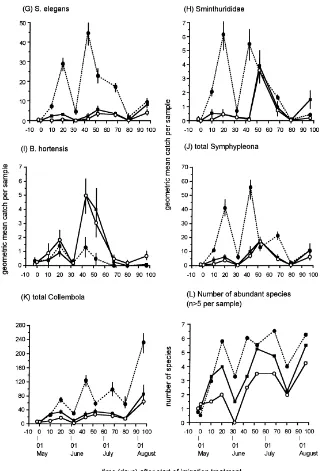
Bourlet, Isotomurus spp., Deuterosminthurus spp., Sminthurus viridis (L.), S. aureus (Lubbock) and Sminthurididae. Counts of all species were initially low and subsequently increased (Fig. 4): Peak catches of Arthropleona were in August (Fig. 4A–F) whereas Symphypleona exhibited peak abundance from May
Fig. 3. Mean (n=3) screen air temperature(◦C) recorded 1 cm above the soil surface in field peas subjected to reference rainfall (–j–),
spring drought (–s–) and irrigation (--d--.) Bars show range of readings.
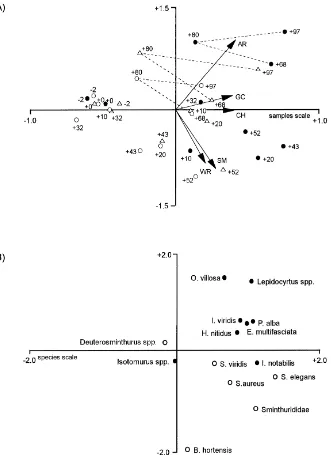
RDA scores for samples and species were plotted separately for clarity (Fig. 5A and B). The analysis is restricted to that part of the total variance (67%) which is explained by treatment and sampling date, plus their interaction. Of this variance, 80% is displayed in the ordination diagram, 62% being explained by the first axis and 18% by the second axis. Several patterns are evident in the RDA ordination diagram (Fig. 5): (1) Samples taken early in the study lie mainly in the left half of the diagram, but a shift in the position of sam-ple points towards the top right quadrant is discernible as time progressed (i.e. the time trajectory of samples is not linear in the diagram). Because most species are placed on the right hand side of the diagram, this shift indicates a general increase in abundance with time. (2) Differences between treatments in species compo-sition generally increased over time, as indicated by the separation of time-trajectories (dashed lines in Fig. 5A) towards the end of the study. (3) The position of the sample points later in the study (Day+68 on-wards) correlates closely with the vector of accumu-lated rainfall in the diagram. (4) Species points were either close to the origin, indicating little influence of the treatments on collembolan counts, or mirrored the distribution of sample scores for the irrigated treat-ment, indicating a positive influence of irrigation on abundance; the opposite pattern (indicating a negative effect of irrigation on abundance) was evident only forB. hortensis(Fig. 5B). (5) Except near the origin, species points for Arthropleona and Symphypleona (Fig. 5B) form discrete groups in the ordination
dia-gram. This reflects differences in the timing of peak counts (Symphypleona earlier than Arthropleona).
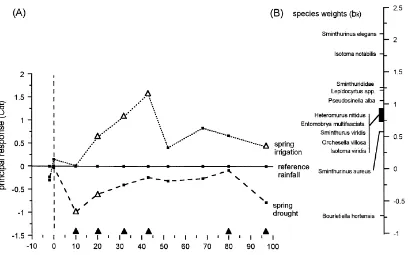
The ordination diagram shows which species and variables contributed most to the effects of treatment, time and their interaction, but the temporal change in treatment effects for the whole collembolan commu-nity is difficult to follow (Fig. 5). Changes in treatment effects through time are more clearly shown in the PRC diagram (Fig. 6A). Sampling date accounted for 43% of the total variance of the data set and treatment 24%, with a significant proportion (65%) of the treat-ment effects variance being displayed in the PRC dia-gram (p<0.005). The PRC diagram shows that species
composition was initially similar but changed when the treatments were applied (Fig. 6). Differences rela-tive to the reference treatment were consistent in direc-tion throughout the season (values ofcdt for drought and irrigation are not randomly placed around the ref-erence), and were still evident at the last sampling date (Day 97). Results of permutation tests show that the largest effects of drought and irrigation relative to the reference, and the largest differences between drought and irrigation, were statistically significant (Fig. 6). Effects of drought as displayed in the PRC diagram are smaller and less persistent than those of irrigation, consistent with differences in the amount of precipi-tation each treatment received (Fig. 1D).
Fig. 4. Geometric mean (±95% C.I.) abundance (A–K) and species richness (L) of Collembola under reference rainfall (–j–), drought
(–s–) and irrigation (--d--) treatments. Note different abundance scales.
43 (from Fig. 6 and Eq. (2)) is exp(1.56×2.1)=26.5 times the abundance under reference rainfall. For B. hortensis the fitted relative difference in abundance between reference and irrigated plots at Day 43 is exp(1.56×−0.74)=0.32. The PRC analysis thus
Fig. 4 (Continued).
4. Discussion
4.1. Experimental design
Our study was carried out during prevailing drought conditions in spring 1997 so that precipitation could
Fig. 5. RDA ordination diagrams. (A) Sample scores for reference rainfall (△), spring drought (s) and spring irrigation (d); numbers
indicate days relative to start of irrigation treatment. Dashed lines show time-trajectories of treatments from Days+68 to+97. Arrows show the supplementary variables: accumulated rainfall (AR), crop height (CH), ground cover (GC), soil moisture (SM) and rainfall in the week (7 days) preceding sampling (WR). Scale for supplementary variables=2.0×samples scale. (B) Species scores for orders Arthropleona (d) and Svmphypleona (s).
effects of drought and irrigation against the reference rainfall treatment could thus underestimate the impact of drought, and exaggerate that of irrigation relative to conditions which would be more ‘typical’ of spring
collem-Fig. 6. (A) Principal Response Curves (PRC) diagram showing the response over time of a collembolan community to manipulated spring rainfall treatments. (B) Species weights indicating the relative contribution of individual species to the community response displayed in the PRC diagram. Triangles denote significant differences (p<0.05) relative to the reference treatment (△) or between drought and irrigation treatments (m).
bolan abundance which could result from year-to-year changes in spring precipitation.
The focus here is on the community-level response of Collembola to the precipitation treatments, but the experimental design would also have been appropriate for investigating individual species’ responses using univariate analysis of variance (ANOVA). A repeated measures model would be applicable as each plot was sampled repeatedly during the season, but an underly-ing assumption is that there is no interaction between time (i.e. sampling date) and other variables such as treatment or block (Underwood, 1997). If this assump-tion is invalid, the ANOVA cannot test for differences among treatments. Instead, separate tests for treatment effects within sampling date are recommended (Un-derwood, 1997), with appropriate adjustment of the F-ratios to reduce the probability of Type I errors asso-ciated with multiple tests (e.g. Sokal and Rohlf, 1995). The overall number of tests will, however, depend not
only on the number of sampling dates but also on the number of response variables (i.e. species) to be tested. Where there are many species (e.g. 189 in Van den Brink and Ter Braak, 1999), multiple testing with univariate methods is clearly not a practical option. Multivariate ANOVA offers a possible alternative but requires a higher sampling effort and is limited in the number of response variables that can be analysed (e.g. Hair et al., 1995). RDA and PRC, which are not sub-ject to these restrictions, can usefully identify species whose responses warrant a more detailed (e.g. uni-variate) analysis without the need for multiple testing. Thus, the atypical response ofB. hortensisto the irri-gation treatment in mid-June indicated by PRC analy-sis may be tested ad hoc, e.g. with a two-way ANOVA (treatment fixed, block random); the effect of irrigation in mid-June is significant (F1,32>13;p<0.01), with no
4.2. Sampling considerations
Suction sampling was carried out when the soil sur-face was dry to touch but in fact soil moisture to a depth of 5 cm differed between precipitation treat-ments up to Day 33 (Fig. 2). No consistent differences were evident between the treatments in the dry weight of soil in suction samples (G.K. Frampton, unpub-lished data), suggesting that sampling efficiency was not affected by the differences in soil moisture. Sam-ples could not be taken when the soil surface was wet, but this is unlikely to have biased the results strongly because surface soil dried quickly following rainfall events, meaning that dry soil surface conditions pre-dominated during the study (soil moisture content in the top 5 cm was mostly≤20%; Fig. 2A).
4.3. Advantages and limitations of Principal Response Curves
The RDA ordination (Fig. 5) graphically summa-rizes a complex data set but is difficult to interpret in terms of the persistence of treatment effects. PRC anal-ysis on the other hand provides a concise summary of the temporal dynamics of the treatment effects which, in combination with permutation tests (Fig. 6), clearly shows that effects of the spring treatments persisted through the season, despite the wet summer conditions in June. Because 30 separate permutation tests were performed, each with a Type I error rate of 5%, two of the significant treatment effects displayed in the PRC diagram might be explained by chance. This does not substantially affect our interpretation of the PRC diagram, however, as we make no attempt to draw in-ferences from the outcome of individual permutation tests. In studies where the results of individual tests are of interest, the Type I error rate may be reduced by adjusting the significance level at which each test re-jects the null hypothesis (e.g. Sokal and Rohlf, 1995). The response curve for the reference treatment in a PRC diagram coincides with the horizontal axis of the diagram, meaning that the number of curves displayed is one fewer than the number of treatment levels. This contributes to the clarity of the diagram. At least five treatment levels (including reference) can be displayed in a PRC diagram without loss of visual clarity (Van den Brink and Ter Braak, 1999; Van den Brink et al., 2000). Though PRC analysis
has been applied so far only in aquatic ecotoxicology, our analysis of the collembolan community illustrates the potential of this technique for wider application in experimental community ecology. PRC analysis is applicable to any investigation of temporal changes in species composition in response to two or more ex-perimental treatments, but for statistical interpretation of treatment effects within dates the treatments must be replicated adequately for permutation testing. PRC analysis also has potential as a tool in long-term eco-logical monitoring where replication of experimental treatments is not feasible, provided that care is taken to avoid pseudoreplication (Frampton, 2000a).
The PRC diagram enables the start and end (i.e. recovery) points of a community response to exper-imental treatments to be determined, which may not be possible using other analytical approaches (see for example, the complexity of Figs. 4 and 5). We could define recovery as the point in time after whichcdt (the size of the treatment effect) consistently remains below a nominated deviation from the reference treat-ment. Such a deviation could be chosen arbitrarily yet still have value for comparative purposes if applied consistently to different data sets. Another possible yardstick for determining the start of community re-covery using PRC analysis is the point in time at which differences of cdt from the reference treat-ment cease to be statistically significant (e.g. Van den Brink and Ter Braak, 1999). Lack of synecological information on Collembola in arable habitats makes it difficult to determine the ecological importance of treatment effects, so setting a precise threshold value ofcdt against which to judge start and end points of effects is not particularly meaningful for our data. The PRC diagram does however suggest that the irrigated community had not fully recovered by the last day of the study whereas effects of drought were less persis-tent; persistent differences between the drought and irrigation treatments are also evident. Using values ofcdt against which to judge community recovery is most likely to have value in studies with other biota where the wider ecological implications of treatment effects are more tangible, e.g. where a numerical re-lationship between macroarthropod abundance and the survival rates of insectivorous wildlife has been established.
species or taxa (whose abundance may be indicative of particular environmental variables or experimental treatments). They suggested that indicator species could be defined as those which explained more than 30% of the variance on a given canonical axis (the highest proportion of the treatment effects variance explained by a species in our study was 26.3% for S. elegans). In PRC analysis the species weights bk may be used for this purpose: species with the high-est weight (in our case, S. elegans) are most likely to follow the overall community response. We have excluded from the PRC diagram those species with low weights (values ofbk in the range−0.5 to+0.5) as they have a low affinity with the overall commu-nity response, meaning that their response is either weak (e.g. due to low abundance), or unrelated to that indicated in the PRC diagram (Van den Brink and Ter Braak, 1999). Numerically important species could in theory have low species weight if their re-sponse pattern is unrelated to that shown in the PRC diagram but such a situation can be identified easily by checking the counts of taxa with low weights. In our case, taxa excluded on the basis of low weights were all rare in samples.
4.4. Collembolan responses to precipitation
With the exception of B. hortensis, collembolan abundance was increased by irrigation and decreased by drought, and a similar response pattern occurred among macroarthropods (e.g. Araneae, Coleoptera, Hemiptera, Diptera, Hymenoptera) (Frampton et al., 2000). It is not possible from our data to determine causal mechanisms, but two general points emerge from the data which may be instructive in terms of ecological processes. The first point is that the species which increased markedly in abundance soon after dry plots were irrigated all belong to the order Symphypleona. Species of Symphypleona are known to exhibit synchronised hatching when rainfall fol-lows drought (e.g. Davidson, 1932; Wallace, 1967) and it is notable that watering of arable soils in a recent laboratory study led to synchronised hatching only of Symphypleona, not Arthropleona (Alvarez et al., 1999). Symphypleona exhibited a stronger rela-tionship with soil moisture than with crop height or ground cover (cf Figs. 2, 4, 5) which would be con-sistent with several possible effects of soil moisture,
e.g. stimulation of hatching, the activation of anhy-drobiotic nymphs, or vertical migration in response to favourable moisture conditions at the soil surface (e.g. Whitford et al., 1981; Kampichler, 1990). Soil moisture could also have acted indirectly via effects on soil fungi (e.g. Schnürer et al., 1986), which are important in the collembolan diet (e.g. Hopkin, 1997). The reason why B. hortensis responded differently to all other taxa is not known; further work would be needed to establish whether the adverse effect of irrigation on this species is a general phenomenon in other arable crops. The second general point emerg-ing from our results is that treatment effects among some taxa, particularly of Arthropleona, persisted through the summer despite the relatively short-term manipulation of precipitation in May and the fact that June was exceptionally wet. Such persistence of ef-fects could reflect indirect efef-fects of the precipitation treatments upon vegetation (references in Frampton et al., 2000). The potential complexity of interactions is illustrated by the fact that spring precipitation af-fected vegetation growth which in turn influenced the diel temperature range at the soil surface up to 97 days after the initial treatment manipulation. Differ-ences in temperature between the treatments would in turn probably have affected collembolan growth, if not also survival (e.g. Hopkin, 1997).
It was not possible to reliably measure the humid-ity to which Collembola were exposed in our study. However, three of the species captured are known to differ in their susceptibility to low humidity (Davies, 1928). These are I. viridis (most susceptible), E. multifasciataand S. viridis(least susceptible). Their susceptibility to the precipitation treatments would be expected to differ if humidity was a limiting factor. The distribution of species scores in the RDA ordi-nation does suggest that I. viridiswas more closely associated thanS. viridiswith the irrigation treatment but does not identify the causal mechanism. Despite their sensitivity to low humidity, both these species can tolerate some types of drought (see below).
arthro-pods such asStenusspp. (Staphylinidae),Leistusspp. and Notiophilus spp. (Carabidae) are stenophagous predators of Collembola. Many polyphagous arthro-pods also have a collembolan diet (e.g. Sunderland, 1975; Sunderland et al., 1986; Burn, 1992; Nyffeler et al., 1994; Hopkin, 1997) so effects of the precipi-tation treatments on some predators (Frampton et al., 2000) could reflect a response to collembolan abun-dance. The importance of predation for determining effects of the precipitation treatments at the commu-nity level is difficult to establish from our data but could be investigated in future manipulative studies of precipitation effects by measuring removal of prey baits (e.g. Burn, 1992).
4.5. Drought tolerance and pest status
Of the species we trapped, three are known to ex-hibit summer drought tolerance in drier (e.g. Mediter-ranean) climates:I. viridis(Poinsot, 1971),S. aureus (Blancquaert et al., 1981) and S. viridis (Davidson, 1932). Recent work has also shown thatB. hortensis, S. elegans and S. viridis survived simulated spring drought in southern England (Alvarez et al., 1999). Collembola are not serious pests of field crops in northern Europe but several of the species we trapped (e.g.S. viridisandB. hortensis) can cause significant crop damage in drier climates (Ireson, 1993; Bishop et al., 1998), as outbreaks may be triggered by syn-chronised hatching when rainfall follows drought (e.g. Wallace, 1967). Manipulation of precipitation under laboratory conditions has recently provided evidence that rainfall-induced synchronised hatching of these species would also occur in arable soils of northern Europe following certain conditions of spring drought (Alvarez et al., 1999). This raises the question of whether an increase in the frequency or severity of droughts would promote these species as pests in northern Europe. In our study the drought and ref-erence treatments both effectively represent different degrees of drought in early May (Section 4.1), termi-nated by rainfall in late May and June (Fig. 1). Counts ofB. hortensisunder these treatments were generally low until Day+43, when an increase followed the first substantial rainfall event of the summer (cf Figs. 1 and 4). However, even at peak abundance, counts of B. hortensiswere generally low and our data provide no evidence that any other species were favoured by the
drought treatment at any time in the season. Although irrigation increased the abundance of most species, no Collembola appeared to pose any threat to the pea crop following any of our manipulations of precipita-tion, as very few were found on the pea plants after flowering.
4.6. Implications and recommendations
5. Conclusions
In a temperate spring-sown arable crop, spring rain-fall and irrigation are important determinants of the abundance of Collembola at the soil surface through-out the crop season. Substantial differences in summer collembolan abundance would be expected between years with high and low spring rainfall, but the impli-cations for predators of Collembola requires further investigation, particularly as some are important in the diet of declining farmland birds. PRC analysis proved to be capable of concisely summarising the complex data set of the collembolan community whilst permit-ting information to be diplayed which could not have been readily obtained from a traditional ordination di-agram. The technique is directly relevant to commu-nity ecology and the visual clarity of PRC diagrams makes them a potentially valuable tool for presenting complex ecological information to non-experts.
Acknowledgements
We thank Ben Gibbons for allowing us to conduct this work in a commercial crop on the Leckford Es-tate, Tom Palmer for providing long-term meteorolog-ical records for the study site, and Dave Baddams and Nick Smith for their help with organising fieldwork equipment. We also thank Davy McCracken and an anonymous referee for their valuable comments which helped us improve an earlier version of the manuscript.
References
Alvarez, T., Frampton, G.K., Goulson, D., 1999. The effects of drought upon epigeal Collembola from arable soils. Agric. For. Entomol. 1, 243–248.
Arnell, N.W., 1999. The effect of climate change on hydrological regimes in Europe: a continental perspective. Global Environ. Change 9, 5–23.
Ashraf, M., 1971. Influence of environmental factors on Collembola. Rev. Écol. Biol. Sol. 8, 243–252.
Bealey, C., Howells, O., Parr, T., 1998. Environmental change and its effects on wildlife: the role of the environmental change network. Br. Wildlife 9, 341–347.
Bishop, A.L., McKenzie, H.J., Barchia, I.M., Spohr, L.J., 1998. Efficacy of insecticides against the lucerne flea Sminthurus viridis(L.) (Collembola: Sminthuridae) and other arthropods in
lucerne. Aust. J. Entomol. 37, 40–48.B.
Blancquaert, J-P., Coessens, R., Mertens, J., 1981. Life history of some Symphypleona (Collembola) under experimental conditions. 1. Embryonal development and diapause. Rev. Écol. Biol. Sol. 18, 115–126.
Burn, A.J., 1992. Interactions between cereal pests and their predators and parasites. In: Greig-Smith, P.W., Frampton, G.K., Hardy, A.R. (Eds), Pesticides, Cereal Farming and the Environment. HMSO, London, pp. 110–131.
Cannon, R.J.C., 1998. The implications of predicted climate change for insect pests in the UK, with emphasis on non-indigenous species. Global Change Biol. 4, 785–796.
CCIRG (Climate Change Impacts Review Group), 1996. Review of the potential effects of climate change in the United Kingdom. 2nd Report, HMSO, London, 247 pp.
Christiansen, K., Bellinger, P.F., 1998. Collembola of North America North of the Rio Grande, Part 2. Grinnell College, Iowa, 1518 pp.
Conway, D., 1998. Recent climate variability and future climate change scenarios for Great Britain. Prog. Phys. Geogr. 22, 350– 374.
Cummins, C.P., Watkinson, A.R., 1999. Global environmental research: the TIGER Programme. Func. Ecol. 13 (Suppl. 1), 1–2.
Cummins, C.P., Berant, M.A., Bell, B.G., Oliver, H.R., 1995. The TIGER programme. J. Biogeogr. 22, 897–905.
Davidson, J., 1932. On the viability of the eggs ofSminthurus viridisL. (Collembola) in relation to their environment. Aust.
J. Exp. Biol. Med. Sci. 10, 65–88.
Davies, W.M., 1928. The effect of variation in relative humidity on certain species of Collembola. Br. J. Exp. Biol. 6, 79–86. Davis, P.T., Tso, M.K-S., 1982. Procedures for reduced-rank
regression. Appl. Stat. 31, 244–255.
Fjellberg, A., 1980. Identification keys to Norwegian Collembola. Norsk Entomologisk Forening, Ås-NLH, 158 pp.
Fleming, R.A., Candau, J-N., 1998. Influences of climatic change on some ecological processes of an insect outbreak system in Canada’s boreal forests and the implications for biodiversity. Environ. Monit. Assess. 49, 235–249.
Frampton, G.K., 1989. Effects of some commonly-used foliar fungicides on springtails (Collembola) in winter cereals. Ph.D. Thesis, University of Southampton.
Frampton, G.K., 1999. Spatial variation in non-target effects of the insecticides chlorpyrifos, cypermethrin and pirimicarb on Collembola in winter wheat. Pestic. Sci. 55, 875–886. Frampton, G.K., 2000a. Large-scale monitoring of non-target
pesticide effects on farmland arthropods in England. In: Johnston, J.J. (Ed.), Pesticides and Wildlife. ACS Symposium Series, American Chemical Society, Washington DC, in press. Frampton, G.K., 2000b. SCARAB: effects of pesticides on arthropods. In: Young, J.E.B., Alford, D.V., Ogilvy, S.E. (Eds.), Reducing Agrochemical Use on the Arable Farm. MAFF, in press.
Frampton, G.K., Van den Brink, P.J., Gould, P.J.L., 2000. Effects of spring drought and irrigation on farmland arthropods in southern Britain. J. Appl. Ecol., in press.
Hågvar, S., 1983. Collembola in Norwegian coniferous forest soils. II. Vertical distribution. Pedobiologia 25, 383–401.
Hair, J.F., Anderson, R.E., Tatham, R.L., Black, W.C., 1995. Multivariate Data Analysis with Readings, 4th Edition. Prentice-Hall, Englewood Cliffs, NJ, 758 pp.
Hodkinson, I.D., Webb, N.R., Bale, J.S., Block, W., Coulson, S.J., Strathdee, A.T., 1998. Global change and Arctic ecosystems: conclusions and predictions from experiments with terrestrial invertebrates on Spitsbergen. Arct. Alp. Res. 30, 306–313. Hopkin, S.P., 1997. Biology of the Springtails. Oxford University
Press, Oxford, 330 pp.
Ireson, J.E., 1993. Activity and pest status of surface-active Collembola in Tasmanian field crops and pastures. J. Aust. Entomol. Soc. 32, 155–167.
Jamieson, N., Barraclough, D., Unkovich, M., Monaghan, R., 1998. Soil N dynamics in a natural calcareous grassland under a changing climate. Biol. Fertil. Soils 27, 267–273.
Jongman, R.H.G., Ter Braak, C.J.F., van Tongeren, O.F.R. (Eds.), 1995. Data Analysis in Community and Landscape Ecology. Cambridge University Press, Cambridge, 299 pp.
Joosse, E.N.G., 1970. The formation and biological significance of aggregations in the distribution of Collembola. Neth. J. Zool. 20, 299–314.
Kampichler, C., 1990. Community structure and vertical distribution of Collembola and Cryptostigmata in a dry-turf cushion plant. Biol. Fertil. Soils 9, 130–134.
Kedwards, T.J., Maund, S.J., Chapman, P.F., 1999. Community level analysis of ecotoxicological field studies. II. Replicated-design studies. Environ. Toxicol. Chem. 18, 158– 166.
Kothavala, Z., 1999. The duration and severity of drought over eastern Australia simulated by a coupled ocean-atmosphere GCM with a transient increase in CO2. Environ. Modelling
Software 14, 243–252.
Kovác, L., Miklisova, D., 1997. Collembolan communities (Hexapoda, Collembola) in arable soils of East Slovakia. Pedobiologia 41, 62–68.
MacLeod, A., Wratten, S.D., Harwood, R.W.J., 1994. The efficiency of a new lightweight suction sampler for sampling aphids and their predators in arable land. Ann. Appl. Biol. 124, 11–17.
Marinissen, J.C.Y., Bok, J., 1988. Earthworm-amended soil structure: its influence on collembolan populations in grassland. Pedobiologia 32, 243–252.
Marsh, T.J., 1996. The 1995 UK drought — a signal of climatic instability? Proc. Inst. Civ. Eng. Water, Maritime Energy 118, 189–195.
Masters, G.J., Brown, V.K., Clarke, I.P., Whittaker, J.B., Hollier, J.A., 1998. Direct and indirect effects of climate change on insect herbivores: Auchenorrhyncha (Homoptera). Ecol. Ent. 23, 45–52.
Mattson, W.J., Haack. R.A., 1987. The role of drought stress in provoking outbreaks of phytophagous insects. In: Barbosa, P., Schultz, J.C. (Eds), Insect Outbreaks. Academic Press, San Diego, California, pp. 365–407.
Nyffeler, M., Sterling, W.L., Dean, D.A., 1994. How spiders make a living. Environ. Entomol. 23, 1357–1367.
Piervitali, E., Colacino, M., Conte, M., 1997. Signals of climatic change in the central-western Mediterranean Basin. Theor. Appl. Climatol. 58, 211–219.
Poinsot, N., 1971. Ethologie de quelques espèces de collemboles isotomides de Provence. Annales de l’Universite de Provence Sciences 45, 33–53.
Potts, G.R., 1991. The environmental and ecological importance of cereal fields. In: Firbank, L.G., Carter, N., Darbyshire, J.F., Potts, G.R. (Eds.), The Ecology of Temperate Cereal Fields. Blackwell Scientific Publications, Oxford, pp. 3–21. Price, M., 1998. Water storage and climate change in Great Britain
— the role of groundwater. Proc. Inst. Civ. Eng. Water, Maritime and Energy 130, 42–50.
Purvis, G., Curry, J.P., 1980. Successional changes in the arthropod fauna of a new ley pasture established on previously cultivated arable land. J. Appl. Ecol. 17, 309–321.
Röske, H., 1989. Collembola fauna on different types of agriculturally used soil. In: Dallai, R. (Ed.), Third International Seminar on Apterygota. University of Siena, Italy, pp. 283– 290.
Rusek, J., 1995. Synecology of Collembola. Polskie Pismo Entomologiczne 64, 69–75.
Rusek, J., 1998. Biodiversity of Collembola and their functional role in the ecosystem. Biodiv. Conserv. 7, 1207–1219. Schnürer, J., Clarholm, M., Rosswall, T., 1986. Effects of moisture
on soil microorganisms and nematodes: a field experiment. Microbial Ecol. 12, 217–230.
Shaddy, H., Butcher, J.W., 1977. The distribution of some soil arthropods in a manipulated ecosystem. The Great Lakes Entomologist 10, 131–144.
Siepel, H., Meijer, J., Mabelis, A.A., den Boer, N.H., 1989. A tool to assess the influence of management practices on grassland surface macrofaunas. J. Appl. Entomol. 108, 271–290. Sokal, R.R., Rohlf, F.J., 1995. Biometry, 3rd Edition. W.H.
Freeman, New York, 887 pp.
Sunderland, K.D., 1975. The diet of some predatory arthropods in cereal crops. J. Appl. Ecol. 12, 507–515.
Sunderland, K.D., Fraser, A.M., Dixon, A.F.G., 1986. Distribution of linyphiid spiders in relation to capture of prey in cereal fields. Pedobiologia 29, 367–375.
Ter Braak, C.J.F., Looman, C.W.N., 1994. Biplots in reduced-rank regression. Biom. J. 36, 983–1003.
Ter Braak, C.J.F., Šmilauer, P., 1998. CANOCO 4. Microcomputer Power, Ithaca, New York, 351 pp.
Underwood, A.J., 1997. Experiments in Ecology. Cambridge University Press, Cambridge, 504 pp.
Van den Brink, P.J., Ter Braak, C.J.F., 1997. Ordination of responses to toxic stress in experimental ecosystems. Toxicol. Ecotoxicol. News 4, 173–177.
Van den Brink, P.J., Ter Braak, C.J.F., 1998. Multivariate analysis of stress in experimental ecosystems by Principal Response Curves and similarity analysis. Aq. Ecol. 32, 163–178. Van den Brink, P.J., Ter Braak, C.J.F., 1999. Principal response
Van den Brink, P.J., Van Wijngaarden, R.P.A., Lucassen, W.G.H., Brock, T.C.M., Leeuwangh, P., 1996. Effects of the insecticide Dursban® 4E (a.i. chlorpyrifos) in outdoor experimental ditches. II. Invertebrate community responses. Environ. Toxicol. Chem. 15, 1143–1153.
Van den Brink, P.J., Hattink, J., Bransen, F., Van Donk, E., Brock, T.C.M., 2000. Impact of the fungicide carbendazim in freshwater microcosms. II. Zooplankton, primary producers and final conclusions. Aq. Toxicol. 48, 251–264.
Verhoef, H.A., Van Selm, A.J., 1983. Distribution and population dynamics of Collembola in relation to soil moisture. Holarctic Ecol. 6, 387–394.
Wallace, M.M.H., 1967. The ecology ofSminthurus viridis (L.)
(Collembola). I. Processes influencing numbers in pastures in western Australia. Aust. J. Zool. 15, 1173–1207.
Whitford, W.G., 1992. Effects of climate change on soil biotic communities and soil processes. In: Peters, R.L., Lovejoy, T.E. (Eds.), Global Warming and Biological Diversity. Yale University Press, New Haven, Connecticut, pp. 124–135. Whitford, W.G., Freckman, D.W., Elkins, N.Z., Parker, L.W.,