A METHOD FOR MONITORING HYDROLOGICAL CONDITIONS BENEATH
HERBACEOUS WETLANDS USING MULTI-TEMPORAL ALOS PALSAR COHERENCE
DATA
Meimei Zhang a,b, Zhen Li a,*, Bangsen Tian a, Jianmin Zhou a, Jiangyuan Zeng a,b
a
Key Laboratory of Digital Earth Science, Institute of Remote Sensing and Digital Earth, Chinese Academy of Sciences, No. 9 Dengzhuang South Road, Beijing 100094, China; E-Mail: [email protected] (Z. L.); [email protected](M. Z.);
[email protected] (B. T.) b
University of Chinese Academy of Sciences, Beijing 100049, China
Commission VI, WG VI/4
KEY WORDS: Hydrological conditions, Herbaceous wetlands, Interferometric synthetic aperture radar (InSAR), Coherence, Probability density function (PDF), Wet reeds extraction
ABSTRACT:
Reed marshes, the world’s most widespread type of wetland vegetation, are undergoing major changes as a result of climate changes and human activities. The presence or absence of water in reed marshes has a significant impact on the whole ecosystem and remains a key indicator to identify the effective area of a wetland and help estimate the degree of degeneration. Past studies have demonstrated the use of interferometric synthetic aperture radar (InSAR) to map water-level changes for flooded reeds. However, the identification of the different hydrological states of reed marshes is often poorly understood. The analysis given in this paper shows that L-band interferometric coherence is very sensitive to the water surface conditions beneath reed marshes and so can be used as classifier. A method based on a statistical analysis of the coherence distributions for wet and dry reeds using InSAR pairs was, therefore, investigated in this study. The experimental results were validated by in-situ data and showed very good agreement. This is the first time that information about the water cover under herbaceous wetlands has been derived using interferometric coherence values. This method can also effectively and easily be applied to monitor the hydrological conditions beneath other herbaceous wetlands.
* Corresponding author
1. INTRODUCTION
Wetlands are a critical link between water and the land surface, serving as the most productive and biodiverse ecosystem on Earth (Halls 1997), and reed marshes are the most widespread wetland vegetation type worldwide. The water-covered surfaces of wetlands provide important breeding sites for hundreds of thousands of waterfowl each year and are crucial parts of the migratory routes of many bird species (Karszenbaum et al. 2000); the red-crowned crane, white swan and other rare wetland species are highly dependent on this water environment. Therefore, it is important to monitor the hydrological conditions in reed marshes as this is an effective way of obtaining information about the health of the ecosystem (Bayley 1995) and thus maintain the biodiversity of wetlands. There are two factors that produce hydrological fluctuations beneath reed marshes: seasonal variations in precipitation and evaporation, and in some places, systems of water gates, canals and dikes that are used to control floods and irrigate the plants.
Satellite remote sensing data constitute a tool that can be used to obtain timely, synoptic and repetitive information at a large scale. Optical images from Landsat and MODIS have been used for vegetation and seasonal inundation monitoring in wetlands and lakes (Ordoyne and Friedl 2008; Ward et al. 2014). However, the monitoring of flooded surface conditions beneath reed marches is difficult because of the similarity of the spectral
signatures of the vegetation in different flooded states. Synthetic aperture radar (SAR) imaging systems have the capability to study the hydrological characteristics of inundated vegetation because these systems provide their own energy for penetrating the vegetation canopy and interacting with targets in the subsurface (Hess et al. 1995; Kasischke et al. 2003). Advanced SAR techniques such as the use of interferometric SAR (InSAR) fringe patterns, polarimetric indexes and objected-oriented segmentation have been applied to obtain information about water levels and to enhance the separability of different wetland types (Arnesen et al. 2013; Hong et al. 2010; Martinez and Toan 2007). In addition, inundation dynamics under a forest canopy can be studied using the differences in radar response that result from changes in the amount of emerged biomass (Voormansik et al. 2014).
Most of the studies listed in the summary above are concerned with wetland mapping and research into the hydrological fluctuations of flooded vegetation; there is little focus on distinguishing flooded from non-flooded wetland types, which is key to accessing the sustainability of wetland ecosystems. Because of the specific physics of radar backscattering for vegetation, interferometric coherence can be used to delineate the water surface area beneath herbaceous wetlands. This study therefore will analyze the statistical distributions of coherence for reed marshes in different flooded states and explore the The International Archives of the Photogrammetry, Remote Sensing and Spatial Information Sciences, Volume XL-7/W4, 2015
potential of using the probability density function (PDF) for the extraction of flooded reed marshes.
2. METHODOLOGY
2.1 Histogram Analysis for Flooded and Non-flooded Wetland Vegetation
Numerous studies have been performed using SAR datasets over wetlands and large floodplains. L-band SAR is the preferred wavelength in these studies because of its strong penetration in almost any type of forest and herbaceous marshes (Hess et al. 2007; Wdowinski 2008). In terms of polarization, HH polarization is more sensitive to structural differences and provides better flood detection results than VV polarization (Grings et al. 2006; Lu et al. 2009). Thus, we decided to use long wavelength, HH-polarized ALOS PALSAR in this study.
Using ground truth samples for flooded and non-flooded reed marshes, coherence histograms were established, as shown in Figure 1. During the study period, the two classes were relatively well separated and the threshold for coherence was set in between the two peaks in order to produce binary images containing areas of wet reeds and dry reeds. However, this scheme proved to be unstable due to the random value of the threshold that was derived from the histograms. Because of this, a new method that fully considered the statistical distributions of the coherence magnitude was developed. This method was
Figure 1. Coherence histograms for wet reeds and dry reeds formed from images acquired on May 5, 2008 and June 20,
2008.
2.2 Data Processing and Statistical Analysis of Coherence Magnitude Samples
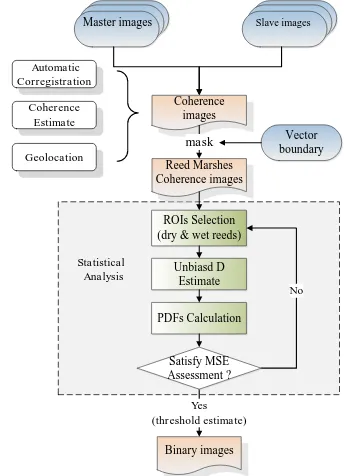
A complete flow chart showing how the areas of dry and wet reeds were extracted using the new method is depicted in Figure 2. The data processing consisted of the following steps.
Precise coregistration of all the SAR images
Estimation of the coherence magnitude after the application of an adaptive phase filter
Geocoding of the coherence magnitude images
Reed marshes mapping using vector boundary
The use of a reed mask (derived from the vector boundary of
Figure 2. Flow chart for the extraction of wet and dry reeds using the new method.
After the basic data processing, coherence magnitude images of reed marshes were obtained and regions of interest (ROIs) for each class were defined for use in the development of the statistical distributions. Because the sample coherence magnitude, d , serves as the maximum likelihood (ML) estimate of the coherence magnitude, D , we developed a statistical expression for its PDF, which, in terms of the coherence magnitude, the independent number of looks, L, and the hypergeometric function, F (Touzi and Lopes 1996), can be expressed as:
the coherence magnitude according to equation (2), an unbiased estimate can be obtained by inverting the equation as The International Archives of the Photogrammetry, Remote Sensing and Spatial Information Sciences, Volume XL-7/W4, 2015
The coherence magnitude can also be estimated by spatially averaging the sample coherence magnitude values over the region of interest:
1 1
ˆ N
L Li
i
D d d
N
(4)where
d
L is the L- look sample coherence magnitude,i
is thesample number and N is the number of averaged samples. In this study, we used a spacing of 1/10000 for the coherence magnitude values and, using equation (3), obtained the value of the coherence magnitude that was closest to d as the unbiased L
estimate of the coherence magnitude, D .
Based on the above analysis, the PDFs for the flooded and non-flooded reed marshes were established. The performances of the calculated PDFs were compared with the original histograms using methods such as K-square, the Kullback-Leibler divergence and mean square error (MSE). Of these, the MSE is one of the most commonly used visual examination methods. If sufficiently good results are obtained using this method, the PDFs can be used to decide the coherence threshold for wet-reed mapping; if the PDFs produce a high MSE, the statistical analysis should begin again with the selection of new ROIs.
3. EXPERIMENTAL RESULTS AND DISCUSSION
3.1 Study Area and Data
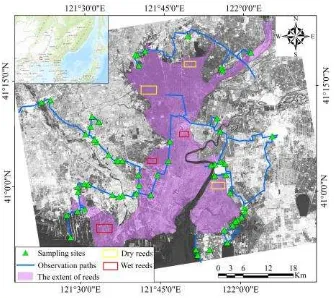
3.1.1 Site Description: The study area was the Liaohe River Delta in Liaoning Province, China, (40°45′ - 41°10′ N, 121°30′ -122°00′ E). This is located in the estuary of the Liaohe River, as shown in Figure 3. The region extends over a wide, flat plain and has an area of 3149 km2. The elevation is in the range 225 m above sea level. This area contains vegetation with a half-ring distribution pattern centered on the Shuangtaizi estuary. The dominant wetland type is reed marshes, which have an area of 800 km2 and account for the largest source of raw material used for paper making anywhere in the world (Weiguo et al. 2005). This region has a semi-humid monsoon climate, which means that there are seasonal variations in the precipitation: the year can be divided into a dry season (September to May) and a wet season (June to August). The annual precipitation is between 500 and 600 mm.
Figure 3. ALOS PALSAR image acquired on Aug. 3, 2007 over the study area with the extent of reeds shown in transparent light purple. The green triangles and blue lines correspond to ground observation sampling sites and paths, respectively. The
ROIs for reed marshes in different flooded states are marked in yellow and red.
3.1.2 SAR Data and Ground Data: A time series of L-band ALOS PALSAR images covering the complete growing season from June 18, 2007 to June 20, 2008 was acquired. The images consisted of Fine Beam Dual polarization (FBD) and Fine Beam Single polarization (FBS) mode data, offering a nominal range spacing of about 9 m and 4 m, respectively and an azimuth spacing of about 3 m for both. Seven ALOS PALSAR scenes were obtained during repeat passes that had the same incidence angle of 34.3° at 46-day intervals (see Table 1). Because of the combined impact of the progressive putrefaction and sinking of dry plants and the frozen ground surface in winter, no significant difference existed between the coherence magnitude for the two classes. Thus we chose images covering the period spring to autumn for the statistical analysis and wet-reed mapping.
Date Orbit Polarization Incidence
Angle (°) Direction
2007/06/18 437 HH+HV 34.3 Ascending
2007/08/03 437 HH+HV 34.3 Ascending
2007/09/18 437 HH+HV 34.3 Ascending
2007/11/03 437 HH 34.3 Ascending
2008/03/20 437 HH+HV 34.3 Ascending
2008/05/05 437 HH+HV 34.3 Ascending
2008/06/20 437 HH+HV 34.3 Ascending
Table 1. List of FBD- and FBS-mode ALOS PALSAR images used.
A field measurement campaign was carried out in the study area. Several geo-tagged photographs were taken at the test site to document the hydrological conditions in the reed marshes. Meanwhile, the growth status of the vegetation was investigated and measurements of plant height, leaf length, growth density and water level depth were made. The ground locations were recorded using a GARMIN GPS with an accuracy of 35 m. It was found that several non-flooded reed marshes lay in the northwest of the area, which is far away from the estuary and seldom experiences natural flows of water. Most of the flooded reed marshes were located in the northeast and in the area close to the Liaohe River estuary as a result of the water supplied by the Liaohe River and its tributaries.
3.2 Experimental Results
To calculate the parameters of the PDFs, sampling boxes covering areas representative of the dry reeds and wet reeds in the Liaohe River Delta were defined according to results of the field campaigns. These ROIs included roughly 1000 pixels each so that they covered areas of homogeneous vegetation (Figure 3). Figure 4 shows the probability distributions of the coherence magnitude for different hydrological states of the reed marshes during the study period. The flooded reed marshes peaks at nearly 0.80 within a coherence range of 0.40 to 0.95, while the coherence value of non-flooded areas ranges from 0 to 0.80 and reaches its maximum probability at about 0.35. A clear distinction between flooded and non-flooded reeds can be observed in the graphs.
Figure 4. Estimated PDFs together with histograms of the coherence for different seasons. Each plot corresponds to one season. The dashed lines correspond to the histograms and the colored solid lines are the PDFs.
The calculated MSE between the measured histograms and estimated PDFs ranged from 0.13 to 0.43 for all the image pairs, clearly supporting the idea that the estimated PDFs were suitable for use in the study area.
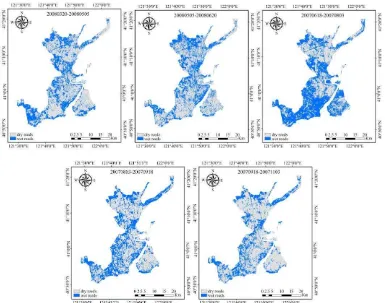
Motivated by the high demand for spatial distribution and temporal changes of the inundation patterns in reed marshes, wet-reed maps were derived for different vegetation stages using the proposed method (see Figure 5). Overall, wet reeds
are mainly found in the southwest of the area that closes to the Liaohe River estuary, near the rivers in the north-eastern and central parts of the study area, whereas the reed marshes far away from the estuary and rivers have less subsurface water cover. Moreover, the largest area of wet reeds corresponds to the main rainy season (JuneAugust) with the next largest area occurring in MayJune.
Figure 5. Seasonal wet-reed maps derived using the proposed method.
Since the areas covered by the reed marshes showed only small changes in the years from 2007 onwards according to official statistics, the experimental results were evaluated using in-situ data obtained from five areas on July 22, 2013. A total of 25 ROIs were located within these areas, which were distributed across the study area as shown in Figure 6. A comparison between the spatial distributions of wet reeds derived from the time series of ALOS PALSAR images and the field investigations shows a general good agreement.
Figure 6. Regions validated by ground observations shown on the ALOS PALSAR image from Aug. 3, 2007. The red rectangles correspond to areas of dry reeds and the blue
rectangles to wet reeds.
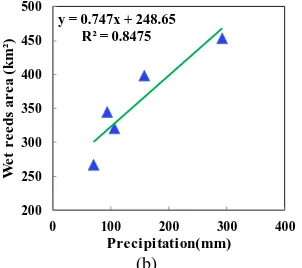
A quantitative analysis of the changes in the areas of the wet reeds and dry reeds for different seasons is depicted in Fig. 7(a). It can be seen that the area covered by wet reeds exhibits seasonal trends that are highly consistent with the amount of cumulative precipitation between acquisitions the correlation coefficient for this relationship is high at 0.8475 and the p-Value is 0.025 (Fig. 7(b)). In the rainy season from June to August, the area of reed marshes covered by water reaches its maximum of approximately 450 km2; in the spring and autumn, when there is less rainfall, the area is smaller. These results further confirm that the method developed in this study is reliable and can accurately capture the temporal dynamics of the hydrological regime in reed marshes.
However, there are some slight disagreements in the results that cannot be completely avoided. These may be caused by two factors: 1) errors due to highly coherent scatterers such as roads and sparsely distributed buildings and 2) temporal decorrelation due to the rapid growth of vegetation and the associated
Figure 7. (a) Seasonal variations in the areas covered by wet reeds and dry reeds. (b) Regression analysis for the area of wet
reeds and cumulative precipitation between acquisitions.
3.3 Discussion
The coherence magnitude is quite sensitive to the water surface conditions of the reed marshes. This sensitivity originates from the subsurface conditions and from the interferometric characteristics of SAR. Previous studies have shown that volume or surface scattering from reed marshes and other wetland types yields low coherence but that when double-bounce scattering dominates the return signal it becomes sufficiently coherent (Lu and Kwoun 2008). In fact, the hydrological state of reed marshes mainly reflects changes in the backscattering power and scattering mechanism. For dry reeds that are seldom or never covered by water, canopy multiple scattering and surface scattering are the prominent components in the signal and the coherence can be significantly reduced by volume decorrelation. Once flooding becomes significant, the scattering characteristics begin to change, resulting in temporal decorrelation (Pulvirenti et al. 2011). Permanently flooded reed marshes, however, can maintain high coherence between image acquisitions because of the double-bounce scattering produced mainly by reed stalks and the water surface.
The method presented in this paper showed great potential for detecting the water-covered area beneath reed marshes. The preliminary results are in good agreement with the field investigations. However, a validation has not yet been completely carried out as there may be small differences in the reed marsh area between 20072008 (when the PALSAR data were acquired) and 2013 (when the in-situ measurements were made). In addition, because of the nature of interferometric coherence, the results of the statistical analysis may be affected by radar parameters such as the incidence angle, polarization and frequency and by wetland features such as the vegetation water content, growth cycle and soil moisture. Future work will concentrate on improving the method by using multi-mode, long time series of SAR data to identify reed marshes in different hydrological states in order to obtain more accurate wet-reed mapping results that can be used in the management of wetland landscapes.
4. CONCLUSIONS
The results obtained in this study revealed that interferometric coherence was very sensitive to the subsurface conditions in wetlands and had an excellent ability to separate wet reeds and dry reeds. Given these unique properties, a method for the hydrological monitoring of reed marshes based on the statistical The International Archives of the Photogrammetry, Remote Sensing and Spatial Information Sciences, Volume XL-7/W4, 2015
distributions of the coherence magnitude was developed and then validated using five sets of in-situ data collected in reed-covered areas during the heading and flowering periods in the Liaohe River Delta, China. This method is a promising tool for monitoring the hydrological state of wetlands in a timely and effective way and is well-suited for use in large and complex regions due to its simplicity and reliability. However, further validation remains to be carried out because of the changes in the area of the reed marshes that occurred between the time of the SAR observations and the field investigations. Future work will use the proposed method together with multi-mode SAR data to monitor the hydrological environment of reed marshes with the aim of achieving much more accurate estimates of the extent of wet-reed cover.
ACKNOWLEDGEMENTS
This research was supported by the National Science Foundation of China (No. 41471065 & No. 41201447).
REFERENCES
Arnesen, A. S., Silva, T. S. F., Hess, L. L., Novo, E. M. L. M., Rudorff, C. M., Chapman, B. D., and McDonald, K. C. 2013. "Monitoring flood extent in the lower Amazon River floodplain using ALOS/PALSAR ScanSAR images." Remote Sensing of Environment, 130(4), pp. 51–61.
Bayley, P. B. 1995. "Understanding large river: floodplain ecosystems." BioScience, pp. 153–158.
Grings, F. M., Ferrazzoli, P., Jacobo-Berlles, J. C., Karszenbaum, H., Tiffenberg, J., Pratolongo, P., and Kandus, P. 2006. "Monitoring flood condition in marshes using EM models and Envisat ASAR observations." IEEE Transactions on Geoscience and Remote Sensing, 44(4), pp. 936–942.
Halls, A. 1997. "Wetlands, biodiversity and the Ramsar convention: the role of the convention on wetlands in the conservation and wise use of biodiversity." Ramsar Convention Bureau, Gland, Switzerland. ISBN.
Hess, L.L., Melack, and J.M. 1995. "Delineation of inundated area and vegetation along the Amazon floodplain with the SIR-C synthetic aperture radar." IEEE Transactions on Geoscience and Remote Sensing, 33(4), pp. 896–904.
Hess, L.L., MELACK, J. M., and SIMONETT, D. S. 2007. "Radar detection of flooding beneath the forest canopy: a review." International Journal of Remote Sensing, 11(7), pp. 1313–1325.
Hong, S.-H., Wdowinski, S., Kim, S.-W., and Won, J.-S. 2010. "Multi-temporal monitoring of wetland water levels in the Florida Everglades using interferometric synthetic aperture radar (InSAR)." Remote Sensing of Environment, 114(11), pp. 2436–2447.
Karszenbaum, H., Kandus, P., Martinez, J., Le Toan, T., Tiffenberg, J., and Parmuchi, G. 2000. "ERS-2, RADARSAT SAR backscattering characteristics of the Paraná River Delta wetland, Argentina." ESA publication, SP–461.
Kasischke, E. S., Smith, K. B., Bourgeau-Chavez, L. L., Romanowicz, E. A., Brunzell, S., and Richardson, C. J. 2003. "Effects of seasonal hydrologic patterns in south Florida
wetlands on radar backscatter measured from ERS-2 SAR imagery." Remote Sensing of Environment, 88(4), pp. 423–441.
Lu, Z., Kim, J.-W., Lee, H., Shum, C. K., Duan, J., Ibaraki, M., and Read, C.-H. 2009. "Helmand River Hydrologic Studies Using ALOS PALSAR InSAR and ENVISAT Altimetry." Marine Geodesy, 32(3), pp. 320–333.
Lu, Z., and Kwoun, O.-I. 2008. "Radarsat-1 and ERS InSAR analysis over southeastern coastal Louisiana: Implications for mapping water-level changes beneath swamp forests." IEEE Transactions on Geoscience and Remote Sensing, 46(8), pp. 2167–2184.
Martinez, J.-M., and Toan, T. L. 2007. "Mapping of flood dynamics and spatial distribution of vegetation in the Amazon floodplain using multitemporal SAR data." Remote Sensing of Environment, 108(3), pp. 209–223.
Ordoyne, C., and Friedl, M. A. 2008. "Using MODIS data to characterize seasonal inundation patterns in the Florida Everglades." Remote Sensing of Environment, 112(11), pp. 4107–4119.
Pulvirenti, L., Chini, M., Pierdicca, N., Guerriero, L., and Ferrazzoli, P. 2011. "Flood monitoring using multi-temporal COSMO-SkyMed data: Image segmentation and signature interpretation." Remote Sensing of Environment, 115(4), pp. 990–1002.
Touzi, R., and Lopes, A. 1996. "Statistics of the Stokes parameters and of the complex coherence parameters in one-look and multione-look speckle fields." IEEE Transactions on Geoscience and Remote Sensing, 34(2), pp. 519–531.
Touzi, R., Lopes, A., Bruniquel, J., and Vachon, P. W. 1999. "Coherence estimation for SAR imagery." IEEE Transactions on Geoscience and Remote Sensing, 37(1), pp. 135–149.
Voormansik, K., Praks, J., Antropov, O., Jagomagi, J., and Zalite, K. 2014. "Flood mapping with TerraSAR-X in forested regions in Estonia." IEEE Journal of Selected Topics in Applied Earth Observations and Remote Sensing, 7(2), pp. 562–577.
Ward, D. P., Petty, A., Setterfield, S. A., Douglas, M. M., Ferdinands, K., Hamilton, S. K., and Phinn, S. 2014. "Floodplain inundation and vegetation dynamics in the Alligator Rivers region (Kakadu) of northern Australia assessed using optical and radar remote sensing." Remote Sensing of Environment, 147(10), pp. 43–55.
Wdowinski, S. 2008. "Space-based detection of wetlands' surface water level changes from L-band SAR interferometry." Remote Sensing of Environment, 112, pp. 681–696.
Weiguo, J., Jing, L., and Wenjie, W. 2005. "An analysis of changes and driving forces of wetland using RS and GIS in Liaohe River Delta." Remote Sensing for Land & Resources, 65(7), pp. 62–65.
Revised June 2015