Nathan A. Slaton,* Charles E. Wilson Jr., Sixte Ntamatungiro, Richard J. Norman, and Danny L. Boothe
ABSTRACT gence (Martens and Westermann, 1991). These studies
have not investigated a complete range of Zn seed treat-Zinc seed treatments for rice (Oryza sativaL.) were previously
ment rates and sources to compare with standard soil evaluated as an alternative to soil-applied Zn. Recommendations
con-cerning the effectiveness of Zn seed treatments were never clearly or foliar Zn fertilization methods.
stated. Our objectives were to evaluate the utility of Zn seed treat- Martens et al. (1973) concluded that band application ments for supplying Zn to rice grown on soils prone to Zn deficiency. of Zn fertilizer in contact with the corn (Zea maysL.) In 1998, a study with three cultivars compared Zn-treated seeds [2.8 g seeds at rates ranging from 0.34 to 1.34 kg Zn ha21
Zn (kg seed)21] with a control and 11 kg Zn ha21as ZnSO
4applied produced grain yields equal to those achieved when 26.9
to the soil. Because tissue Zn concentration did not differ among kg Zn ha21as ZnSO
4was broadcast on the soil surface
cultivars, a single cultivar, Drew, was used in studies at two locations
and incorporated before planting. Earlier research with in 1999. The control and the soil-applied Zn were compared with
rice (Haghighat and Thompson, 1982; Giordano and seeds that were treated with three rates of ZnSO4 and ZnEDTA
Mortvedt, 1973; Mengel et al., 1976; Rush, 1972) also (ethylenediaminetetraacetic acid). Analysis showed net seed
concen-suggested that the application of low rates of Zn to rice trations of 1.0, 2.2, and 4.7 g Zn (kg seed)21as ZnSO
4and 1.4, 2.8,
and 5.7 g Zn (kg seed)21as ZnEDTA. In 1998, neither visual Zn seeds or dipping the roots of transplanted rice in a Zn
deficiency symptoms nor significant yield differences were observed solution may be effective alternatives to broadcast appli-among treatments. Soil-applied Zn and Zn seed treatments increased cations of Zn fertilizer.
tissue Zn concentration by 11.9 and 4.7 mg Zn kg21, respectively,
In Arkansas, Zn fertilizer recommendations for rice above that of the control (19.7 mg Zn kg21). In 1999, Zn deficiency
are currently based on the soil pH and texture. Zinc is occurred at both locations. Measurements of dry matter, tissue Zn
recommended for rice, regardless of soil test Zn levels, concentration, and grain yield showed that Zn-treated seed performed
grown on silt and sandy loam soils having a pH.6.5. equal to or better than soil-applied Zn. These data suggest that seed Zn
Sedberry et al. (1980) and Wells (1980) both found the concentrations between 2.2 to 5.7 g Zn (kg seed)21are an economical
soil pH to best predict rice response to Zn fertilization alternative to soil-applied Zn.
during the early 1970s. However, much of this research was conducted before the widespread use of Zn fertilizers. Since the development of Zn fertilizer recommendations,
Z
inc seed treatments were evaluatedin rice as anthe low native soil Zn concentrations have increased ap-alternative to soil- or foliar-applied Zn by several
preciably due to repeated broadcast applications of inor-researchers in the early 1970s with limited success
ganic Zn sources to each rice crop. Subsequently, the (Haghighat and Thompson, 1982; Giordano and
Mort-frequency of both Zn deficiency symptoms and docu-vedt, 1973; Mengel et al., 1976; Rush, 1972). Due to
mented rice yield responses to Zn fertilization has de-the limited amount of research, Zn seed treatments for
clined (Slaton et al., 1995; Thompson and Kasireddy, rice and recommendations concerning their
effective-1975). Until a critical soil test Zn level for Zn fertilizer ness were never clearly stated. Despite the lack of formal
recommendations is established, alternative methods of recommendations, Zn-treated seed rice is available
supplying Zn to the rice crop on high-pH soils are be-throughout the southern USA rice-growing area.
Litera-ing investigated. ture concerning the efficacy of micronutrient fertilizer
Because the application of small amounts of Zn to applications to crop seeds is limited. Rasmussen and
rice seeds would be more economical and convenient Boawn (1969) determined that Zn seed treatment alone
than either soil or foliar applications, our objectives was not effective in preventing Zn deficiency of kidney
were to evaluate the effect of Zn seed treatments on beans (Phaseolus vulgarisL.). Yilmaz et al. (1997) also
the dry matter production, tissue Zn concentration, and concluded that soil-applied Zn was a superior
fertiliza-grain yield of rice in comparison with the standard rec-tion method compared with Zn-treated wheat (Triticum
ommendation of broadcast soil applied Zn. A secondary
aestivumL.) seed or foliar Zn applications. Other
stud-objective of our studies was to determine the effect of ies have found that the application of Zn to seeds has
Zn seed treatment on germination and the lengths of either failed to prevent Zn deficiency or reduced
emer-the radicle and coleoptile.
N.A. Slaton, S. Ntamatungiro, and D.L. Boothe, P.O. Box 351, Univ. MATERIALS AND METHODS of Arkansas Rice Res. and Ext. Cent., Stuttgart, AR 72160; C.E.
Wilson Jr., P.O. Box 3508, Univ. of Arkansas Southeast Res. and Ext. A preliminary field study was conducted at the Rice
Re-Cent., Monticello, AR 71656; and R.J. Norman, Dep. of Crop, Soil, search and Extension Center (RREC) near Stuttgart, AR and Environ. Sci., Univ. of Arkansas, Plant Sci. 115, Fayetteville, AR (34.308N lat) during 1998 on a DeWitt silt loam (fine, smectitic, 72701. Published with the approval of the director of the Arkansas thermic, Typic Albaqualfs) that had received 4480 kg ha21
Agric. Exp. Stn., Manuscript #00004. Research was partially funded lime (CaCO
3) in 1996. Rice grown in this field in 1997 exhibited
by rice grower check-off contributions administered by the Arkansas Rice Research and Promotion Board. Received 17 Feb. 2000.
*Corre-Abbreviations:ICAP, inductively coupled Ar plasma spectrophotom-sponding author ([email protected]).
etry; PPI, preplant incorporated; PTBS, Pine Tree Branch Station; RREC, Rice Research and Extension Center; TDM, total dry matter. Published in Agron. J. 93:152–157 (2001).
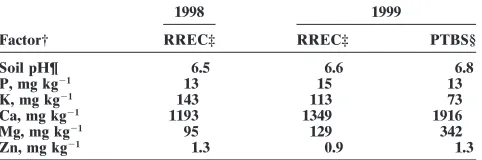
Table 1. Selected soil chemical properties from 1998 and 1999 Zn deficiency symptoms after flood application. Soil samples
Zn fertility studies. collected before seeding were analyzed for extractable cations
(including Zn21) by Mehlich 3 extraction (Mehlich, 1984). Soil
1999 1998
pH was determined in a 1:2 soil water suspension with a glass
Factor† RREC‡ RREC‡ PTBS§
electrode. Selected soil chemical properties are listed in
Ta-Soil pH¶ 6.5 6.6 6.8
ble 1.
P, mg kg21 13 15 13
Seeds of the rice cultivars ‘Cypress’, ‘Drew’, and ‘Jefferson’
K, mg kg21 143 113 73
that were treated with either Vitavax (Carboxin) (5,6-dihy- Ca, mg kg21 1193 1349 1916
dro-2 methyl-N-phenyl-1,4-oxathiin-3-carboxamide) or Vita- Mg, mg kg21 95 129 342
Zn, mg kg21 1.3 0.9 1.3
vax plus Zn (Zn Starter, Agtrol Chem., Houston, TX) (J.
Garrett, personal communication, 1998) were obtained from † Values are the average of four composite samples taken from control Garrett Seed Farms (Danbury, TX). An elemental analysis plots in each replication. Mehlich 3 soil extractant used for elements.
‡ RREC, Rice Research and Extension Center, near Stuttgart, AR. of the Zn-treated seeds indicated a net concentration of 2.8 g
§ PTBS, Pine Tree Branch Station, Colt, AR. Zn (kg seed)21(0.34 kg Zn ha21). Zinc-treated seeds were
¶ Soil weight/water volume ratio was 1:2. compared with seeds that received no Zn seed treatment but
were fertilized with either 0 or 11 kg Zn ha21(ZnSO
4-31% ples were immediately washed in deionized water, 0.1
MHCl, Zn, Tetra Micronutrients1, The Woodlands, TX) applied to
and rinsed in deionized water before drying to remove possible the soil and preplant incorporated (PPI). Rice was seeded on
sources of contamination (Wells, 1980). The samples were 23 June at a rate of 120 kg ha21in plots consisting of nine
dried at 608C to a constant weight, weighed, and ground in a rows that were 4.88 m long and spaced 17.8 cm apart.
Wiley mill to pass a 2-mm sieve. The ground tissue (0.5-g In 1999, studies were conducted at the RREC on a DeWitt
subsample) was digested with concentrated HNO3and 30% silt loam and at the Pine Tree Branch Station (PTBS) near
H2O2(wt./wt.) for determination of the whole plant elemental Colt, AR (35.088 N lat) on a Calloway silt loam (fine-silty,
composition (Jones and Case, 1990). An elemental analysis mixed, thermic, Glossaquic Fragiudalfs). Selected soil
chemi-of the plant digests was performed by ICAP (Soltanpour et cal properties are listed in Table 1. Because 1998 experiments
al., 1996). At maturity, 2.6 m2from the center four rows of failed to show Zn deficiency symptoms, 2240 kg ha21lime was
each plot was harvested for grain yield with a small plot com-applied at the RREC. Soil Ca and Mg levels were higher at
bine. The reported grain yields were adjusted to 120 g kg21 the PTBS location, so lime was not applied. Split applications
of moisture. of 68 kg P ha21were made at both locations before seeding
The treatments were arranged as a randomized complete and again before establishment of the permanent flood to
block, 3 (cultivar)33 (Zn fertilizer treatments) factorial de-enhance the likelihood of Zn deficiency. Potassium fertilizer
sign with four replications in 1998. During 1999, each location was broadcast across all treatments as needed according to
was arranged in a randomized complete block with four repli-soil analysis.
cations. A split-plot analysis was used where location was the The cultivar Drew was seeded at the RREC and PTBS on
whole-plot factor and Zn fertilizer treatment was the subplot 20 May and 22 April, respectively. Rice was seeded at a rate
factor. All data were analyzed using the PROC GLM proce-of 120 kg ha21in plots consisting of nine rows that were 4.88 m
dure of SAS. Differences among treatments were identified long and spaced 17.8 cm apart. The treatments included an
using Fisher’s protected LSD test at the 0.05 or 0.10 signifi-untreated control, 11 kg Zn ha21PPI (as previously described),
cance level. and six treatments with different amounts of Zn applied to
seeds. Zinc was applied to seeds at three rates using either a
Seed Viability ZnSO4solution or liquid 9% ZnEDTA chelate (wt./wt.). The
ZnSO4solutions were prepared by dissolving 100, 200, or 400 g To evaluate the effect of Zn seed treatment on seed viabil-of reagent grade ZnSO4· 7H2O in 1 L of H2O. The seeds were ity, treated and untreated seeds from 1999 field studies were then treated by mixing 113.5 g of seeds with 7.5 mL of the placed in a germinating chamber at 208C, approximately 8 mo ZnSO4solution. For the EDTA treatment, 113.5 g of seeds after treatment. Seeds were stored in paper envelopes at room was mixed with a total volume of 100 mL of EDTA solution temperature during this period. Fifty seeds from each treat-of which 25, 50, or 100 mL was 9% ZnEDTA (wt./wt.). ment were placed in a petri dish, and 3 mL of deionized water To determine the amount of Zn coated on the seeds, treated was added to each dish. Each treatment was replicated three and untreated seeds were digested with HNO3and 30% H2O2 times. The germination of seeds was checked at 6, 8, and 10 d. (wt./wt.) (Jones and Case, 1990) and analyzed by inductively A seed with a visible radicle or coleoptile was counted as coupled Ar plasma spectrophotometry (ICAP) (Soltanpour germinated. Germination data are reported as the percent of et al., 1996). Seed analysis showed a net Zn coating content seeds germinated. At the 10-d measurement, the emerged of 1.0 (0.12 kg Zn ha21), 2.2 (0.26 kg Zn ha21), and 4.7 g Zn
radicle and coleoptile of 10 randomly selected germinated (kg seed)21(0.56 kg Zn ha21) as ZnSO
4and 1.4 (0.17 kg Zn seeds were measured from each treatment replicate. ha21), 2.8 (0.34 kg Zn ha21), and 5.7 g Zn (kg seed)21(0.68
The treatments were arranged as a randomized complete kg Zn ha21) as ZnEDTA. Therefore, approximately one-half
block design with three replications. All data were analyzed of the added Zn was retained on the seeds. using the PROC GLM procedure of SAS. Differences among
For all studies, 150 kg N ha21 was applied as urea
treatments were identified using Fisher’s protected LSD test [(NH2)2CO] to the dry soil surface immediately before flooding at the 0.05 significance level.
at the 4-leaf growth stage. Plant samples were collected 14 d after flooding by removal of the aboveground plant tissue in
RESULTS AND DISCUSSION
a 0.9-m row section of the second inside row. The tissuesam-1998 Experiment
1Mention of trade names and commercial products in this article
The total dry matter (TDM) production, harvest grain is solely for the purpose of providing specific information, does not
moisture, and grain yield of rice were not significantly constitute a guarantee or warranty, and does not signify that these
Table 4. Effect of Zn seed treatment source and rate on rice total Table 2. Effect of rice cultivar on grain yield, total dry matter
(TDM), and harvest moisture averaged across Zn treatments dry matter (TDM) by 14 d after flooding compared with an untreated and standard check at two locations in 1999. during 1998 at the Rice Research and Extension Center
(RREC), near Stuttgart.
TDM†
Cultivar Grain yield TDM Grain moisture
Zn fertilizer treatment PTBS‡ RREC§
* Significant at the 0.05 level.
1.4 g Zn-EDTA (kg seed)21 849 562
*** Significant at the 0.001 level.
2.8 g Zn-EDTA (kg seed)21 1193 955
5.7 g Zn-EDTA (kg seed)21 1147 1232
fertilizer treatment interaction but were significantly LSD(0.10) within location 136
LSD(0.10) between locations 193
different among cultivars (Table 2). The lack of
differ-ences among the Zn fertilizer treatments suggested that †P-value for Zn fertilizer treatment3location50.092. ‡ PTBS, Pine Tree Branch Station, Colt, AR.
rice was not Zn deficient and would not show a
signifi-§ RREC, Rice Research and Extension Center, near Stuttgart, AR. cant yield and growth response to Zn fertilization.
Al-¶ Standard check. PPI, preplant incorporated. though not statistically significant at the 0.05 level of # Seeding rate for all treatments was 120 kg ha21seed. probability (P5 0.16), the grain yield for both 11 kg
Zn ha21PPI and 2.8 g Zn (kg seed)21was 214 and 360
plots while few or no symptoms were observed in the kg ha21 greater than the control, respectively, when
4.7 g Zn (kg seed)21as ZnSO
4and 5.7 g Zn (kg seed)21
averaged across the cultivars (Table 3).
as ZnEDTA plots. The deficiency symptoms were most The tissue Zn concentration of whole-plant seedlings
severe at the RREC. Thus, the response of the rice 14 d after flooding did show significant differences
be-TDM among Zn treatments differed between locations tween Zn fertilizer treatments (Table 3). The tissue Zn
for some treatments (Table 4). The rice TDM response concentration followed the highest-to-lowest order of
at each location was indicative of the degree of Zn 11 kg Zn ha21 PPI . 2.8 g Zn (kg seed)21 . control.
deficiency symptoms expressed among Zn treatments Rasmussen and Boawn (1969) suggested that Zn seed
at each location. treatment of kidney bean was not an adequate
alterna-At the PTBS, seeds that were treated with Zn pro-tive to broadcast Zn fertilizer applications to the soil
duced significantly greater TDM by 14 d after flooding because Zn deficiency symptoms occurred, and Zn seed
than both the control and 11 kg Zn ha21PPI, regardless
treatment failed to produce yields equal to soil Zn
appli-of the Zn source or rate. It is unclear why Zn deficiency cation. Based on the 1998 tissue concentration data, 11
symptoms occurred in the 11 kg Zn ha21PPI treatment.
kg Zn ha21 PPI was superior to 2.8 g Zn (kg seed)21
The random occurrence of deficiency symptoms within for supplying Zn to seedling rice plants. However, both
each 11 kg Zn ha21PPI plot suggests that uniform
fertil-treatments increased tissue Zn in rice seedlings above
izer distribution at the applied rate could not supply the the level considered deficient (20 mg kg21) while the
plants that were physically located between fertilizer control was near the critical threshold (Sedberry et al.,
granules with adequate Zn nutrition. Both the control 1987). Although Zn tissue concentration data were a
and 11 kg Zn ha21PPI treatments recovered from the
useful means of evaluation, the effectiveness of Zn seed
treatments can best be made under Zn deficient con- early Zn deficiency symptoms within 14 d after plant
ditions. samples were taken. Within the Zn seed treatments, the
TDM tended to increase as the Zn application rate
in-1999 Experiments
creased.At the RREC, the TDM for 11 kg Zn ha21PPI was
Zinc deficiency symptoms similar to those described
significantly greater than the control, 1.0 g Zn (kg by Sedberry et al. (1978) were observed at both locations
seed)21as ZnSO
4, and 1.4 g Zn (kg seed)21as ZnEDTA
in 1999. The symptoms were most severe in the control
treatments and equal to all other treatments. Stand loss
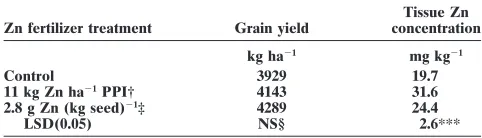
Table 3. Effect of Zn fertilizer treatment, averaged across culti- occurred in two of four replications of the control plots
vars, on grain yield and tissue Zn concentration of seedling at the RREC and resulted in a significantly lower TDM rice 14 d after flooding during 1998 at the Rice Research and than the control at the PTBS. The only other treatments Extension Center (RREC), near Stuttgart.
that showed significant differences between locations Tissue Zn were the 11 kg Zn ha21 PPI and 1.4 g Zn (kg seed)21
Zn fertilizer treatment Grain yield concentration
as ZnEDTA treatments. It is unclear why the 11 kg Zn
kg ha21 mg kg21
ha21PPI treatment responded differently between the
Control 3929 19.7
two locations. The 1.4 g Zn (kg seed)21 as ZnEDTA
11 kg Zn ha21PPI† 4143 31.6
2.8 g Zn (kg seed)21‡ 4289 24.4
and 1.0 g Zn (kg seed)21as ZnSO
4treatments apparently
LSD(0.05) NS§ 2.6*** contained insufficient Zn to maximize plant growth at
*** Significant at the 0.001 probability level. the RREC. Based on the TDM data from both locations,
† PPI, preplant incorporated. Zn seed treatments should be applied at rates between
‡ Seeding rate for all treatments was 120 kg ha21seed.
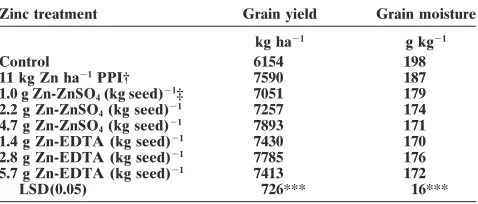
Table 6. Effect of Zn seed treatment source and rate on rice grain Table 5. Effect of Zn seed treatment source and rate on rice
tissue Zn concentration by 14 d after flooding compared with yield and harvest grain moisture compared with an untreated and standard check in 1999 (data averaged across two lo-an untreated lo-and stlo-andard check at two locations in 1999.
cations).
Tissue Zn concentration
Zinc treatment Grain yield Grain moisture
Treatment PTBS† RREC‡
kg ha21 g kg21
mg kg21
Control 6154 198
Control 17.5 17.5 11 kg Zn ha21PPI† 7590 187
11 kg Zn ha21PPI§ 19.4 31.0
1.0 g Zn-ZnSO4(kg seed)21‡ 7051 179
1.0 g Zn-ZnSO4(kg seed)21¶ 20.2 16.9 2.2 g Zn-ZnSO
4(kg seed)21 7257 174
2.2 g Zn-ZnSO4(kg seed)21 20.9 18.5 4.7 g Zn-ZnSO
4(kg seed)21 7893 171
4.7 g Zn-ZnSO4(kg seed)21 29.7 20.9 1.4 g Zn-EDTA (kg seed)21 7430 170
1.4 g Zn-EDTA (kg seed)21 22.1 17.8
2.8 g Zn-EDTA (kg seed)21 7785 176
2.8 g Zn-EDTA (kg seed)21 25.0 24.4
5.7 g Zn-EDTA (kg seed)21 7413 172
5.7 g Zn-EDTA (kg seed)21 24.3 26.0
LSD(0.05) 726*** 16***
LSD(0.05) within location 2.8***
LSD(0.05) between locations 4.0*** *** Significant at the 0.001 probability levels. † Standard check. PPI, preplant incorporated. *** Significant at the 0.001 probability level. ‡ Seeding rate for all treatments was 120 kg ha21seed.
† PTBS, Pine Tree Branch Station, Colt, AR.
‡ RREC, Rice Research and Extension Center, near Stuttgart, AR.
treatments to supply the Zn that is required for normal § Standard check. PPI, preplant incorporated.
¶ Seeding rate for all treatments was 120 kg ha21seed.
plant growth, development, and grain production. Rush (1972) found significant increases in rice grain yield from Zn seed treatments but also observed that Zn deficient conditions, with the higher rate being
pre-ferred. some Zn products and application rates were toxic and
reduced stand density. Rasmussen and Boawn (1969) The tissue Zn concentration also showed a significant
Zn fertilizer treatment3location interaction (Table 5). also noted a delay in the germination and emergence of kidney bean as well as reduced seedling vigor for The general response of the tissue Zn concentration
among Zn fertilizer treatments was similar to that found from some Zn seed treatments. Plant population mea-surements were not made in our field studies, but no for the TDM. Comparison of data in Tables 4 and 5
reveals that the treatments at each location with the visual differences were noticed among the treatments. However, germination data from seeds used in these lowest tissue Zn concentrations also tended to produce
the lowest TDM. The fact that Zn seed treatments in- tests did suggest that Zn seed treatments could influence stand establishment (Table 7). Although the seed germi-creased the TDM and tended to increase the tissue Zn
concentrations, and thus the total Zn uptake, suggests nation among treatments by 6 d was not significant, the general order of germination established by 8 d was that Zn-treated seeds are capable of supplying sufficient
Zn to maximize plant growth under conditions of Zn evident. By 8 d, the germination of untreated seeds was significantly lower than all of the Zn-coated seed deficient soil. The total Zn uptake by rice at maturity
is approximately 0.5 kg ha21, and crop removal accounts treatments. By 10 d, the germination of untreated seeds
and the 5.7 g Zn (kg seed)21 as ZnEDTA treatment
for about one-half of the total Zn uptake (unpublished
data, 1997). The application of Zn rates that are equal was lower than all other treatments, which were not different. The decrease in the germination of seeds to the total crop uptake should be adequate to supply
the crop nutritional requirements if the uptake of fertil- treated with ZnEDTA was likely due to fungal growth. Fungal growth completely covered some ZnEDTA-izer Zn is highly efficient. Broadcast fertilZnEDTA-izer
applica-tions made to the soil are about 20 times the total Zn treated seeds by 10 d, and thus hid the radicle or coleop-tile from view. The trend for the percent germination requirement of rice.
The grain yield was significantly affected only by Zn to decline as the ZnEDTA rate increased was represen-tative of the increased fungal growth. Despite the good fertilizer treatment, and thus was averaged between
lo-cations (Table 6). All of the treatments with Zn-treated initial germination of seeds treated with ZnEDTA, the potential may exist for this product to reduce seedling seeds or 11 kg Zn ha21PPI produced significantly higher
yields than the control. All of the Zn seed treatments vigor, so it should be further evaluated before being used as a Zn seed treatment.
produced yields that were similar to the standard
recom-mendation of 11 kg Zn ha21PPI. The control also had Radicle and coleoptile measurements were made only
on germinated seed at 10 d (Table 7). The radicle length the highest grain moisture at harvest, indicating that
the application of Zn enhanced maturation, and thus of untreated seeds was greater than that of all of the treatments, except the 1.0 g Zn (kg seed)21 as ZnSO
4.
normal crop growth and development (Table 6). Grain
harvest moisture is not a parameter that is commonly The radicle length tended to decrease as the Zn rate increased, suggesting that Zn may inhibit radicle elonga-reported to evaluate fertility treatments, except when
the degree of maturation is important. When the Zn tion. The coleoptile length was different only for seeds that were treated with ZnEDTA. Seeds that were deficiency of flood-irrigated rice is uncorrected, as in
the control of these studies, stand loss may occur, plant treated with ZnSO4, regardless of the rate, and
un-treated seeds had significantly longer coleoptiles than maturity may be delayed, or both. This can result in
additional production costs and reduced milling (qual- seeds that were treated with all rates of ZnEDTA. The coleoptile length of seeds treated with ZnEDTA also ity) and grain yields. Thus, harvest moisture provides
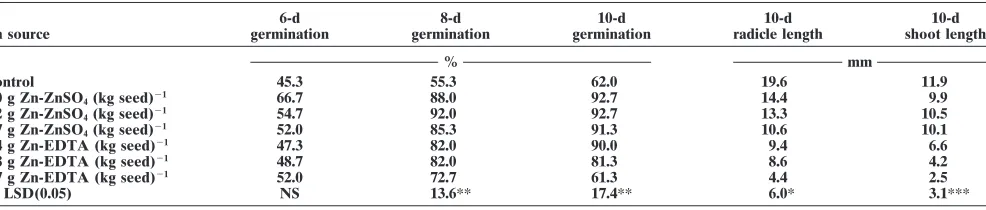
Table 7. Effect of Zn seed treatment on rice seed germination, radicle length, and coleoptile length approximately 8 mo after zinc appli-cation.
6-d 8-d 10-d 10-d 10-d
Zn source germination germination germination radicle length shoot length
% mm
Control 45.3 55.3 62.0 19.6 11.9
1.0 g Zn-ZnSO4(kg seed)21 66.7 88.0 92.7 14.4 9.9
2.2 g Zn-ZnSO4(kg seed)21 54.7 92.0 92.7 13.3 10.5
4.7 g Zn-ZnSO4(kg seed)21 52.0 85.3 91.3 10.6 10.1
1.4 g Zn-EDTA (kg seed)21 47.3 82.0 90.0 9.4 6.6
2.8 g Zn-EDTA (kg seed)21 48.7 82.0 81.3 8.6 4.2
5.7 g Zn-EDTA (kg seed)21 52.0 72.7 61.3 4.4 2.5
LSD(0.05) NS 13.6** 17.4** 6.0* 3.1***
* Significant at the 0.05 level. ** Significant at the 0.01 level. *** Significant at the 0.001 level.
More germination and seedling vigor tests are needed ble interactions with other seed treatment chemicals, and the detrimental effects that have been observed to evaluate the effect of the Zn application rate, Zn
source, temperature, and storage time on seed vigor and with Zn seed treatments for the vast number of Zn products that are available. The potential use of Zn viability. These preliminary data from the germination
chamber illustrate the importance of thorough testing seed treatments for other Zn sensitive crops should also be investigated.
of new recommendations, especially when stand failure is a potential risk. Although stand establishment
prob-lems were not observed in the 1999 field studies with any REFERENCES
Zn seed treatment, environmental conditions in future Giordano, P.M., and J.J. Mordvedt. 1973. Zinc sources and methods years could favor the development of seedling diseases of application for rice. Agron. J. 65:51–53.
Haghighat, N.G., and L.F. Thompson. 1982. Zinc seed coating studies and stand loss. Growers and seed dealers are
encour-with rice. p. 74–75.InProc. Rice Tech. Working Group, 19th, Univ. aged to use Zn seed treatments, but they should use
of Arkansas, Hot Springs, AR. 23–25 Feb. 1982. Texas Agric. Exp. only products that have been tested and deemed safe
Stn., Texas A&M Univ., College Station, TX 77843-2124. and effective. Jones, J.B., and V.W. Case. 1990. Sampling, handling, and analyzing
plant tissue samples. p. 389–428. InR.L. Westerman (ed.) Soil testing and plant analysis. 3rd ed. SSSA Book Ser. 3. SSSA,
Madi-SUMMARY
son, WI.Martens, D.C., G.W. Hawkins, and G.D. McCart. 1973. Field response Rice response to Zn fertilization by soil or seed treat- of corn to ZnSO4and Zn-EDTA placed with the seed. Agron. ment was limited in the 1998 study due to a lack of Zn J. 65:135–136.
Martens, D.C., and D.T. Westermann. 1991. Fertilizer applications for deficiency. Despite the lack of yield response, the 1998
correcting micronutrient deficiencies. p. 549–592.InJ.J. Mortvedt results showed that Zn seed treatments increased the
(ed.) Micronutrients in agriculture. 2nd ed. SSSA Book Ser. 4. Zn concentration of rice seedlings and may hold promise SSSA, Madison, WI.
as an economical alternative to more expensive broad- Mehlich, A. 1984. Mehlich 3 soil test extractant: A modification of Mehlich 2 extractant. Commun. Soil Sci. Plant Anal. 15:1409–1416. cast Zn fertilizer applications. Grain yield, tissue Zn
Mengel, D.B., W.J. Leonards, and J.E. Sedberry Jr. 1976. Effect of concentration, and TDM data generated at two
loca-zinc oxide seed treatment on stand establishment, leaf loca-zinc concen-tions in 1999 support the use of Zn-treated seeds as a trations, and yield of Saturn rice. p. 62–63.In68th Annu. Prog. safe, effective means of fertilizing rice grown on Zn Rep. Rice Exp. Stn. Crowley, LA. Louisiana State Univ. Agric. deficient soils. The grain yield was significantly im- Exp. Stn., Baton Rouge.
Rasmussen, P.E., and L.C. Boawn. 1969. Zinc seed treatment as a proved by the use of Zn seed treatment compared with
source of zinc for beans. Agron. J. 61:674–676. the control and was equal to the yield from the standard
Rush, M.C. 1972. Effects of seed treatment with four zinc sources on recommendation of 11 kg Zn ha21PPI.
stand and yield of Saturn rice. p. 269–270.In64th Annu. Prog. Seeds that were treated with ZnSO4 had a higher Rep. Rice Exp. Stn. Crowley, LA. Louisiana State Univ. Agric.
Exp. Stn., Baton Rouge. germination rate than untreated seeds after an 8-mo
Sedberry, J.E. Jr., M.C. Amacher, D.P. Bligh, and O.D. Curtis. 1987. storage period. Seeds that were treated with ZnEDTA
Plant-tissue analysis as a diagnostic aid in crop production. Louisi-also tended to germinate better than the untreated ana Agric. Exp. Stn. Bull. 783. Louisiana State Univ., Baton Rouge. seeds, but ZnEDTA encouraged fungal growth and re- Sedberry, J.E. Jr., F.J. Peterson, F.E. Wilson, D.B. Mengel, P.E. Schil-duced the coleoptile length, thereby reducing vigor as ling, and R.H. Brupbacher. 1980. Influence of soil reaction and applications of zinc on yields and zinc contents of rice plants. the study progressed. Despite excellent results from
Commun. Soil Sci. Plant Anal. 11:283–295. field studies for TDM and grain yield, the ZnETDA
Sedberry, J.E. Jr., P.G. Schilling, F.E. Wilson, and F.J. Peterson. 1978. sources should be avoided due to the potential risks of Diagnosis and correction of zinc problems in rice production. Loui-stand failure. The application of relatively low rates of siana Agric. Exp. Stn. Bull. 708. Louisiana State Univ, Baton
Rouge. Zn to rice seeds has potential for substantial cost savings
Slaton, N.A., C.E. Wilson Jr., B.R. Wells, R.J. Norman, and R.S. to producers when compared with conventional
broad-Helms. 1995. Evaluation of zinc deficiency of rice produced on cast soil or foliar Zn fertilization methods. Additional alkaline soils. p. 32–35.InW.E. Sabbe (ed.) Arkansas soil fertility research studies are needed to develop recommenda- studies 1994. Arkansas Agric. Exp. Stn. Res. Ser. 443.
possi-Soltanpour, P.N., G.W. Johnson, S.M. Workman, J. B. Jones Jr., and Wells, B.R. 1980. Zinc nutrition of rice growing on Arkansas soils. R.O. Miller. 1996. Inductively coupled plasma emission spectrome- Ark. Agric. Exp. Stn Bull. 848. Univ. of Arkansas, Fayetteville, AR. try and inductively coupled plasma-mass-spectroscopy. p. 91–140. Yilmaz, A., H. Ekiz, B. Torun, I. Gultekin, S. Karanlik, S.A. Bagci, InD.L. Sparks (ed.) Methods of soil analysis: III. SSSA Book Ser. and I. Cakmak. 1997. Effect of different zinc application methods 5. SSSA, Madison, WI. on grain yield and zinc concentration in wheat cultivars grown on Thompson, L.F., and N.R. Kasireddy. 1975. Zinc fertilization of rice zinc-deficient calcareous soils. J. Plant Nutr. 20:461–471.
by seed coating. Rice J. 78:28–29.
Nitrogen Fertilization of No-Till Cotton on Loess-Derived Soils
Donald D. Howard,* C. Owen Gwathmey, Michael E. Essington, Roland K. Roberts, and Mike D. Mullen
ABSTRACT mature senescence and reduced yields (McConnell et
al., 1995). Information on nitrogen (N) fertilization of no-till (NT) cotton
Research conducted within the mid-South shows that (Gossypium hirsutumL.) is needed to optimize lint yields and
earli-the optimum N rate for cotton production varies with ness. We evaluated five N rates and three application methods for
NT cotton production on Loring silt loam (fine-silty, mixed, active, location, soil type, tillage system, winter cover, and ap-thermic Oxyaquic Fragiudalfs) with natural winter annuals as a cover; plication method. On conventionally tilled (CT) Dun-and on Memphis silt loam (fine-silty, mixed, active, thermic Typic dee very fine sandy loam (fine-silty, mixed, active, ther-Hapludalfs) having corn (Zea mays L.) stover as a cover and on mic Typic Endoaqualfs), Ebelhar and Welch (1996) Lexington silt loam (fine-silty, mixed, active, thermic Utlic Hapludalfs) reported optimum yields from banding 50% of the N having winter wheat (Triticum aestivumL.) as a cover. Nitrogen rates
at planting followed by banding 50% at pinhead square. of 0, 34, 67, 101, and 134 kg ha21were either broadcasted as
ammon-Their evaluation included N rates (67–168 kg ha21) and
ium nitrate (AN) or injected as urea–ammonium nitrate (UAN) at
application timing (at planting and three splits) from planting. Additional treatments included broadcasting 67 kg N ha21
which they concluded that the 50–50 split application as AN at planting with either 34 or 67 kg N ha21banded 6 wk later.
of 101 kg N ha21 resulted in the highest yields. In an
Relative to no N, broadcasting 67 kg N ha21as AN increased 4-yr
average NT lint yields on Loring silt loam from 739 to 1281 kg lint additional study, Ebelhar et al. (1996) showed that in-ha21and 2-yr average yields on Lexington silt loam from 1086 to 1535 jecting a 50–50 split (at planting and pinhead) at a higher
kg ha21. A higher N rate (101 kg N ha21) was needed to increase
2-rate (134 kg N ha21) resulted in maximum cotton yields
yr average yields on Memphis silt loam from 821 to 1169 kg ha21.
on CT Bosket very fine sandy loam (fine-silty, mixed, Broadcasting AN was a satisfactory placement method producing active, thermic Typic Hapludalfs) and Dubbs silt loam yields equal to or higher than injecting UAN or splitting AN for
(fine-silty, mixed, active, thermic Typic Hapludalfs). In NT cotton produced on these loessial soils despite different covers
Mississippi, Thompson and Varco (1996) reported that and residues.
broadcasting 121 kg N ha21as ammonium nitrate (AN)
and injecting 110 kg N ha21as urea–ammonium nitrate
(UAN) produced maximum NT cotton yields on
Mari-N
itrogen(N) fertilization affects yield, maturity, andetta fine sandy loam (fine-loamy, siliceous, active, ther-lint quality of cotton. Evaluating N rates, sources,
mic Fluvaquentic Eutrudepts). Hutchinson et al. (1995) and application timing for optimum lint production has
reported the need for a higher N rate for both CT and been a major research emphasis within the cotton
pro-NT cotton production on Gigger silt loam (fine-silty, ducing states. For cotton, applying an optimum N rate
mixed, active, thermic Typic Fragiudalfs) having a win-is essential and may differ within the production areas
ter wheat cover. Their research indicated that NT yields due to climatic or soil differences. An optimum N rate
were increased with injected N up to 78 kg ha21when
should maximize yields, while excessive or inadequate
native winter vegetation was the cover, while yields were N applications may reduce cotton yields (Maples and
increased with N rates up to 118 kg ha21 with winter
Keogh, 1971). High N fertilization may produce
exces-wheat. sive vegetation that delays maturity and harvest, and
In Tennessee, cotton yields were maximized at lower these conditions may reduce yields and lint quality
dur-N rates than were reported for surrounding states. Yield ing years of early frost or prolonged fall rain
(Hutchin-response to N fertilization by CT cotton on well-drained son et al., 1995; McConnell et al., 1995). Crop maturity is
loessial upland soils ranged from 34 kg N ha21(Overton
a critical production consideration for cotton producers
and Long, 1969) to 67 kg N ha21 (Howard and
Hos-along the northern edge of the U.S. Cotton Belt
(Gwath-kinson, 1986). From a review of Tennessee research, mey and Howard, 1998). Nitrogen deficiency causes
pre-Howard and Hoskinson (1990) reported that CT cotton yield responses to N fertilization varied with soil and physiographic position. The current N recommendation D.D. Howard and C.O. Gwathmey, Plant and Soil Sciences Dep.,
Univ. of Tennessee, West Tennessee Exp. Stn., Jackson, TN 38301; for Tennessee cotton production, regardless of tillage, M.E. Essington and M.D. Mullen, Plant and Soil Sciences Dep., Univ. is to apply 34 to 67 kg N ha21 to alluvial soils and 67
of Tennessee, P.O. Box 1071, Knoxville, TN 37901-1071; and R.K. to 90 kg N ha21 for upland soils (Univ. of Tennessee,
Roberts, Agric. Economics and Rural Sociology Dep., Univ. of
Ten-2000). These ranges allow the producer to select an nessee, P.O. Box 1071, Knoxville, TN 37901-1071. Received 26 Jan.
2000. *Corresponding author ([email protected]).