www.elsevier.comrlocateranireprosci
The use of databases to manage fertility
R.J. Esslemont
), M.A. Kossaibati
DAISY Research, Department of Agriculture, UniÕersity of Reading, Reading RG6 6AT, UK
Abstract
Dairy farming now needs more records to be kept for quality assurance as well as for management. Herd fertility management is best brought about through the use of computerised records for each animal that integrate fertility, health and production. The development of dairy information systems over the last 25 years has allowed the creation of databases that give rise to ‘‘standards’’ of performance and ‘‘interference levels’’. These databases are of limited use for research unless the coding system has a structure and definition that works across herds. There is an increasing need to incorporate carefully coded disease records into these databases as there is increasing concern about welfare, zoonoses, assurance and the environment. Rules can be determined for satisfactory fertility so interference at an early stage is cost-effective. Integrated
Ž .
indices have been developed using databases that incorporate the costs of wastage caused by poor fertility, thus highlighting the priorities for management. Databases are best operated near to the farm, either in the veterinarian’s office or on-line in the farm office. Databases can be made into expert systems that deliver high standards of fertility management. A checklist is included that can be followed to analyse the causes of poor fertility in a dairy herd. q2000 Elsevier
Science B.V. All rights reserved.
Keywords: Fertility management; Dairy information systems; Databases
1. Introduction
Dairy farming is under increasing pressure and there are many new factors affecting the recording of data about herds and individual animals. At the same time as having to cope with reduced commodity prices, the whole milk production process is now heavily inspected in order to be ‘‘assured’’. The milk buyers now demand higher standards of animal welfare and systems of husbandry that are acceptable. For this reason, if no other, farmers ignore the need for good fertility recording at their peril. Records are
)Corresponding author. Tel.:q44-118-9318485.
Ž .
E-mail address: [email protected] R.J. Esslemont .
0378-4320r00r$ - see front matterq2000 Elsevier Science B.V. All rights reserved.
Ž .
( ) R.J. Esslemont, M.A. KossaibatirAnimal Reproduction Science 60–61 2000 725–741
726
needed in any case to bring about adequate reproductive performance in the modern dairy herd. Reproduction directly affects milk yield per day of production and per day of life. It also affects other economically important aspects of the dairy herd, such as genetic progress and culling policy. Poor fertility leads to high culling rates. This means the herd has a higher herd depreciation cost and a slower rate of achievement of breeding goals. Diseases often cause poor fertility so they should be fully recorded. Culling strategy is determined by the success of heifer rearing. The management of fixed resources, such as machinery, labour and finance, is as important to profit as feeding, health and fertility. Recording schemes for dairy cattle should now embrace all aspects of production.
2. Fertility assessment
The approach to fertility assessment, based on adequate records, is comprised of the following steps:
Ž .
1. Confirm an existing problem i.e. measure and evaluate . Measure the rate or occurrence and compare it with standards, or ‘‘benchmarks’’, for this herd, or for a group of similar herds.
Ž .
2. Define as clearly as possible what the problem is i.e. diagnose . Be as clear and precise as possible, defining the problem, the disease, the class of stock affected, over the period of the year.
Ž .
3. Search for epidemiological relationships i.e. more diagnosis . Establish which group of animals is affected; carry out surveys and tests. Assess the effect of management, season, bull, feeding group, time, place, yield, age, and diseases. Be aware of the need for reasonable numbers in each dataset.
4. Define the terms used and describe the population used to measure the parameters. Be careful to be consistent with numerators and denominators. Bring some statistical principles into use so the conclusions are reasonably valid and safe.
5. Define action plans and priorities.
6. Set in train action, a series of monitoring and review meetings. Make the changes to
Ž
management and monitor the effects use pictorial information, graphs, and
cumula-Ž . .
tive sum QSum charts, incorporating colour .
3. Dairy herd fertility and the use of databases
Dairy herd fertility is comprised of the performance of individual animals and should start with the dairy heifer. Commonly, natural service is used in heifer breeding and this
Ž .
means that, unless proper recording of oestrus or heat takes place, service dates are not known. This makes calving management more difficult. There is a worrying level of loss
Ž .
in the heifer-rearing process Kossaibati and Esslemont, 1997a with about 35% of potential replacement animals lost, mainly due to mismanagement by the end of the first
Ž .
Table 1
Number of heifer-rearing units 26 6 7 7 6
( )
Wastage % of total heifers born in 1991r1992
Ž .a Calf mortality 8.8 4.3 7.7 10.2 12.9
Ž .b Heifers soldrdied before first calving 13.0 5.5 9.6 16.2 25.8
Ž .c Heifers culled in their first lactation 13.8 6.8 9.0 14.8 21.2
Ž .
Heifers failed to calve for a second time aqbqc 35.6 16.6 26.3 41.2 59.9
The collection of data has allowed the definition of benchmarks, standards, interfer-ence levels and targets. The success of the leader farmers has been studied and the crucial indices for high achievements in fertility have been identified. This gives advisers confidence in predicting outcomes arising from under-performance in the
Ž .
determining factors Schutte et al., 1992 . In the UK data from National Milk Records
ŽNMR shows that, after calving, a voluntary waiting period VWP of some 65 days is. Ž . Ž
normally given to a cow before inseminations begin Bryan 1999, personal
communica-.
tion . This period is excessive and a shorter interval would be more profitable. The cow
Ž .
needs detecting and recording in heat and inseminating on average at less than 70 days. The cow should take about 85 days to conception at the start of the lactation if she is to calve annually. Thus, a herd average calving interval of about 365 days is the target. In fact, a range of calving intervals within a herd for individual animals from about 320 days to about 400 days is the target. The costs of delay and the consequences of extra
Ž .
culling have been defined Esslemont et al., 1999 .
The signs of oestrus that the farmer notices to determine when to submit the cow for
Ž .
artificial insemination AI should all be systematically recorded. The details of the timing of insemination, which is critical to success, should also be recorded as well as the identity of the inseminator. There are also many stages in the process of collection, processing, storage and delivery of semen where mistakes and inefficiency can occur. One of the crucial areas is in the storage of semen in on-farm flasks. Mismanagement is common and semen is often killed before being used by the inseminator. The
manage-Ž .
ment of the storage flask should be recorded on the farm database see Appendix A . Even after 60 years of AI in the UK, it is still not possible for a farmer to know about the fertility of an individual bull’s semen when used in a cattle population. The figures for pregnancy rates should be made available. The range in pregnancy rates between bulls is thought to be at least 20 percentage points. This means that the best bulls have pregnancy rates of about 55% to 60% and the worst around 35% to 40%. This is another case for integration of recording systems.
Ž . Ž
Oestrus detection requires the stockman to see and record the behavioural signs of
.
which the crucial ones only last some 8 to 12 h . Because of the way farms are managed and because of the patterns of oestrus behaviour in dairy cows, the average heat
Ž .
()
Fertility management assessmentagrading Aqto D
Herd performance assessment Targets Slight problem Moderate Severe problem
Ž . Ž . Ž .
Herd fertility grading Excellent Aq Adequate A Interference level B C D
Fertility parameters
Percent served of calved )94 90–93 87–89 84–86 -83
Ž .
Calving to 1st service interval days 55–64 65–69 70–74 75–82 )82
Ž .
First service 24 day submission rate % )69 59–68 48–58 33–47 -32
Ž .
Returns to service heat detection rate % )68 59–68 53–58 40–52 -39
Ž .
First service pregnancy rate % )58 52–57 47–51 42–46 -41
Ž .
All services pregnancy rate % )58 52–57 47–51 42–46 -41
Ž .
Fertility Factor % )40 32–39 28–31 21–27 -21
Percent pregnant of served )96 92–95 89–91 85–88 -84
Percent pregnant of calved )88 82–87 79–81 74–78 -73
Ž .
Calving to conception interval day 70–86 87–93 94–101 102–113 )113
Ž .
Calving interval days 350–369 370–376 377–382 383–395 )395
Days open 86–109 110–120 121–133 134–154 )154
Ž . Ž .
Failure to conceive FTC culling rate % 4–7 8–10 11–14 15–16 )16
Ž .
All other culling rate % -10 11–12 13–14 15–16 )16
Ž .
Total culling rate % 12–16 17–20 21–23 24–30 )31
Ž .
Calving interval adjusted calving rate % )84 80–83 76–79 71–75 -70
bŽ .
FERTEX £r100 cows up to 1500 2600–6300 7400–8800 12,700–17,500 )17,500
Ž .
Other Culling Losses £r100 cows -800 1600–2400 3200–3900 4700–5500 )5500
cŽ .d
TC-FERTEX £r100 cows -2300 4200–8700 10,600–12,700 17,400–23,000 )23,000
e
Ž£r100 cows. )y400 -1200 1700–4600 5100–9300 )9300
fŽ .
Herd HPI Score £r100 cows up to 1900 5400–9900 12,300–17,300 22,500–32,300 )32,300
a Ž .
DAISY Report No. 4 page 137 . b
FERTEXsFertility economic score. c
TC-FERTEXsFERTEX scoreqcost of non-fertility culling.
d Ž .
HEALEXsHealth economic score dealing with costs of production diseases . e
Negative sign indicates a gain.
f Ž .
standards of performance in terms of heat detection and pregnancy rate. It is often more effective to use some objective means of measuring cyclicity such as with milk progesterone monitoring to detect the status of the cow rather than rely on the detection by an overworked stockman, of some short-lived behavioural signs. An expert system based on the use of cheap milk progesterone tests linked with the cow’s fertility data on
Ž .
the DAISY The Dairy Information System database has been very successful as a
Ž
means of raising heat detection rates in large, high yielding herds Williams and
.
Esslemont, 1993 . Using this system, the interval to first service is under the control of
Ž
the farmer, the treatments for ‘‘problem’’ cows a phenomenon that declines in herds
.
using this approach are more precise and accurate. The effect in herds where the system
Ž
has been painstakingly applied has been to deliver model fertility performance see
.
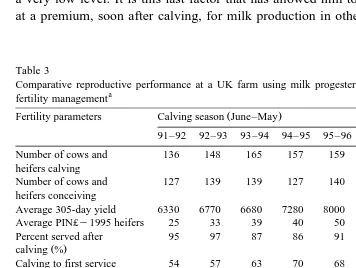
Table 3 . The farmer whose herd performance is summarised in Table 3 has been able to increase his profits by expanding the herd, raising yields and cutting infertility culling to a very low level. It is this last factor that has allowed him to sell high-yielding animals
Ž .
at a premium, soon after calving, for milk production in other herds Glover, 1997 .
Table 3
Comparative reproductive performance at a UK farm using milk progesterone testing as an integral part of fertility managementa
b
Ž .
Fertility parameters Calving season June–May DAISY survey
91–92 92–93 93–94 94–95 95–96 96–97 Average Top 10%
Number of cows and 136 148 165 157 159 183
heifers calving
Number of cows and 127 139 139 127 140 160
heifers conceiving
Average 305-day yield 6330 6770 6680 7280 8000 8100
Average PIN£y1995 heifers 25 33 39 40 50 60
Percent served after 95 97 87 86 91 89 91 90
Ž .
calving %
Calving to first service 54 57 63 70 68 63 69 65
Ž .
interval days
Calving to conception 81 86 79 87 96 94 100 89
Ž .
Overall pregnancy rate % 40 51 50 53 49 43 46 51
Number of services 2.5 2 1.9 1.9 2 2.2 2.1 1.9
per pregnancy
Ž .
Calving interval days 365 364 365 369 375 373 380 369
Ž .
Percent of animals culled % 8 10.5 20 21 14 14 22 18
Percent of animals culled 2.3 3.7 4.1 5.9 3.4 2.4 10 6
Ž .
DAISY Report No. 4 1995 , Averagesaverage of 91 herds; Top 10%s top 10% based on the x
( ) R.J. Esslemont, M.A. KossaibatirAnimal Reproduction Science 60–61 2000 725–741
730
The loss from poor fertility is made up of reduced annual milk yield, lower calf output and increased costs of keeping the cow dry for longer. Other costs include the effect of the slip in the calving pattern, the costs of extra AI and of veterinary attention.
Ž .
In addition, culling for failure to conceive FTC is very expensive. The national rate of wastage of this type is some 14% of the herd while the target is less than 7%. Total
Ž
culling rate is, at present, as high as 30% while the target is about 16 to 18% Kossaibati
.
and Esslemont, 1995; Bryan, 1999, personal communication .
Ž .
Pregnancy diagnosis PD is cost effective where non-pregnancy is quickly identified, but positive PDs should not be relied on until about 50 days post-service. PD, via chemical tests, scanners and rectal palpation should be used in succession
ŽBoneschanscher et al., 1982; Esslemont, 1995 . It is early knowledge of the animals.
that are NOT pregnant that helps the farmer return animals to a further insemination as quickly as possible. Compared with no PD at all, routine use of milk progesterone tests at 19 and 24 days, plus the application of Kamars on the cows that are PD negative and the use of rectal palpation at 50 days, improve margins by some £30 per cow on the
Ž .
average farm Esslemont, 1995 . Inaccurate PDs at 50 days cause a net loss, due to inappropriate use of prostaglandin. Farmers are advised to choose their veterinary surgeon and their PD regime very carefully.
Cows with peri-natal diseases or which are not seen in heat by 40 days after calving should be put before the veterinarian. He can inspect the animal’s breeding tract and
Ž .
give the appropriate treatments Esslemont and Kossaibati, 1996 . There are some 30% of the herd that suffer diseases that affect fertility. These animals should be put into ‘‘intensive care’’. The remainder of the herd normally has high rates of fertility. The peri-natal risk factors for fertility are: abortion, birth of a dead calf, production of twins,
Ž
retained afterbirth, endometritis, vulval discharge, milk fever, and lameness Peeler et
.
al., 1994 .
Ž
Cows with high yield broadly, heifers over 28 litres, second lactation animals over
.
33 litres and mature cows over 38 litres often have difficulties in getting in calf. Cows that calve in poor condition or that do not stop losing condition are also at risk of poor
Ž .
fertility Webb et al., 1999 . The other risk factors are month of calving and age. Animals calving early in the season can reach the culling decision time without sufficient oestrus cycles to get in calf, and animals calving in the last 2 months of a calving season usually have too little time to get in calf before the serving season ends. Cows have poorer fertility once they reach their seventh lactation. This may be as much a function of increased ill health, or poor condition, as age itself. All these risk factors can be incorporated into a recording scheme that flags up the cows at risk so that the necessary preventive ‘‘intensive care’’ can be delivered. Action lists that mention these diseases and that show ‘‘Revisit’’ cows until they are ‘‘Signed off’’ by the vet are useful ways of dealing with these animals.
Ž . Ž .
Clearly, with such low average rates of heat detection 55% and pregnancy 46% on the typical farm, it can take some time to get individual cows in calf and many animals need veterinary attention, only because they are not seen in oestrus. If the heat detection rate is 50% and if the pregnancy rate is also 50%, this amounts to Reproductive
Ž . Ž .
Ž .
average, from calving assuming that the average VWP is 65 days to get 86% of the cows pregnant. The FF and also the number of oestrus cycles that are allowed before the
Ž .
inseminations are stopped, affect FTC culling rate Esslemont, 1993b . Full records are needed of all culling, including all the reasons why the cows are sold.
On average, in the UK the interval to first service is 83 days. By simply dropping the
Ž .
VWP to 50 days from 65 days , the calving to conception will be cut by 20 days to 100 days and the FTC culling rate will be reduced from 14% to 10% and the herd’s
Ž
profitability would rise significantly an estimated figure of £6232 per 100 cows, using
. Ž .
FERTEX — the Fertility Economic Score Esslemont, 1992a, Esslemont, 1993b . Cows sold for FTC are often called ‘‘barreners’’, but in fact they are usually perfectly fit animals. These cows are often cycling normally, but have not been seen in heat enough times in the available window, and have been unfortunate with the process of insemination. These cows are generally sold for FTC and are expensive in terms of lost profit as they need replacing with home reared or bought-in heifers.
The aim of a well-managed herd is to have a heat detection rate of at least 70% and a pregnancy rate of 50% to 60%. This means that, instead of the average rate of 25% of
Ž .
the eligible cattle getting in calf every 21 days 50% of 50% , the well-managed herd
Ž .
achieves RE of 35% 70% of 50% or even 40%. This is the target FF of a herd. With a FF of 35%, the calving to conception interval is kept below 95 days, which is tolerable, and the FTC culling rate is kept below 7%.
By studying the achievements of the more successful herds on the DAISY database, it is known that to achieve these aims one needs to do all of the following tasks:
Ø serve 95% of the herd after calving;
Ø keep the average calving to first service interval to less than 70 days;
Ø achieve an overall heat detection rate of more than 55%;
Ø achieve a pregnancy rate of 50% or more.
Individually, these are not high standards, but good fertility management depends on achieving all these targets together.
Good recording of heats and services, along with pregnancy diagnoses, allows the farmer and his adviser to work out these crucial indices as the season progresses and to, if necessary, take the action in time to bring the herd performance back into line. High rates of fertility management allow the farmer to cull animals for more sensible reasons, such as old age, low yield and disease. A farm with poor fertility and limited numbers of
Ž .
heifers as is normally the case often has to keep a high level of cows with chronic mastitis, as the farmer does not have the scope to cull these diseased animals. So poor fertility management has a very high opportunity cost. Not only is a lot of unnecessary expense poured into the treatment of healthy animals, but also a great deal of money is wasted by selling FTC culls of high genetic and other potential.
Ž .
The FERTEX Score Esslemont, 1992a,b takes into account calving interval, FTC
Ž .
( ) R.J. Esslemont, M.A. KossaibatirAnimal Reproduction Science 60–61 2000 725–741
732 Table 4
Example of FERTEX calculationa
b Ž . Ž .
FERTEX components Actual herd Target Difference Cost £ Total Cost £
Ž .
performance per unit cost £ per 100
cows
Ž .
Calving interval days 380 368 12 3 36 3600
Number of services 2.2 1.8 0.4 20 8 800
per pregnancy
Failure to conceive 11 5.3 5.7 770 4389 4389
Ž .
culling rate %
Ž .
FERTEX £r100 cows 8789
Ž .
Cost per cow in the herd £ 8
a Ž .
DAISY Report No. 4 page 29 . b
In this example, target value for each parameter derived from average performance of top 25% of the herds in DAISY study.
Ž . Ž .
Calving Interval Adjusted Calving Rate CIACR Esslemont, 1992a and Adjusted
Ž . Ž .
Calving Interval ACI Plaizier et al., 1997 . It is possible to estimate outcomes and to model the results in advance using simple formulae in computerised recording schemes. This means that the indices can be calculated up to date. A step by step approach to
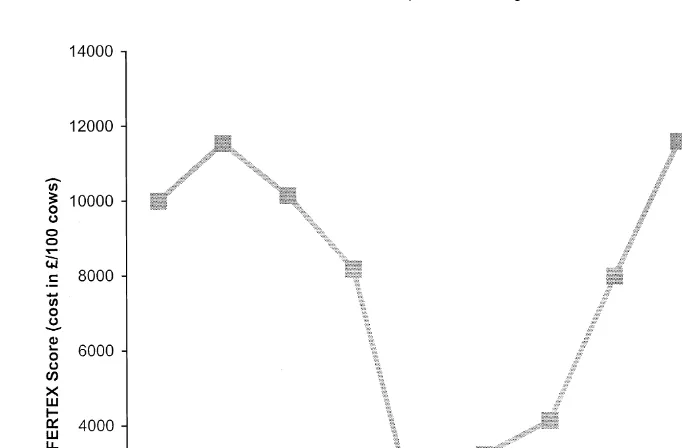
Ž
Fig. 1. Rolling 12 months calving to conveption interval and FTC culling rate Data for one herd — 1985 to
.
Ž .
Fig. 2. Rolling 12 months FERTEX Score for one herd 1985 to 1998 .
analysis and reporting may help to highlight the weak areas and possible causes of any
Ž .
problem see Appendix A .
Apart from the reports produced by computers, it is important to have someone go through the figures on a regular basis and to digest the findings, producing a report for
Ž .
the farmer. This may mean producing league tables benchmarks of the key
perfor-Ž
mance indicators for a group of herds, as well as graphs for the particular farm see Fig.
. Ž .
1 . Some of these reports can show the financial effects via FERTEX of the efforts to
Ž .
improve health and fertility over the years see Fig. 2 .
4. Use of computerised recording systems
Today, computer systems are more widely used to assist the management of the herd, whether they are centrally based milk recording schemes or based on on-farm personal computers. Management in these terms needs analytical programs as well as action lists. Databases are collections of individual cow records for an individual herd over time as well as amalgamations of data from many herds. The fertility data and indices used in these various programs differ widely and, unfortunately, there is often no definition of the indices used. Some attempt has been made in the literature to define these terms but
Ž .
software producers are not reading academic journals Fetrow et al., 1990 . Many of the indices used are, in fact, inaccurate and misleading, making them potentially dangerous
Ž .
( ) R.J. Esslemont, M.A. KossaibatirAnimal Reproduction Science 60–61 2000 725–741
734
involved and what factors are implicated in any problem. Expert systems have been
Ž .
suggested as a further aid to the use of the essential reports Domecq et al., 1991 .
5. New problems
There are a number of new problems facing the dairy industry, such as those mentioned in the following sections;
5.1. Extra justification of recording
There is now an increasing awareness, not least amongst milk buyers, of the large amount of production ‘‘diseases’’, poor welfare and wastage in dairy herds. Many of these diseases affect the fertility of the cows as well as the economic efficiency. Some of them are zoonoses. The worst of the management problems include dystocia, calf mortality, milk fever, endometritis, lameness and mastitis. Indeed, higher yielding and higher genetic merit cows are more likely to suffer from these and a number of other diseases. They also have more twins, which shortens their lives. Only by having fertility management under control can a farmer cull cows with disease in an economically efficient way. There is a limit to the total culling rate often set by the numbers of heifers in the pipeline, and poor fertility management in this regard reduces the scope
ŽEsslemont, 1992a; Esslemont, 1993b; Esslemont and Kossaibati, 1997; Esslemont and .
Peeler, 1993 .
5.2. Heritability
The lack of development of a suitable large-scale national dairy farm recording system, has resulted in very limited data on the heritability of fertility and disease in cows. There are indications that there is a virtue in breeding for improved yield and
Ž .
fertility and resistance to disease Solbu and Lie, 1990; Forshell et al., 1995 . A great
Ž
deal of effort and attention has been placed on the type of animal produced in terms of
.
shape in pedigree and other herds and much of this effort is wasted in its effect on
Ž .
economic efficiency in the commercial herd Langhill Report, 1998 . Condition and locomotion scores should be incorporated into indices for sires as both have effects on fertility. Post-mortem and other material sent into veterinary investigation laboratories should be on the same database. Findings from abattoirs should also be added.
5.3. Quality assurance schemes
There will be an increasing scrutiny of dairy farming for all types of disease and mismanagement. Indeed, there is now in the UK and elsewhere, national schemes to assure the quality of milk production, which incorporate validated inspection of dairy farms for all types of management. The UK dairy industry, which has fought shy of information on fertility and health for 30 years, now suddenly needs to have schemes and services that deliver valid material on these topics. Standards and benchmarks are
Ž .
5.4. Zoonotic diseases
There are also increasingly important infectious diseases that are endemic in the national herd that also affect fertility. These include Leptospirosis, Johne’s Disease, BVD and Neospora. Some of these have zoonotic implications as well. Cattle passports are now mandatory, as is the recording of the use of pharmaceutical products. Records of the cow’s health and fertility mean that the necessary inspections and cross-checks can be carried out. Some buyers have even specified the detailed records and reports on performance in terms of fertility and health that they must have analysed.
5.5. MoÕement records
There are further demands on recording systems today. Movement records have now become essential. Complex national animal identification and cattle movement recording services have been installed in the wake of the BSE crisis. These should be incorporated in a national integrated database. Unfortunately, they are not.
6. Disease recording — development of herd health schemes
Ž .
There is also an interest in good recording linked to herd heath schemes HHS , where veterinarians carry out scheduled herd visits and help to raise the standards of fertility management. These schemes are underpinned by the use of computerised records with regular feedback of information delivered by the practitioner. The aim of HHS is to produce optimum animal health and production. This implies that sufficiently
Ž
good standards of fertility are reached and perfection is not the target Blood et al.,
.
1978 . HHS and preventive medicine routines have been shown to be highly cost
Ž
effective when carried out properly. A three to one return is found £60 per cow extra
. Ž .
income vs. £20 extra costs Wassell and Esslemont, 1992 . The quality of the advice is important in preventive medicine, which remains a problem of attitude. To make the detailed recommendations about the herd’s health and fertility the veterinarian, or any
Ž
other adviser, now needs more data not only on all aspects of fertility the traditional
.
starting point of a herd health scheme but also on production and other diseases.
6.1. Recording of subclinical disease
Subclinical disease is recognised today as one of the most important contributors to reduced animal efficiency. One of the best ways of spotting such an underlying problem may be by noticing reduced output in terms of milk, its quality, low rates of fertility or poor growth and body condition. There is a great need for the appropriate data if these conditions are to be spotted and dealt with in their early stages.
6.2. Recording of infectious diseases
( ) R.J. Esslemont, M.A. KossaibatirAnimal Reproduction Science 60–61 2000 725–741
736
They are not receiving much attention in terms of eradication nor vaccination at present. These diseases include Leptospirosis, BVD, TB, IBR and Leucosis. Abortion is a problem in dairy cows and while Brucella is under control in many countries, there is a major problem looming with Neospora. Salmonella and Escherichia coli are ever present on dairy farms and they are the sources of health problems for those working with animals. Details of the results from blood and other tests on the individual animals and the herd should be stored on the recording system.
7. Development of an integrated database — type of recording systems
Ž
In the UK, despite the creation of research-based model systems based on the
.
examples of the Scandinavian countries in the early 1970s that showed the way via
Ž . Ž .
pioneering users Melbread, DAISY Esslemont 1993a , in the last 20 years few national schemes for detailed animal fertility and disease recording have arisen. Farms today need quick turn round of analysis of their records with a same day service for
Ž .
‘‘Action Lists’’. They need at least a weekly service certainly on large farms to help to keep up with the changing circumstances of individual cows. The action lists should cover categories such as: Cows Not Served, Cows for PD, Cows PD Negative and Not
Ž
Reserved, Cows to Dry Off, Cows to Calve, Cows for the Vet to See about 20
.
categories including Cows for Revisit . In many countries, the co-operative nature of farming and research has delivered database systems of benefits to all parties. The central database is available for research and the individual farmers benefit from the powerful use of the aggregated material. Today’s technology allows the data to be delivered over the Internet, but even the older schemes can make a further contribution to research when extra resources are available for the construction of large, aggregated databases.
8. Conclusions
records. Standards or benchmarks need defining. All the data needs to be integrated in one system. Improved agricultural and veterinary education is essential to managing databases in the future.
Appendix A. Check list to manage fertility in dairy herds
A.1. Fertility parameters
Ž
Ø Analyse herd fertility parameters if the main parameters i.e. pregnancy rate, calving
. Ž .
interval and FTC culling rate have a Grade B or worse see Table 2
A.1.1. Percent serÕed of calÕed
Ø Check all healthrdisease that affects culling rate.
Ø Check calving pattern.
Ø Check: does rule vary for voluntary waiting period?
Ø Check heat detection.
Ø Check all causes of anoestrus, oestrus-not-observed. This needs objective measures such as: score of ovarian structures, scanner, milk and progesterone levels.
A.1.2. CalÕing to first serÕice interÕal
Ø Cows served at less than 40 days — too early
Ø Spread
A.1.3. Cows serÕed after 100 days — too late, check reasons: health, yield ?
Ž .
Pregnancy rate need at least 20 services per bull
Ø Use tables, bar charts and QSums for the following data: MonthrWeek of services
Daily variation via QSum Bull
Day of week
Number served on same day
Ø Check the following: Inseminator Thawing technique Insemination technique
Timing of interval from heat detection to insemination
( ) R.J. Esslemont, M.A. KossaibatirAnimal Reproduction Science 60–61 2000 725–741
738
Feeding groups
Ž .
Stress change of group and turnout date Condition score and change
Main events: Christmas and New Year
Ø Check possible reasons for low pregnancy rate, such as: poor feeding, sloppy heat detection, sloppy inseminator technique, changes of weather, feed and housing.
A.2. Disease
Ø Prevalence and incidence of lameness, mastitis, vulval discharge, endometritis, dead calves, twins, difficult calving, retained afterbirth.
Ø Pregnancy rate for animals affected with these difficultiesrdiseases.
A.3. Yield leÕel
Ø Use bar chart and tables to show yield by lactation number, stage of lactation, animals, absolute yields, maturerheifer equivalent yield.
A.4. Genetic indices
Ž .
Ø PINr£PLI check if high index sire
A.5. Condition score
Ø Check condition score at 50 and 20 days before calving.
Ø Check condition score change between calving and 50 days into lactation and at serving.
( )
A.6. Heat detection use bar charts and QSums
Ø First service 24-day submission rate
Ø Returns heat detection rate
Ø Interval from heat to insemination
Ø Rate in a 24-day period
Ø Efficiency
Ø Proportion served when not in heat
Ø Short cycles: proportions 0 to 5 days, 5 to 12 days, 12 to 17 days.
Ø Long cycles: 24 to 29, 30 to 36, 37 to 46 days.
Ø Check routines used and who saw cow in heat
Ž .
Ø Season rate and efficiency varies during season
Ž .
Ø Day of week busy days, e.g. vet day, Fridays, weekends, silage making, etc.
A.7. Milk progesterone test
Ø Result: high, medium, low
A.8. PD negatiÕe rate
Ž .
Ø By PD method chemical, scanner, manual palpation and days post-service
A.9. Examining the problems found at routine examinations, e.g.:
Ø Post-natal examination
Ø Pre-breeding examination, oestrus-not-observed
Ž
Ø Analysis of findings e.g. vulval discharge, pyometra, endometritis, bacterial status of
.
tract
Ø Diagnoses and treatments
Ž .
Ø Cyclicity and acyclicity status of Corpus Luteum and Follicles
Ø Rate, results and use of Prostaglandin, PRID, GnRH, Metrijet, etc.
A.10. Abortion rate
Ø Incidence by month and stage of pregnancy
Ø Diagnosis of cause of problem
A.11. Low pregnancy rate
Ø Check embryo loss by stage and cause
Ø Check early foetal loss by stage and cause
Ø Poor heat detection
Ž .
( ) R.J. Esslemont, M.A. KossaibatirAnimal Reproduction Science 60–61 2000 725–741
740
( )
A.12. Failure to conceiÕe leÕels percentage of those serÕed
Ø Expected level in relation to the FF and above findings, by month of calving and lactation number
A.13. Culling
Ž .
Ø Culling rate percentage of calved by lactation number and month of calving
Ž .
Ø Culling by reason including multiple reasons , e.g. poor fertility after multiple services, mastitis, lameness, low yield, slip in calving date, age, infectious disease, other diseases, and management policy
A.14. Replacement heifers
Ø Herd replacement rate
Ø Check wastage in all stages of the heifer rearing process, i.e. late pregnancy of dam, at birth, first week, weaning, weaning to 3 months, 3 to 6 months, 6 months to serving, serving period and serving to calving
Ø Replacement policy
Ø Diseaserinjuries in youngstock
Ø Feeding
Ø Fertility performance
References
BCVA, 1999. Herd Health Plan. Publication of British Cattle Veterinary Association. Frampton on Severn, Gloucestershire, UK.
Blood, D.C., Morris, R.S., Williamson, N.B., Cannon, C.M., Cannon, R.M., 1978. A health program for commercial dairy herds. Parts 1 to 5. Aust. Vet. J. 54, 207–257.
Boneschanscher, J., James, A.D., Stephens, A.J., Esslemont, R.J., 1982. The costs and benefits of pregnancy diagnosis in dairy cows — a simulation model. Agric. Syst. 9, 29–34.
Domecq, J.J., Nebel, J., McGilliard, M.L., Pasquino, A.T., 1991. Expert system for evaluation of reproductive
Ž .
performance. J. Dairy Sci. 74 10 , 3446–3553.
Esslemont, R.J., 1992a. Measuring dairy herd fertility. Vet. Rec. 131, 209–212.
Esslemont, R.J., 1992b. An index of dairy herd fertility: a new measure of herd performance in dairy farming. J. Farm Manage. 8, 33–36.
Esslemont, R.J., 1993b. Relationship between herd calving to conception interval and culling rate for failure to conceive. Vet. Rec. 133, 163–164.
Ž .
Esslemont, R.J., 1995. Economic appraisal of herd health schemes. In: Raw, M.E., Parkinson, T.J. Eds. , Vet. Ann. 35 Blackwell, pp. 243–280.
Esslemont, R.J., Kossaibati, M.A., 1996. Incidence of production diseases and other health problems in a group of dairy herds in England. Vet. Rec. 139, 486–490.
Esslemont, R.J., Kossaibati, M.A., 1997. Culling in 50 dairy herds in England. Vet. Rec. 140, 36–39. Esslemont, R.J., Peeler, E.J., 1993. The scope for raising margins in dairy herds by improving fertility and
health. Br. Vet. J. 149, 537–547.
Esslemont, R.J., Kossaibati, M.A., Allcock, J., 1999. Economics of fertility in dairy cows. Paper to the
Ž .
conference of British Society of Animal Science BSAS on ‘‘Fertility in The High Producing Dairy Cows’’. Galway, Ireland, in press.
Fetrow, J., McClary, D., Harman, R., Butcher, K., Weaver, L., Studer, E., Ehrlich, J., Etherington, W., Guterbock, W., Klingborg, D., Reneau, J., Williamson, N., 1990. Calculating selected reproductive indices:
Ž .
recommendations of the American Association of Bovine Practitioners. J. Dairy Sci. 73 1 , 78–90.
Ž
Forshell, K.P., Osteras, O., Aagaard, K., Kulkas, L., 1995. The Third International Mastitis Seminar May
.
29–June 1 . Tel-Aviv, Israel. Disease recording and cell count data in 1993 in Sweden, Norway, Denmark and Finland.
Glover, M.E., 1997. Practical and financial implications of fertility control management, Nottingham Cattle Fertility Conference Controlling Fertility in Dairy Cows. Nottingham University, UK.
Kossaibati, M.A., Esslemont, R.J., 1995. Wastage in dairy herds, DAISY Report No. 4. Department of Agriculture, The University of Reading, UK.
Kossaibati, M.A., Esslemont, R.J., 1997a. Understanding the rearing of dairy heifers, A Stockman’s Guide. Booklet Sponsored by National Milk Records. The University of Reading, UK.
Kossaibati, M.A., Esslemont, R.J., 1997b. The costs of production diseases in dairy herds in England. Vet. J. 154, 41–51.
Ž .
Langhill Report., 1998. Report from the Langhill Dairy Cattle Research Centre. June, 1998 . University of Edinburgh and Scottish Agriculture College, pp. 25.
Peeler, E.J., Otte, M.J., Esslemont, R.J., 1994. Inter-relationships of periparturient diseases in dairy cows. Vet. Rec. 134, 129–130.
Plaizier, J.C.B., King, G.J., Dekkers, J.C.M., Lissemore, K., 1997. Estimation of economic values of indices for reproductive performance in dairy herds using computer simulation. J. Dairy Sci. 80, 2775–2783. Schutte, R., Esslemont, R.J., Chamberlain, A.T., 1992. Standard values for dairy herd fertility parameters.
Ž .
Abstr. J. Anim. Prod. 54 3 , 78.
Solbu, H., Lie, O., 1990. Selection for disease resistance in dairy cattle. Proceedings of The Fourth World Conference on Genetics Applied to Animal Production, Edinburgh XVI, 445–448.
Wassell, T.R., Esslemont, R.J., 1992. Survey of the operation of dairy herd health schemes by veterinary practices in the United Kingdom. Vet. Rec. 130, 260–263.
Webb, R., Royal, M.D., Gong, J.G., Garnsworthy, P.C., 1999. The influence of nutrition on fertility. Cattle Pract. 7, 227–234.