Biochemical Systematics and Ecology 29 (2001) 287–304
Genetic diversity of
Ocimum gratissimum
L. based
on volatile oil constituents, flavonoids and RAPD
markers
Roberto F. Vieira
a,1, Rene´e J. Grayer
b, Alan Paton
b,
James E. Simon
a,*
,2aCenter for New Crops and Plant Products, Purdue University, West Lafayette, IN 47907-1165, USA b
Royal Botanical Gardens, Kew, Richmond, Surrey, TW9 3AB, UK
Received 20 August 1999; accepted 26 October 1999
Abstract
Morphological, chemical and genetic differences of 12 tree basil (Ocimum gratissimum L.) accessions were studied to determine whether volatile oils and flavonoids can be used as taxonomical markers and to examine the relationship between RAPDs to these chemical markers. Eugenol, thymol, and geraniol were the major volatile oil constituents found in
Ocimum gratissimum. Xantomicrol and cirsimaritin were the major external flavones. The accessions morphologically described asO. gratissimumvar. gratissimumcontained eugenol as the major volatile oil constituent, and cirsimaritin as the major flavone.Ocimum gratissimum
var. macrophyllum accessions contained thymol as the major volatile oil constituent, and xantomicrol as the major flavone. A distinct essential oil and flavone chemotype (producing geraniol and a mixture of the flavones cirsimaritin, isothymusin, xanthomicrol, and luteolin) was found in an accession genetically more distant from the other two groups when analyzed by molecular markers. The accessions could be divided based on volatile oil constituents into six groups: (1) thymol: a-copaene (ot24, ot25, ot26, and ot28); (2) eugenol:spathulenol (ot17, ot63, and ot52); (3) thymol:p-cymene (ot65); (4) eugenol:g-muurolene (ot27 and ot29); (5) eugenol:thymol: spathulenol (ot85); and (6) geraniol (ot84). Cluster analysis of RAPD markers showed that there are three groups that are distinct genetically and highly correlated (r¼0:814) to volatile oil constituents. # 2001 Elsevier Science Ltd. All rights reserved.
1Current address: Embrapa, Cenargen, Caixa Postal 02372, Brasilia, DF, Brazil.
2Current address: New Use Agriculture and Natural Plant Products, Rutgers University, Foran Hall, New Brunswick, NJ 08901-8520, USA.
*Corresponding author. Tel.: +1-732-932-9711; fax: +1-732-932-9441.
E-mail addresses:[email protected] (R.F. Vieira), [email protected] (J.E. Simon).
Keywords:Lamiaceae; Essential oils; External flavones; Tree basil; Molecular markers; Eugenol; Thymol; Geraniol; Xantomicrol; Cirsimaritin
1. Introduction
Tree basil (Ocimum gratissimum L., Lamiaceae) is a species commonly used in traditional medicine in South America (Correˆa, 1984; Grandi et al., 1989; Albuquerque and Andrade, 1998b) and Africa (Jirovetz et al., 1998; Ntezurubanza et al., 1986; Ndounga and Ouamba, 1997). This species is also reported as a commercial source of eugenol in India (Choudhuri et al., 1988), where the plant has been bred for this natural product (Khosla, 1988; Sobti and Pushpangadan, 1982).
Although many studies have focused on characterizing the volatile oils from this species, its intraspecific taxonomic identity is still confusing.Ocimum gratissimumis differentiated from the other commonly cultivatedOcimumspecies by the throat of its fruiting calyx closed by the median lobes of the lower lip pressed against the undersurface of the upper lip and hairs in the underside of the upper lip only (Paton, 1992). The corolla is funnel-shaped, posterior stamens appendiculate, hairy or glabrous. The nutlets are brown, and do not produce mucilage as with other
O. basilicumspecies.
Ocimum gratissimum,ð2n¼40Þwith Africa as its center of origin, forms a variable polymorphic complex (Paton, 1992). This species is subdivided into two varieties:
O. gratissimumL. var. gratissimum, which has a hairy stem, and pubescent leaves, and inflorescence lax or dense; and O. gratissimum var. macrophyllum Briq., with glabrous stem and leaves, and inflorescence lax (Paton, 1992; Albuquerque and Andrade, 1998a). O. gratissimum presents large morphological variability, specifi-cally in the indumentum of stem, leaves and form of inflorescence (Albuquerque and Andrade, 1998a), making it difficult to use morphological traits as a reliable or definitive indicator for those with overlapping characteristics.
Paton (1992) found forms of O. gratissimum in Tanzania and Uganda which corresponded to var. macrophyllum in calyx indumentum and in having a lax inflorescence, but with a stem indumentum similar to var.gratissimum. Paton (1992) reported that there is no morphological or ecological discontinuity which can separate forms with dense, wide, robust inflorescences (referred previously as O. trichodon) from specimens with narrow inflorescences (namedO. urticifolium). Both,
O. trichodonandO. urticifolium, are now considered as a synonym ofO. gratissimum
var.gratissimum.
The use of secondary metabolites in plant taxonomy is well recognized (Hegnauer, 1966; Gottlieb, 1982), as these compounds can sometimes aid in taxonomical classification. Variation in leaf essential oil among 38 wild populations of
Chamelaucium uncinatumwas used to describe infraspecific diversity and geographic patterns of variation (Egerton-Warburton et al., 1998). Can˜igueral et al. (1994) showed the utility of chemical polymorphism in the differentiation of twoThymus
R.F. Vieira et al. / Biochemical Systematics and Ecology 29 (2001) 287–304
species. Grayer et al. (1996a) reported the volatile oil profiles of 16 accessions of
O. basilicumand suggested that an infraspecific classification of this taxon should take these chemical characteristics into consideration.
Guenther (1948) reported that the volatile oils distilled fromO. gratissimumcould be divided into two groups, the first group based on high eugenol content and the second group based on high thymol. The essential oil composition reported in the literature since that time confirms Guenther’s division. Several thymol-rich (Ekundayo, 1986; Ntezurubanza et al., 1987; Pino et al., 1996; Ndounga and Ouamba, 1997; Jirovetz et al., 1998; Sanda et al., 1998), and eugenol-rich (Chogo and Crank, 1981; Zamureeenko et al., 1986; Jankovsky et al., 1990; Fun et al., 1990; Colson et al., 1991; Cortez et al., 1998) plants have been reported, including the species O. viride (thymol rich) and O. suave (eugenol rich), both considered synonyms ofO. gratissimum(Paton, 1992). More recently, a third chemotype, rich in geraniol, was also reported (Charles and Simon, 1992).
Khosla (1988) reported that the major constituent in the F1ofO. gratissimum
O. viride was eugenol, as in the O. gratissimum parent, while thymol, the major constituent inO. viride(65%), was found in lower concentration (9.5%).
The family Lamiaceae is rich in flavonoids of many different structures, and they have often proved useful for chemotaxonomic purposes (Toma´s-Barbera´n and Gil, 1992). A special chemical feature of this family is the presence of lipophilic external flavonoid aglycones, which are often highly methylated (Toma´s-Barbera´n and Wollenweber, 1990). These compounds are found on the surface of the plants (leaves, stems, inflorescences), and there is evidence that they, like essential oils, are stored in special glandular hairs (Bosabaldis et al., 1998). Grayer et al. (1996b) reported the presence of 12 external flavones inO. basilicum, O. citriodorumandO. minimumand there appeared to be some quantitative variation in flavonoids between the three species, and between the different accessions ofO. basilicum. Although the flavonoid profile (both internal and external) of one accession ofO. gratissimumhas been reported (Grayer et al., 2000), infraspecific flavonoid variation in this genus has not been studied so far. The external flavones found in this accession included cirsimaritin, isothymusin and xanthomicrol.
Our goal was to determine whether secondary metabolites such as volatile oils and flavonoids can be used as taxonomic markers inO. gratissimum, and to examine how molecular markers, such as RAPDs, are correlated to these chemical markers. This work should lead to an enhanced understanding of the measurements which can be used to assist in the taxonomic identification and differentiation of this species.
2. Material and methods
2.1. Plant material
Twelve accessions ofOcimum gratissimum(Table 1) obtained from Richters Seed Co. (3), Purdue University (2), USDA (1), and introduced from Brazil (5) and Russia (1), were grown at Purdue University Research Station, W. Lafayette, IN, in a
Table 1
List ofOcimum gratissimumaccessions, origin, growth and essential oil accumulation, grown at Purdue University, West Lafayette, IN
Accession Origin Accession
Ot17 USA USDA,aPI211715 64
+2.9 536.5+90 151.2+26.5 0.72+0.11
aUSDA, United States Plant Introduction Center, Ames, Iowa.
bEmbrapa, Brazilian Agricultural Research Corporation, Brasilia, Brazil.
randomized complete block experimental design, with four plants in each of the three replications. The above-ground biomass of each individual plant from each block was harvested at full bloom, bulked, placed in a paper bag, and dried in a forced-air drier at 388C for 15 d for oil analysis. Tissue samples were collected in liquid nitrogen for DNA analysis. Voucher specimens were collected, dried and stored at the Purdue University herbarium (POU). The taxonomic identification was conducted in collaboration with Dr. A. Paton from Royal Botanical Gardens, Kew, UK; Dr. A. Tucker from Delaware State University, USA and Dr. U. Albuquerque from Universidade Federal de Pernambuco, Brazil. Vouchers specimens were sent to both Kew Gardens (K) and Delaware State University (DOL) for permanent collection.
2.2. Oil extraction
The volatile oil was extracted from dried samples in a 2 l flask with distilled water (1 : 15 w/v) using a Clevenger apparatus, as previously described (Charles and Simon, 1990).
2.3. Gas chromatography/mass spectrometry
Volatile oil samples were analyzed in a Varian 3700 gas chromatograph equipped with FID and an electronic 4270 integrator. A fused silica capillary column (30 m0.25 mm ID) with an RSL-200 (Altech, 5% phenyl, 95% methylpolysilox-ane) bonded phase was used. Helium was used as a carrier gas and oven temperature was held isothermal at 808C for 2 min and then programmed to increase at 38C/min to 1608C. This gave a complete elution of all peaks (using sensitivity of 10ÿ10, attenuation 16). The injector and detector temperatures were 180 and 3008C, respectively. Standards samples of oil constituents (p-cymene, 1,8-cineole, terpinen-4-ol, methylchavicol, geraniol, thymol, eugenol, methyleugenol, b-caryophyllene) were run at the same conditions. Identification of essential oil constituents was confirmed by GC/MS using a Finningan 4000; He carrier gas with a column pressure of 10.5 psi and split vent of 40 ml/min; oven program, 808C for 2 min and then programmed to increase at 38C/min to 1608C; injection temperature, 2258C. The MS conditions include ionization voltage, 70 eV; emission current, 40 mA; scan rate, 1 scan/s, mass range, 40–500 Da; ion source temperature, 1608C (Charles and Simon, 1990).
2.4. DNA extraction
The DNA extraction method used was modified from Doyle and Doyle (1987). Tissue samples (young leaves and spikes) were harvested, frozen in liquid nitrogen, and stored in a freezer at ÿ808C. Samples were refrozen in liquid nitrogen, crushed and ground and quickly transferred to an eppendorf tube. A 700ml of DNA CTAB extraction buffer was added, and incubated for 60 min at 558C. A 700 ml of chloroform : isoamyl alcohol (24 : 1) was added to each sample. The samples were centrifuged for 8 min at 13,000 rpm and 600ml of supernatant removed. A 700ml of
ice-cold isopropanol (ÿ208C) was added, and samples were then placed in a freezer at ÿ808C for 1 h, centrifuged for 8 min to pellet the nucleic acids, and the supernatant was then decanted. The pellet was washed with 1 ml of 70% ethanol, centrifuged, and the supernatant carefully removed. The pellets were dried, resuspended in 200ml TE, and RNAse treated. The quality and concentration of DNA were estimated using a DNA ladder of known concentration and absorbance at 260 nm. Working stocks of DNA were then prepared based on both estimates. To determine DNA quality, a 0.8% agarose minigel was run at 60 V for 2 h, stained with ethidium bromide for 30 min, and visualized under UV light. Estimates of DNA were then compared with DNA of known concentration run on the same gel.
2.5. Polymerase chain reaction amplification
Twelve decamer arbritrary oligonucleotides (Operon Technologies Inc., Alameda, CA, USA) were used for PCR amplification following the procedure of Williams et al. (1990) with a few modifications. Amplifications were performed in 25ml volume of PCR mixture containing 50–200 ng of DNA template, PCR buffer (50 mM KCl; 10 mM Tris–HCl pH 8.8; 1.5 mM MgCl2, 0.1% Triton X-100), 0.1 mM of each dNTP, 0.2 mM primer, and 1 unitTaqDNA polymerase. All reactions were overlaid with 1 drop of mineral oil and amplified in a Thermocycler programmed for 45 cycles of denaturing for 20 s at 948C; annealing for 40 s at 378C; and extension for 1 min at 728C. PCR products were electrophoresed on a 1.5% agarose gel at 100 V for 2 h, stained with ethidium bromide, and visualized in UV light. A control lacking template was included in each amplification reaction.
2.6. Data analysis
The presence of a specific band of amplified DNA was scored as 1 or 0 if absent, for all prominent bands within the fingerprint. Dice’s index (Hillis et al., 1996) of similarity was used, as follows:
dðJ; KÞ ¼
2Nj;k
NjþNk
;
whereJandKare two different plants,Nj;kis the number of shared fragments, and
Nj and Nk are the total number of fragments of plants J and K, respectively. A dendrogram was constructed using the unweighted pair-group method with arithmetical average (UPGMA). The software NTSYS (Numerical Taxonomic System) was used to perform the cluster analysis (Rholf, 1995). Bootstrap analysis was performed, using Winboot software (Yap and Nelson, 1996).
Principal Component Analysis (PCA) was performed to display the relationship among O. gratissimum accessions in terms of their position relative to three coordinate axes. PCA using correlated data matrix among volatile oil constituents was used to determine differences between accessions. All PC analyses were carried out using SAS software (SAS Institute Inc., Cary, NC) procedures.
R.F. Vieira et al. / Biochemical Systematics and Ecology 29 (2001) 287–304
2.7. Extraction of external flavonoids
For each accession, 0.5 g of dried leaf material of four different plants was extracted in separate vials containing 10 ml of diethyl ether. After 24 h, extracts were poured off into clean vials, leaves were rinsed with another 5 ml of diethyl ether, and this was added to the initial extracts. The diethyl ether was then evaporated from the vials in a fume cupboard until complete dryness. The residues were each dissolved in 1 ml of an 80% aqueous methanol solution.
2.8. HPLC analysis of external flavonoids
The extracts in 80% methanol were filtered using 13 mm nylon Gelman Science Acrodisc syringe filters, pore size 0.45mm, into 1 ml auto-sampler HPLC vials before HPLC analysis. The HPLC system consisted of a Waters LC 600 pump with a 996 photodiode array detector controlled by Millennium software. A Merck Lichrospher 100RP-18 column was used, 4.0 mm (ID)250 mm, 5mm particle size. All solvents used were HPLC grade. Elution was with a linear gradient of 2% aqueous acetic acid (solvent A) and methanol, acetic acid water (18 : 1 : 1, solvent B), starting with 60% B att¼0 and changing to 100% B att¼15 min. The program continued with 3 min of isocratic solution with 100% B before returning to the initial conditions at
t¼20 min (40% A, 60% B). The next injection (by autosampler) was att¼30 min to allow 10 min of equilibration of the initial conditions. The temperature of the column was maintained at 308. The retention times (in min) andlmax(in nm) of the
flavonoid standards run as markers in this HPLC system were as follows: luteolinRt
5.8,lmax256, 268sh, 350; cirsiliolRt7.6,lmax255, 274, 348; isothymusinRt8.1,lmax
285sh, 305, 334; cirsimaritinRt 10.2,lmax 275, 336; xanthomicrolRt 12.6,lmax282,
295sh, 333. The flavonoids in the plant extracts were identified by comparing their retention times and UV spectra with those of the standards.
2.9. Flavonoid standards
Luteolin and cirsiliol were obtained commercially from Apin. Cirsimaritin and xanthomicrol were gifts from Prof. E. Wollenweber. Isothymusin is the major flavonoid constituent in Becium grandiflorum (Grayer and Veitch, 1999) and was obtained from a fresh extract of the leaves of this plant.
2.10. Quantification of total flavonoids and determination of composition percentages
Known volumes of a standard solution of 0.05% cirsiliol and dilutions thereof were injected into the HPLC to plot the different amounts of the flavone injected against the corresponding UV absorbances at thelmax of this compound measured
by the diode array detector. The cirsiliol marker was available in sufficient amounts to make a standard solution, unlike the external flavones present inO. gratissimum, for which in general less than 1 mg was available, an amount too low to weigh accurately. Although the extinction coefficient of cirsiliol and those of the flavones
present inO. gratissimumare likely to be slightly different, they will be in the same order of magnitude. Therefore, using the cirsiliol plot, the amounts of each flavonoid in HPLC runs of O. gratissimum extracts could be estimated from the UV absorbance at thelmax of that particular flavonoid as if it had the same extinction
coefficient as the cirsiliol marker. A known concentration of cirsiliol was also used as an internal standard in one of the four plant samples analyzed by HPLC for each accession ofO. gratissimum, to check reproducibility of retention times and amounts of compound injected. The amount of extract injected into the HPLC for each plant sample was 40ml out of 1 ml of extract, corresponding to 20 mg of dried leaf material. From these data, we estimated the amount of each individual flavonoid present per gram of dried leaf material. Total flavonoid concentration in the leaves of each plant sample was estimated by adding the individual amounts of flavonoids together, whereas composition percentages of the individual flavonoids were calculated by dividing their amounts by the total amount of flavonoids.
3. Results
3.1. Oil yield
Significant variation in the range of total oil content was noted between the accessions (0.29–1.66% EO/g dry wt.), with two accessions, ot17 and ot84, accumulating very high yields of essential oils at 0.72 and 1.66% (dry wt.), respectively (Table 1). The accessions ot24, 25, 26, 28, and 65, which contained thymol as the major constituent (Table 2) had lower oil yields than those which contained eugenol as their major constituent (ot17, 27, 29, 52, 63, and 85). The geraniol chemotype (ot84) had the highest content of total oil per plant (1.66%) (Tables 1 and 2).
3.2. Oil composition
Seventeen volatile oil constituents were identified across the O. gratissimum
accessions, with a predominance of eugenol, geraniol, and thymol (Table 2). Geraniol, a terpene, was present only in accession ot84, while the other accessions contained either thymol or eugenol as their major constituents. When using the essential oil profiles in these accessions, there appears to be three groups of plants, the first a thymol-rich (accessions ot24, ot25, ot26, ot28, and ot65), the second a eugenol-rich (accessions ot17, ot27, ot29, ot52, ot63, and ot85), and the third, a geraniol-rich chemotype (accession ot84).
Some volatile constituents were present in higher amounts only in the accessions rich in thymol. These compounds includedp-cymene, a-copaene, and g-selinene, while spathulenol was higher in the eugenol-rich accessions. To examine the relationships among the differentO. gratissimumaccessions PCA was applied to the volatile oil constituent data, and the first three eigenvalues correspond to 45, 19, and 12% of the total variance (Table 3). The spatial relationship of the 12 accessions
R.F. Vieira et al. / Biochemical Systematics and Ecology 29 (2001) 287–304
Table 2
Chemical composition (relative percentage of total volatile oil)aofOcimum gratissimumaccessions, grown under field conditions, Purdue University
Volatile oil O. gratissimumaccessions
Constituentsb R
Tc ot17 ot24 ot25 ot26 ot27 ot28 ot29 ot52 ot63 ot65 ot84 ot85
a-Camphene 4.87 0.3+0.1 0.7+0.5 0.3+0.3 0.4+0 0.4+0.3 0.4+0.3 0.2+0.2 0.5+0.4 0.4+0.4 1.2+0.5 0.2+0.1 0.4+0.4
p-Cymene 5.9 0.3+0.2 3.4+2.2 3.3+4.1 2.8+1.7 2.7+2.2 0.3+0.3 0.4+0.4 9.6+4.5 0.8+0.4
1,8-cineole 6.08 0.4+0.2 td 0.7+1.4 0.1+0.1 0.2+0.3 0.4+0.5 0.6+0.3 2.1+0.9
g-Terpinene 6.74 1.6+0.7 1.2+0.9 2.3+0.7 t 2.1+1.7 2+2.8 0.1+0.2 2.3+0.3 t
g-Terpineol 7.22 2.3+0.2 2.5+0.6 1.5+0.4 2.4+1.3 0.2+0.2 2+0.3 0.8+1 3.2+1 2.1+1 4.3+0.4 0.1+0.2 0.4+0.4 Terpinolene 8.12 1.1+0.6 2+1.4 0.9+0.2 1+0.1 0.8+0.4 1.3+0.3 1.2+0.9 1.4+0.2 1.4+0.7 1.9+0.3 0.6+0.1 1.4+1.6 Terpinen-4-ol 10.95 0.9+0.4 1.4+0.4 1.7+0.3 1.6+0.1 t 1.5+0.8 1+0.3 1.6+0.8 2.6+0 0.1+0 t Methylchavicol 11.72 0.5+0.4 0.5+0.2 1.1+0.7 0.6+0.2 0.4+0.2 0.9+0.4 0.2+0.2 0.8+0.4 0.5+0.5 1.7+0.5 0.3+0.2 0.6+0.3 Anisole 14.08 0.9+0.6 1.5+1.9 3.5+2.6 7.3+7.6 1.4+2.5 1.5+0.9 3+3.5 1.2+1.6 2.2+1.9 1.9+1.4
Geraniol 15.8 85.4+2.1
Thymol 16.39 5.2+3.5 37.2+3.3 41.6+2.1 38.5+5.1 5.7+2.3 33+4.2 7.9+4.6 0.3+0.2 44.3+0.8 1.1+0.3 12.7+7.5 Eugenol 18.72 62.6+3.2 3.5+1 3.7+2.2 2.1+1.5 45.1+8.6 1.3+1 48+3.3 50.1+2.7 44.1+10.5 3.3+1.7 1.1+0.8 41.7+8.5 a-Copaene 20.75 2.4+0.4 14.3+2.3 11.3+2.2 11.9+2.7 1.5+0.416.9+2.6 1.5+0.2 2.8+1.2 1.8+0.3 4.1+0.9 1.3+0.1 0.7+0.1 g-Caryophyllene 22.03 0.3+0.1 1.9+0.2 1.9+0.8 1.6+0.2 1+0.4 2.2+0.3 0.9+0.3 0.6+0.3 0.3+0 0.9+0.2 0.8+0.1 2.2+0.3 g-Selinene 23.66 1.4+0.6 6.4+0.9 6.5+2.7 5.1+1.1 0.2+0.3 8.1+2.8 0.2+0.2 1.3+1.2 0.5+0 6.8+1.4 2.1+0.2 0.3+0.4 g-Muurolene 24.47 1+0.3 6.4+0.7 5.7+0.8 5+0.7 20.2+2.2 6.5+1.1 14.8+4.3 1.6+1.1 1.1+0.5 1.2+0.2 0.4+0.1 1.1+0.1 Spathulenol 27.6 9.9+2.3 4.3+0.9 4.2+1 3.7+0.8 14.3+3 4.9+0.4 13.1+1.9 25.3+5.2 23.4+6.8 1.9+0.3 0.7+0.3 15.4+3.9
aValues reported as an average of three replicates +SD. bListed in order of retention time (min).
cR
T=retention time. dt=traces (
50.05%).
R.F.
Vieira
et
al.
/
Biochemical
Systemat
ics
and
Ecology
29
(2001)
287–304
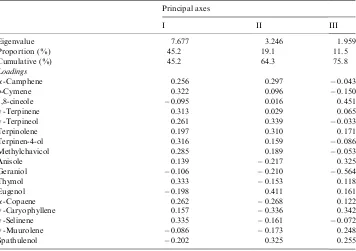
Table 3
Eigenvalues and loadings on principal component analysis of variation in volatile oil constituents in
Ocimum gratissimumaccessions
Principal axes
I II III
Eigenvalue 7.677 3.246 1.959
Proportion (%) 45.2 19.1 11.5
Cumulative (%) 45.2 64.3 75.8
Loadings
a-Camphene 0.256 0.297 ÿ0.043
p-Cymene 0.322 0.096 ÿ0.150
1,8-cineole ÿ0.095 0.016 0.451
g-Terpinene 0.313 0.029 0.065
g-Terpineol 0.261 0.339 ÿ0.033
Terpinolene 0.197 0.310 0.171
Terpinen-4-ol 0.316 0.159 ÿ0.086
Methylchavicol 0.285 0.189 ÿ0.053
Anisole 0.139 ÿ0.217 0.325
Geraniol ÿ0.106 ÿ0.210 ÿ0.564
Thymol 0.333 ÿ0.153 0.118
Eugenol ÿ0.198 0.411 0.161
a-Copaene 0.262 ÿ0.268 0.122
g-Caryophyllene 0.157 ÿ0.336 0.342
g-Selinene 0.335 ÿ0.161 ÿ0.072
g-Muurolene ÿ0.086 ÿ0.173 0.248
Spathulenol ÿ0.202 0.325 0.255
Fig. 1. Principal component analysis of 17 volatile oil constituents of 12Ocimum gratissimumaccessions.
R.F. Vieira et al. / Biochemical Systematics and Ecology 29 (2001) 287–304
using the first three vectors from this analysis accounts for 75.7% of the variation (Fig. 1) and divides the accessions into six groups. The first Principal Component (PC1) explains 45.1% of the variation and has an eigenvalue of 7.68, which consists of p-cymene, g-terpinene, g-terpineol, terpin-4-ol, methylchavicol, thymol,
a-copaene, and g-selinene as major constituents (Table 3). The PC2 accounts for 19% of the variation, with an eigenvalue of 3.25. The PC2 is bipolar with
g-terpinene, eugenol, and spathulenol contrasted with g-caryophyllene. The PC3 accounted for 11.5% of the variation, and has an eigenvalue of 1.96. Two major volatile oil constituents are responsible for this bipolar vector, 1,8-cineole and geraniol. The PC4 (not shown) explained 7.7% of variation, and was mainly due to 1,8-cineole and g-muurolene. The PCAs were able to separate the accessions into six groups: (1) thymol: a-copaene (ot24, ot25, ot26, and ot28); (2) eugenol:spathulenol (ot17, ot63, and ot52); (3) thymol:p-cymene (ot65); (4) eugenol:
g-muurolene (ot27 and ot29); (5) eugenol:thymol: spathulenol (ot85); and (6) geraniol (ot84).
3.3. Flavonoids
Preliminary analysis showed four major flavones in O. gratissimum (Table 4), including xantomicrol, cirsimaritin, isothymusin, and luteolin. Six accessions (ot17, ot24, ot27, ot65, ot84, and ot85) were evaluated for flavonoids. Total concentrations of flavonoids varied greatly among the different accessions (Table 4), from 0.01 mg/g dried leaf (ot85) to 2.9 (ot26), an increase by a factor of 290. In accessions containing low flavonoid concentrations (ot27, ot63, and ot85) only one flavonoid, cirsimaritin, was detected, whereas three flavones, cirsimaritin (10% of the total flavonoids), isothymusin (0.2–0.4%) and xanthomicrol (87–90%) (see Table 4) were present in the two accessions containing very high flavonoid levels (ot26 and ot65). Accession ot84, which showed intermediate levels of external flavonoids (0.3–0.6 mg/g), contained four flavones in different composition percentages from the other accessions: luteolin (3–8%), cirsimaritin (60–70%), isothymusin (14–24%) and xanthomicrol (4–18%). In contrast to the other five accessions which were homogeneous and varied little from one plant to another, ot84 exhibited composition variation between the four plants sampled. There was an interesting correlation between flavonoid and essential oil profiles. The accessions containing very high levels of flavonoids (ot26 and ot65) were rich in thymol and the accessions containing very low levels of flavonoids (ot27, ot63, and ot85) were rich in eugenol. Accession ot84, which was intermediate in flavonoids, was also rich in geraniol. It is possible that the eugenol-rich accessions contain low levels of flavonoids because eugenol, also a phenylpropenoid, may compete more successfully than the flavonoids for the amino acid precursor phenylalanine. There may not be such a competition between the production of monoterpenoids and flavonoids, and that maybe the reason why accessions accumulating thymol and geraniol can accumulate high levels of external flavones.
Table 4
Relative percentage of flavones to total flavonoidsapresent in each extract, from
Ocimum gratissimumaccessions, grown under field conditions, Purdue University
Ocimum gratissimumchemotypes
Eugenol Eugenol Eugenol Eugenol Geraniol Thymol Thymol
Flavonoidsb (ot27) (ot52) (ot63) (ot85 ) (ot84 ) (ot26) (ot65 )
Xantomicrol 8.75+6.9 89.8+3.1 86.8+0.5
Cirsimaritin 100+0 100+0 100+0 100+0 66+4.4 10.0+2.8 11.8+1
Isothymusin 20.75+3.9 0.25+0.5 0.2
Luteolin 5+2.7
Total flavonoids (mg/g) 0.03+0.01 0.01+0.006 0.01+0 0.01+0 0.43+0.1 2.1+0.8 1.43+0.3
a
Values reported as an average of three replicates+SD. b
Relative percentage of flavonoids.
R.F.
Vieira
et
al.
/
Biochemical
Systemat
ics
and
Ecology
29
(2001)
287–304
3.4. Morphology
The accessions studied exhibited different leaf sizes, ranging from 11.4+3 (ot85) to 70.9+11.1 (ot27) (Table 5). Accessions with glabrous stem and leaves showed thymol as their major oil constituent, and were identified as O. gratissimum var.
macrophyllum.Accessions identified asOcimum gratissimumvar.gratissimum(stem and leaves pubescent) showed eugenol as the major constituent, except accession ot84, which is rich in geraniol (Table 2). The geraniol chemotype evaluated here was first identified by random screenings ofO. gratissimum source plants of unknown chemistry and then further selected and bred for high oil and geraniol content. Accessions showing similar levels of eugenol had significantly different leaf size. Accessions ot17 and ot27, contained for example 62 and 45% eugenol, yet each had distinct leaf sizes of 15.2 and 71 cm2, respectively (Tables 2 and 5).
Table 5
Leaf area, stem and leaf pubescence, and major volatile oil constituents related to different morphological types ofOcimum gratissimum
Accessions Leaf area (cm2) Stem Leaves Major volatile oil constituents
ot17 15.2+3.3 Hairy Hairy Eugenol/spathulenol ot24 53.1+24.9 Glabrous Glabrous Thymol/a-copaene
ot27 70.9+11.1 Hairy Hairy Eugenol/g-muurolene/spathulenol ot65 38.3+7.4 Glabrous Glabrous Thymol/p-cymene
ot84 35+9.9 Hairy Hairy Geraniol
ot85 11.4+3 Hairy Hairy Eugenol/thymol/spathulenol
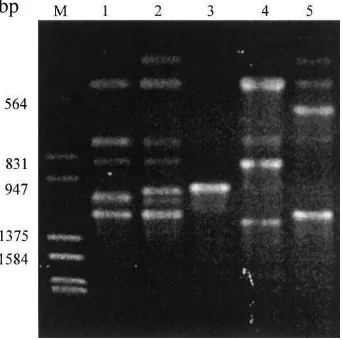
Fig. 2. RAPD profile fromOcimum gratissimumgenerated by Operon G-13 primer. M=marker; lanes 1– 5= accessions ot26, ot65, ot27, ot63, and ot84.
3.5. RAPD markers
To compare the three chemotypes (thymol, eugenol, and geraniol) a subset of five accessions (ot26 and ot65, both rich in thymol; ot27 and ot63, both rich in eugenol; and ot84, geraniol-rich) was examined using RAPDs. Among 18 primers tested, 6 generated 32 polymorphic fragments in the accessions examined, as followed: OPG-02 (GGCACTGAGG) with 6 fragments of 300–1500 bp; OPG-04 (AGCGTGTCTG), with 6 fragments of 300–1500 bp; OPG-05 (CTGAGACGGA), with 2 fragments of 550–1500 bp; 10 (AGGGCCGTCT), with 6 fragments of 500–1600 bp; OPG-13 (CTCTCCGCCA), with 7 fragments of 350–OPG-1350 bp; OPG-14 (GGATGA-GACC), with 5 fragments of 500–1400 bp); in a total of 32 fragments ranging from 300 to 1600 bp. The polymorphic bands found between the accessions using primer OPG-13 showed distinct banding patterns between the three chemotypes (Fig. 2).
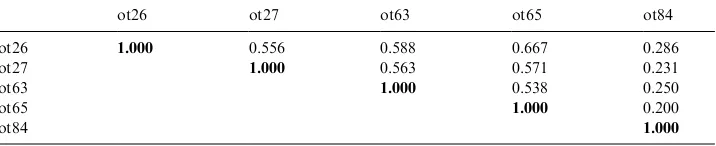
Cluster analysis of RAPD markers showed that the three groups are distinct genetically. The first group rich in thymol and with glabrous stem and leaves, and a second group rich in eugenol and glabrous stem and leaves, are placed quite distant from the third one, the geraniol-rich, with intermediate leaf characteristics (Fig. 3). Genetic similarity between ot26 and ot65 is 0.667 (Table 6), and occurred 57% of times (bootstrap analysis=1000). It is noteworthy that ot26 and ot65 originally came from different locations, Brazil and USA, respectively.
The genetic similarity between accessions ot27 and ot63, was 0.563, which was about the same as ot26 (0.556 and 0.588) and ot65 (0.571 and 0.538). A bootstrap analysis showed that this cluster occurs 31% of the times (Fig. 3). These results Table 6
Similarity matrix based on RAPD markers generated by Dice’s similarity index for five accessions of
Ocimum gratissimum
ot26 ot27 ot63 ot65 ot84
ot26 1.000 0.556 0.588 0.667 0.286 ot27 1.000 0.563 0.571 0.231
ot63 1.000 0.538 0.250
ot65 1.000 0.200
ot84 1.000
Fig. 3. UPGMA phenogram generated based on the similarity index (Dice) among five accessions of
O. gratissimumfrom 32 RAPD markers.
R.F. Vieira et al. / Biochemical Systematics and Ecology 29 (2001) 287–304
suggest that at the genetic level, the eugenol types are not homogenous relative to the thymol types, and this was also observed in the banding pattern (Fig. 2).
4. Discussion
The field and morphological observation ofO. gratissimumaccessions allowed us to identify six types within this species, based mainly on leaf and stem indumentum and inflorescence format. Leaf shape and size differences were also observed. The essential oils analyses of all accessions allowed us to identify three chemotypes (eugenol, thymol, and geraniol), which were also possible to identify in the field by organoleptic evaluation of each accession. PCA grouped the accessions into six chemotypes (Fig. 2), which are identical to the groups identified by morphological observations in the field.
The flavonoid similarity to the volatile oil chemotypes reinforced the observations made in the field and in using volatile oils. The secondary products, flavonoids and volatile aromatic oils, were shown to be associated with the morphological traits, and were useful tools to understand the variation existing within this group. Although we have a limited sample of O. gratissimumpopulations, it does appear that morphological characters are difficult to use alone as descriptors due to their continuous variation. The division of the species into two varieties on the basis of morphology obscures the higher degree of genetic and secondary product variation found in var.gratissimumas opposed to that found in var.macrophyllum. However, the lack of morphological discontinuity makes further subdivision of var.
gratissimumby morphology problematic.
The RAPDs are markers obtained at random through the whole plant genome, and do not reflect necessarily any specific morphological or chemical trait. However, RAPD markers were strongly correlated to the secondary products analyzed, and were able to distinguish the three chemotypes (eugenol, geraniol, and thymol) in this species.
While the volatile oil constituents exhibited an excellent discrimination betweenO. gratissimumaccessions, the use of secondary metabolites as an intraspecific marker per se needs to consider other factors, such as the environmental conditions, plant development, and the extraction method used, all of which can impact volatile oil compositions. Pino et al. (1998) found different volatile oil composition when comparing steam distillation, solvent extraction and supercritical CO2. The sameO. gratissimumsample resulted in varying concentrations of thymol, although it always was the major compound. Minor compounds, such as p-cymene, and g -caryophyllene, were detected in steam distillation, but only traces were found following solvent or supercritical CO2 extraction. Extraction techniques have also been shown to have an impact on the relative concentration of volatile oils from severalOcimumspecies (Charles and Simon, 1990). The reproducibility of secondary metabolites when used to compare herbarium specimens is questionable, since comparing accessions from different locations, grown in completely different environmental conditions, may be problematic.
The genetic variation within species might promote a segregation of several minor compounds, such as with the sesquiterpenes. Although O. gratissimum is largely distributed around the world, very few efforts have yet been made towards the domestication of this species. We observed that accessions with high thymol, or eugenol, have differences in their sesquiterpene constituents (Table 2). We hypothesize that the different types ofO. gratissimum were originally organolepti-cally selected for different aromas and medicinal uses in the case of thymol and eugenol types. The high oil content of ot84 (geraniol type) was due to prior selection for high oil and geraniol content at Purdue University (Charles and Simon, 1992). The use of secondary products for taxonomical considerations may be more useful for taxa such asO. gratissimum that are wild and underdomesticated rather than species that have undergone extensive selection and genetic improvement.
The clear separation between these three types (eugenol, geraniol, and thymol), as shown in this study using aromatic volatile oil, flavonoid, and RAPDs supports and extends the earlier botanical taxonomic work by Paton (1992). Our results showed that volatile oils and flavonoids of this species could differentiate the accessions in a similar manner to the molecular markers. RAPDs are random markers that show differences in the whole genome, and are not necessarily related to a specific morphological trait or secondary compound. The correlation between the molecular markers and volatile oils indicates that molecular markers can be found linked to the volatile oils constituents. Further examination on the actual heritability of each oil constituent among these different accessions and their F2population is necessary to determine the actual linkage.
Acknowledgements
This is Paper No. 16,075 of Purdue University Agric. Programs, Purdue University, West Lafayette, IN. Authors wish to thank Dr. Art Tucker, Delaware University for his assistance and expertise in taxonomic identification. We also wish to thank Peter Goldsbrough for his assistance in our RAPDs work.
References
Albuquerque, U.P., Andrade, L.H.C., 1998a. El generoOcimumL. (Lamiaceae) en el nordeste del Brasil. An. Jard. Bot. Madrid 56 (1), 43–64.
Albuquerque, U.P., Andrade, L.H.C., 1998b. Etnobotanica del generoOcimumL. (Lamiaceae) en las comunidades afrobrasilenas. An. Jard. Bot. Madrid 56 (1), 107–118.
Bosabaldis, A., Gabrieli, C., Niopas, I., 1998. Flavone aglycones in glandular hairs of Origa-numintercedens. Phytochemistry 49, 1549–1553.
Can˜igueral, S., Vila, R., Vicario, G., Tomas, X., Adzet, T., 1994. Chemometrics and essential oil analysis: chemical polymorphism in twoThymusspecies. Biochem. Syst. Ecol. 22 (3), 307–315.
Charles, D.J., Simon, J.E., 1990. Comparison of extraction methods for the rapid determination of essential oil content and composition of Basil. J. Am. Soc. Hortic. Sci. 115 (3), 458–462.
Charles, D.J., Simon, J.E., 1992. A new geraniol chemotype ofOcimum gratissimumL. J. Essential Oil Res. 4 (3), 231–234.
R.F. Vieira et al. / Biochemical Systematics and Ecology 29 (2001) 287–304
Chogo, J.B., Crank, G., 1981. Chemical composition and biological activity of the Tanzanian plant
Ocimum suave. J. Nat. Products 44 (3), 308–311.
Colson, M., Tetenyi, P., Perrin, A., 1991. Characterization of foliar appendages and essential oils of
Ocimum gratissimumL. leaves. Herba Hung. 30 (3), 5–14.
Correˆa, M.P., 1984. Dicionario das plantas uteis do Brasil e das exoticas cultivadas. IBDF, Rio de Janeiro. Cortez, D.A.G., Cortez, L.E.R., Pessini, G.L., Doro, D.L., Nakamura, C.V., 1998. Analysis of essential
oil of alfavacaOcimum gratissimumL (Labiatae). Arq. Ciencias Saude UNIPAR 2 (2), 125–127. Doyle, J.J., Doyle, J.I., 1987. A rapid DNA isolation procedure for small quantities of fresh leaf tissue.
Phytochem. Bull. 19, 11–15.
Egerton-Warburton, L.M., Ghisalberti, E.L., Considine, J.A., 1998. Infraspecific variability in the volatile oils ofChamelaucium uncinatum(Myrtaceae). Biochem. Syst. Ecol. 26, 873–888.
Ekundayo, O., 1986. Essential oils. VIII. Volatile constituents of the leaves ofOcimum viride. Planta Med. 3, 200–202.
Fun, C.E., Svendsen, A.B., Baerheim-Svendsen, A., 1990. Composition of the essential oils ofOcimum basilicumvar. canum andO. gratissimumL. grown on Ariba. Flavor Fragrance 5 (3), 173–177. Gottlieb, O.R., 1982. Micromolecular Evolution, Systematics, and Ecology: An Essay into a Novel
Botanical Discipline. Springer, Berlin.
Grandi, T.S.M., Trindade, J.A., Pinto, M.J.F., Ferreira, L.L., Catella, A.C., 1989. Plantas Medicinais de Minais Gerais, Brasil. Acta Bot. Brasil. 3 (2), 185–224.
Grayer, R.J., Bryan, S.E., Veitch, N.C., Goldstone, F.J., Paton, A., Wollenweber, E., 1996b. External flavones in sweet basil,Ocimum basilicum, and related taxa. Phytochemistry 43 (5), 1041–1047. Grayer, R.J., Kite, G.C., Abou-Zaid, M., Archer, L.J., 2000. The application of atmospheric pressure
chemical ionization liquid chromatography} mass spectrometry in the chemotaxonomic study of
flavonoids: characterization of flavonoids from Ocimum gratissimumvar. gratissimum. Phytochem. Anal., in press.
Grayer, R.J., Kite, G.C., Goldstone, F.J., Bryan, S.E., Paton, A., Putievsky, E., 1996a. Infraspecific taxonomy and essential oil chemotypes in sweet basil,Ocimum basilicum. Phytochemistry 43 (5), 1033–1039. Grayer, R.J., Veitch, N.C., 1999. An hydroxylated external flavone and its 8-O-glucoside fromBecium
grandiflorum. Phytochemistry 47, 779–782.
Guenther, E., 1948. The Essential Oils, Vol. II. Van Nostrand Co., New York.
Hegnauer, R., 1966. Chemotaxonomie der Pflanzen, Band IV. Birkhauser Verlag, Basel/Stuttgart. Hillis, D.M., Mable, B.K., Larson, A., Davis, S.K., Zimmer, E.A., 1996. Nucleic acid IV: sequencing and
cloning. In: Hillis, D.M., Moritz, C., Mable, B.K. (Eds.), Molecular Systematics. Sinauer Associates, Massachusetts, pp. 321–381.
Jankovsky, M., Taborsky, J., Hubacek, J., Hlava, B., 1990. Volatile substances in basil (Ocimum gratissimumL.). Sb. UVTIZ. Zahradnictivi 17 (1), 59–68.
Jirovetz, L., Buchbauer, G., Ngassoum, M.B., 1998. Aroma compounds of leaf and flower essential oils of the spice plantOcimum gratissimumL. from Cameroon. Ernahrung 22 (9), 395–397.
Khosla, M.K., 1988. Breeding in genusOcimum: phytochemical studies of essential oils. Indian Perfumer 32 (3), 236–247.
Ndounga, M., Ouamba, J.M., 1997. Antibacterial and antifungal activities of essential oils ofOcimum gratissimumandO. basilicumfrom Congo. Fitoterapia 68 (2), 190–191.
Ntezurubanza, L., Scheffer, J.J.C., Svendsen, A.B., 1986. Composition of the essential oil ofOcimum trichodongrown in Rwanda. J. Nat. Products 49 (5), 945–947.
Ntezurubanza, L., Scheffer, J.J.C., Svendsen, A.B., Baerheim-Svendsen, A., 1987. Composition of the essential oil ofOcimum gratissimumgrown in Rwanda. Planta Med. 53 (5), 421–423.
Paton, A., 1992. A synopsis ofOcimumL. (Labiatae) in Africa. Kew Bull. 47 (3), 403–435.
Pino, J.A., Garcia, J., Martinez, M.A., 1998. A comparison between the oil, solvent extract and supercritical carbon dioxide extract ofOcimum gratissimumL. J. Essential Oil Res. 10, 575–577. Pino, J.A., Rosado, A., Fuentes, V., 1996. Composition of the essential oil from the leaves and flowers of
Ocimum gratissimumL. grown in Cuba. J. Essential Oil Res. 8 (2), 139–141.
Rholf, F.J., 1995. NTSYS-PC Numerical Taxonomic and Multivariate Analysis System. Exeter Software, New York.
Sanda, K., Koba, K., Nambo, P., Gaset, A., 1998. Chemical investigation ofOcimumspecies growing in Togo. Flavour Fragance J. 13 (4), 226–232.
Sobti, S.N., Pushpangadan, P., 1982. Studies in the genusOcimum: cytogenetics, breeding and production of new strains of economic importance. In: Atal, C.K., Kapur, B.M. (Eds.), Cultivation and Utilization of Aromatic Plants. Regional Laboratory Council of Scientific and Industrial Research, Jammu-Tawi, pp. 457–472.
Toma´s-Barbera´n, F.A., Gil, M.I., 1992. Chemistry and natural distribution of flavonoids in the Labiatae. In: Harley, R.M., Reynolds, T. (Eds.), Advances in Labiate Science. Royal Botanic Gardens, Kew, pp. 299–305.
Toma´s-Barbera´n, F.A., Wollenweber, E., 1990. Flavonoid aglycones from the leaf surfaces of some Labiatae species. Plant Syst. Evol. 173, 109–118.
Williams, J.G.K., Kubelik, A.R., Livak, K.J., Rafalski, J.A., Tingey, S.V., 1990. DNA polymorphism amplified by arbitrary primers are useful as genetic markers. Nucleic Acid Res. 18, 6531–6535. Yap, I., Nelson, R.J., 1996. Winboot: a program for performing bootstrap analysis of binary data to
determine the confidense limits of UPGMA-based dendograms. IRRI Discussion Papers Series No. 4. International Rice Research Institute, Manila, Philippines, 22pp.
Zamureeenko, V.A., Klyuev, N.A., Dmitriev, L.B., Polyakova, S.G., Grandberg, I.I., 1986. Essential oil component composition in basils of the eugenol type. Izv. Timiryazevsk. Skh. Akad. 2, 172–175.
R.F. Vieira et al. / Biochemical Systematics and Ecology 29 (2001) 287–304