EFFECT OF LOSSY JPEG COMPRESSION OF AN IMAGE WITH CHROMATIC
ABERRATIONS ON TARGET MEASUREMENT ACCURACY
R. Matsuoka a, b
a
Research and Development Division, Kokusai Kogyo Co., Ltd., 2-24-1 Harumi-cho, Fuchu, Tokyo 183-0057, JAPAN [email protected]
b
Tokai University Research & Information Center, 2-28-4 Tomigaya, Shibuya-ku, Tokyo 151-0063, JAPAN [email protected]
Commission V, WG V /1
KEY WORDS: Experiment, Compression, Accuracy, Measurement, Color, Distortion, Target
ABSTRACT:
This paper reports an experiment conducted to investigate the effect of lossy JPEG compression of an image with chromatic aberrations on the measurement accuracy of target center by the intensity-weighted centroid method. I utilized six images shooting a white sheet with 30 by 20 black filled circles in the experiment. The images were acquired by a digital camera Canon EOS 20D. The image data were compressed by using two compression parameter sets of a downsampling ratio, a quantization table and a Huffman code table utilized in EOS 20D. The experiment results clearly indicate that lossy JPEG compression of an image with chromatic aberrations would produce a significant effect on measurement accuracy of target center by the intensity-weighted centroid method. The maximum displacements of red, green and blue components caused by lossy JPEG compression were 0.20, 0.09, and 0.20 pixels respectively. The results also suggest that the downsampling of the chrominance components Cb and Cr in lossy JPEG compression would produce displacements between uncompressed image data and compressed image data. In conclusion, since the author consider that it would be unable to correct displacements caused by lossy JPEG compression, the author would recommend that lossy JPEG compression before recording an image in a digital camera should not be executed in case of highly precise image measurement by using color images acquired by a non-metric digital camera.
1. INTRODUCTION
As performance of a digital camera becomes better and its price becomes lower in recent years, digital camera images are becoming more popular in diverse fields. The recent increase in number of pixels of images acquired by a non-metric digital camera encourages one to utilize it for image measurement.
However, a large number of pixels of an image bring difficulties in dealing with it. A high-resolution digital camera on board a mobile mapping system (MMS) often acquires several images per second. The data volume of images acquired by a MMS in a day sometimes reaches one terabyte (1 TB). The huge data volume of acquired images requires huge data storage for them, and makes the input time for processing them much longer. Therefore, lossy image compression before recording an image in a digital camera is still required. Moreover, almost all the recent digital cameras have the built-in function of lossy JPEG compression.
In the meantime the magnitude of displacements between different colors (red (R), green (G), blue (B)) caused by chromatic aberrations are smaller than 1 / 10 of the magnitude of radial lens distortions in most of non-metric digital cameras. However, as a pixel size on the focal plane of a non-metric digital camera becomes smaller, the influence of chromatic aberrations becomes greater and unable to be ignored. Currently, correction of chromatic aberrations would be indispensable for precise image measurement by using color images acquired by a non-metric digital camera.
Then a question has arisen. How much does lossy JPEG compression of an image with chromatic aberrations affect image measurement accuracy?
As for correction of chromatic aberration, Kaufmann and Ladstädter (2005), Luhmann et al. (2006a), Mallon and Whelan (2007), Hattori et al. (2011), and Matsuoka et al. (2012) reported experiments to correct chromatic aberrations. Their experiment results did not necessarily indicate that their proposed correction methods are able to provide satisfactory correction results equal to the measurement accuracy of single point features described in the literature by Luhmann et al. (2006b).
On the other hand, few papers reported on the effect of lossy JPEG compression of an image with chromatic aberrations on image measurement accuracy. Therefore, I decided to investigate the effect of lossy JPEG compression of an image with chromatic aberrations on image measurement accuracy. This paper reports an experiment conducted to investigate the effect of lossy JPEG compression of an image with chromatic aberrations on measurement accuracy of target center by the intensity-weighted centroid method. The experiment was conducted on the assumption that lossy JPEG compression is executed before recording an image in an ordinary digital camera.
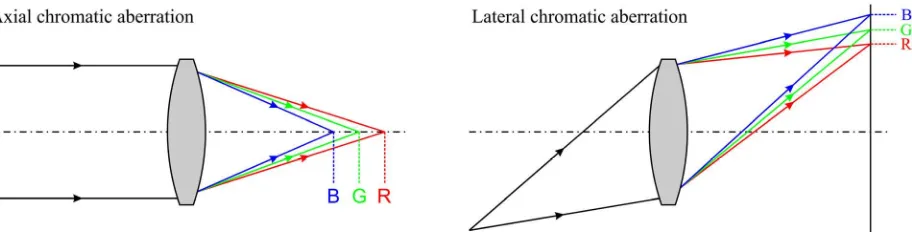
Figure 1. Axial chromatic aberration and lateral chromatic aberration
2. CHROMATIC ABERRATION
Chromatic aberrations are caused by the variation of refractive index with wavelength, and produce lateral (oblique) distortions and axial (longitudinal) distortions (McGlone et al., 2004). Figure 1 shows the axial and lateral chromatic aberration. As for image measurement, the lateral chromatic aberrations that bring geometric errors are more influential than the axial chromatic aberrations that bring image blurs. Displacements between different colors caused by the lateral chromatic aberrations are point symmetric and the magnitude of the displacements is proportional to a radial distance from the principal point of a camera. Accordingly, the lateral chromatic aberration is often referred to as a chromatic difference in magnification.
A compound lens assembled from several lens elements made of substances with different refractive indexes can be utilized to reduce chromatic aberrations (Shibuya, 2005a, Shibuya, 2005b). The most common type is an achromatic doublet composed of two elements made of crown glass and flint glass. By combining more than two lenses of different composition, the degree of correction can be further increased. However, exact correction by using a compound lens can be made only at a small set of wavelengths, and it is impossible to correct chromatic aberrations perfectly at any wavelength over the visible range.
A zoom lens is a more complex optical system and may be expected to have a much higher level of chromatic aberrations than a fixed focal length lens that is a simpler optical system. However, the experiment results reported by Matsuoka et al. (2012) did not necessarily indicate that the magnitude of chromatic aberrations of a zoom lens Canon EF-S 18 - 55 mm F 3.5 - 5.6 USM was larger than that of a fixed focal length lens Olympus M.ZUIKO DIGITAL 17 mm F 2.8.
3. OUTLINE OF EXPERIMENT 3.1 Investigated image
Since chromatic aberrations do not depend on whether a target object to be imaged is 2D or 3D in principle, I utilized six images shooting a white sheet with 30 by 20 black filled circles, which were called evaluation points in the experiment. The images were acquired by a lens-interchangeable digital SLR (single lens reflex) camera Canon EOS 20D with a Canon EF-S 18 - 55 mm F 3.5 - 5.6 USM lens at the widest view of its zoom lens. The lens consists of 11 elements in 9 groups. The number of recording pixels and the pixel size on the focal plane of EOS 20D are 3504 pixels × 2336 pixels and 6.42 m × 6.42 m
respectively. Figure 2 shows one of the images utilized in the experiment.
Figure 2. Image utilized in the experiment
The images were recorded in Canon raw data format, and the acquired raw data were developed without any correction by DxO Optics Pro v7. The developed image data are called R+G+B data in the paper. I prepared three sets of image data with no chromatic aberration by composing monochrome image data that were created by color separation of R+G+B data. These are called R+R+R data for a red color, G+G+G data for a green color, and B+B+B data for a blue color in the paper.
3.2 Lossy JPEG Compression
I compressed four sets of image data (R+G+B, R+R+R, G+G+G, B+B+B) using two compression parameter sets of a downsampling ratio, a quantization table and a Huffman code table utilized in two modes Fine and Normal of EOS 20D by the Independent JPEG Group's free JPEG software. The difference between the modes Fine and Normal of EOS 20D is the difference of the quantization tables utilized in quantization of DCT-coefficient data.
The lossy JPEG compression in EOS 20D is executed with the following process:
Step 1: color space conversion Step 2: downsampling Step 3: block splitting
Step 4: discrete cosine transformation (DCT) Step 5: quantization of DCT-coefficient data Step 6: entropy encoding (Huffman coding)
Chromatic aberrations were expected to have an impact in Step 1: color space conversion and Step 2: downsampling.
A source image data represented in RGB (R: red, G: green, B: blue) color space is converted into an image data represented in YCbCr (Y: luminance component, Cb, Cr: chrominance components) color space in Step 1. The color space conversion from RGB color space to YCbCr color space in lossy JPEG compression is very common, and it is executed by using the following equation:
Downsampling, which is sometimes called chroma subsampling, is to reduce the spatial resolution of the chrominance components Cb and Cr. Data reduction of Cb and Cr in EOS 20D is performed by 2x1 1x1 1x1 sampling. 2x1 1x1 1x1 sampling means that the luminance component Y is not downsampled and the chrominance components Cb, Cr are downsampled 2:1 horizontally and 1:1 vertically. 2x1 1x1 1x1 sampling indicates that the horizontal resolution of Cb and Cr is half of that of Y and the vertical resolution of Cb and Cr is full of that of Y. 2x1 1x1 1x1 sampling is the common case of downsampling, and is conducted in lossy JPEG compression by most of the current digital cameras.
Two additional downsampling factors of 1x1 1x1 1x1 and 2x2 1x1 1x1 were investigated in the experiment. 1x1 1x1 1x1 sampling means that both the luminance component Y and the chrominance components Cb, Cr are not downsampled, while 2x2 1x1 1x1 sampling means that Y is not downsampled and Cb, Cr are 2:1 downsampled both horizontally and vertically. Figure 3 shows these three downsamplings.
Figure 3. Downsampling (chroma subsampling)
3.3 Measurement method
Image coordinates of the center of an evaluation point were measured by the intensity-weighted centroid method.
Centroid methods are relatively simple and theoretically independent of the image resolution. Furthermore, centroid methods do not require a template dependent on the image resolution. Accordingly, centroid methods are often utilized in measurement of the target location in image measurement.
The intensity-weighted centroid method in the experiment estimates the center location (xC, yC) of an evaluation point by using the following equation:
C
experiment was calculated by using the following equation:
O mean image values of pixels located inside and outside the evaluation point respectively.
3.4 Evaluation of effect of lossy JPEG compression
I evaluated the effect of lossy JPEG compression by using differences of measured coordinates of the center of an evaluation point between a reference uncompressed image data and a target compressed image data. The reference uncompressed image data was the uncompressed R+G+B data, while the target compressed image data were the lossily compressed R+G+B, R+R+R, G+G+G, B+B+B data using two sets of compression parameters for the modes Fine and Normal of EOS 20D. Each investigated image had 600 evaluation points and 3600 evaluation points of the six investigated images were evaluated in the study.
4. RESULTS AND DISCUSSION 4.1 Chromatic aberrations
Table 1 shows the root mean squares (RMSs) and the maxima of displacements of the 3600 evaluation points of the six investigated images between different colors caused by chromatic aberration in the uncompressed R+G+B data.
Horizontal Vertical Diagonal
GR RMS 0.945 0.691 1.171
Max. 1.490 1.402 1.574
GB RMS 0.416 0.354 0.546
Max. 1.655 1.170 1.999
Table 1. RMS and maximum of displacements caused by chromatic aberration of 3600 evaluation points (unit: pixel)
Figure 4 shows displacement vectors GR and GB in the uncompressed R+G+B data of the image shown in Figure 2. The displacement vector GR means a vector from the position of the center of an evaluation point measured in the green color to that measured in the red color.
(a) GreenRed (b) GreenBlue
Figure 4. Displacement vectors caused by chromatic aberration in the image shown in Figure 2
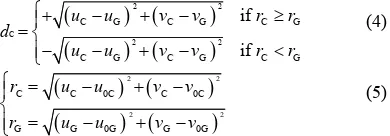
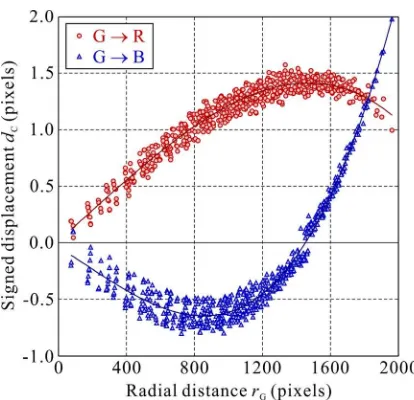
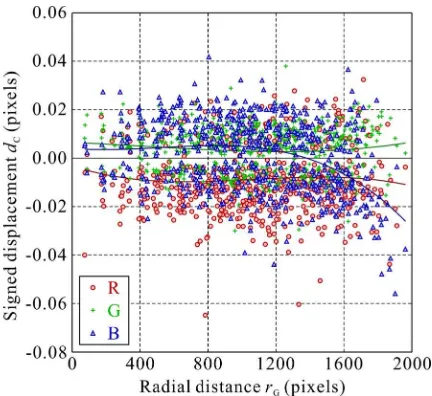
Figure 5 shows signed displacements dC (C = R or B) against radial distances rG in the uncompressed R+G+B data of the image shown in Figure 2. A signed displacement dC of a displacement vector GC from the reference color (G) to the target color (C = R or B) was calculated by the following equations: of the target color (C) and the reference color (G) respectively. rC and rG are radial distances from the center of an image frame of the target color (C) and the reference color (G) respectively. A displacement vector GC with a positive value of dC turns outward, while one with a negative value of dC turns inward.
Solid lines in Figure 5 show the following approximate cubic functions estimated by means of least squares adjustment using the 600 evaluation points for reference:
C 0C 1C G 2C G2 3C G3
d b b r b r b r (6)
The results show that the magnitude of the displacements GR and GB caused by chromatic aberrations was considerably smaller than that of radial lens distortions in ordinary non-metric digital cameras. On the contrary, since the results indicate that the displacements caused by chromatic aberrations were larger than the ordinary measurement errors of image coordinates, I concluded that the displacements caused by chromatic aberrations would be unable to be ignored in precise image measurement.
Moreover, the results indicate that magnitude of a displacement of an evaluation point would depend on a radial distance from the center of an image frame. The results also indicate that the magnitude of the displacements caused by chromatic aberrations would be unable to be approximated with a linear function of the radial distance. This would be caused by the fact that the lens utilized in the experiment was a compound lens assembled from several lens elements.
4.2 Effect of lossy JPEG compression
Table 2 shows compression ratios of the lossily compressed R+G+B, R+R+R, G+G+G, B+B+B data of the image shown in Figure 2 using two sets of compression parameters for the modes Fine and Normal of EOS 20D. The compression ratio in the study was defined as the ratio of the raw data size in bytes of an uncompressed image to the file size in bytes of a compressed image data. The compression ratios for an ordinary color image of the modes Fine and Normal with 2x1 1x1 1x1 sampling of EOS 20D are expected to be 6.5 and 13.0 respectively.
Mode Sampling R+G+B R+R+R G+G+G B+B+B
Fine
Table 2. Compression ratio of the image shown in Figure 2
Table 2 indicate that the difference of the downsampling factors would not produce a greater difference of compression ratios than the difference of the quantization tables utilized in quantization of DCT-coefficient data between the two modes: Fine and Normal of EOS 20D.
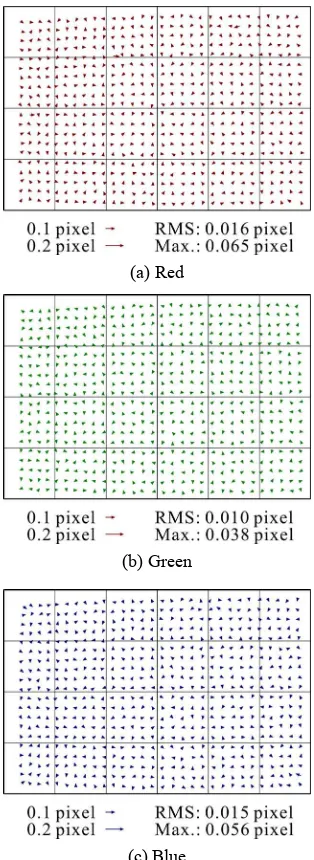
Table 3 shows the RMSs and the maxima of displacements of the 3600 evaluation points of the six investigated images between the uncompressed image data and the compressed image data by using the two compression parameter sets for the modes Fine and Normal of EOS 20D. Figure 6 shows 600 displacement vectors caused by lossy JPEG compression using the compression parameter set for the mode Normal in the image shown in Figure 2. Figure 7 shows signed displacements caused by lossy JPEG compression against radial distances. The signed displacements caused by lossy JPEG compression were calculated by using Equation (4) and Equation (5) in the same way as the signed displacements caused by chromatic aberration were calculated. Solid lines in Figure 7 show approximate cubic functions as well.
Data R+G+B R+R+R G+G+G B+B+B
Color Red Green Blue Red Green Blue
Mode Fine
RMS 0.057 0.021 0.036 0.005 0.004 0.004
Maximum 0.121 0.050 0.121 0.024 0.019 0.027
Mode Normal
RMS 0.090 0.030 0.069 0.009 0.007 0.007
Maximum 0.195 0.094 0.197 0.035 0.025 0.031
Table 3. RMS and maximum of displacements caused by lossy JPEG compression of 3600 evaluation points (unit: pixel) Table 3 indicates that the magnitude of the displacements
caused by lossy JPEG compression was considerably smaller than that by chromatic aberration shown in Table 1. However, Figure 6 and Figure 7 clearly indicate that lossy JPEG compression of an image with chromatic aberrations would produce an effect on measurement accuracy of target center by the weighted centroid method. Since the intensity-weighted centroid method can reach an accuracy of 0.03–0.05
pixel in practice (Luhmann et al., 2006b), the effect of lossy JPEG compression of an image with chromatic aberrations on measurement accuracy of target center by the intensity-weighted centroid method would be unable to be ignored.
Figure 8 shows the displacements caused by lossy JPEG compression using the compression parameter set of the mode Normal against the displacements caused by chromatic Figure 5. Signed displacements caused by chromatic aberration
in the image shown in Figure 2
Figure 7. Signed displacements caused by lossy JPEG compression with 2x1 1x1 1x1 sampling in the image shown in Figure 2 (Mode: Normal)
(a) Red
(b) Green
(c) Blue
Figure 6. Displacement vectors caused by lossy JPEG compression with 2x1 1x1 1x1 sampling in the image shown in Figure 2 (Mode: Normal)
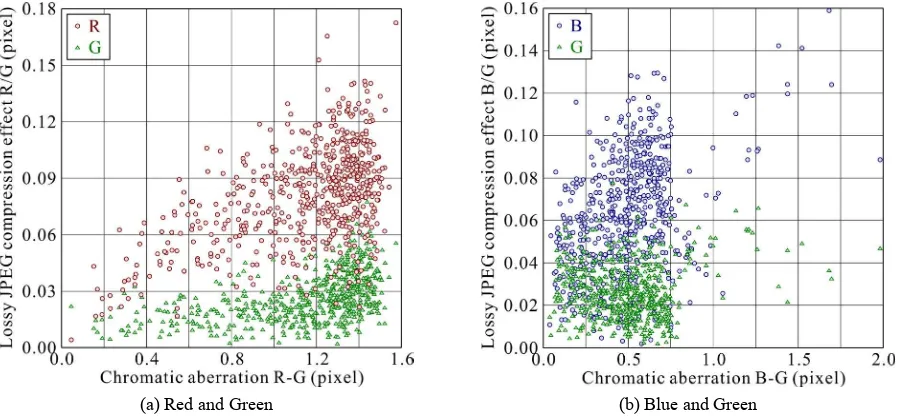
aberration in the image shown in Figure 2. Figure 8 suggests that lossy JPEG compression of an image with chromatic aberrations might produce an effect on measurement accuracy of target center by the intensity-weighted centroid method.
In the meantime Figure 7 and Figure 8 indicate that it would be unable to correct displacements caused by lossy JPEG compression of an image with chromatic aberrations by using a function of the radial distance from the center of an image frame, or a function of the magnitude of chromatic aberrations.
4.3 Effect of downsampling in lossy JPEG compression The horizontal displacements seem to be superior to the vertical displacements in the red color and the blue color in Figure 6. Since I guessed that the cause of the superiority of the horizontal displacements would be 2x1 1x1 1x1 sampling, I investigated additional two sets of lossily compressed R+G+B data which were compressed with 1x1 1x1 1x1 sampling and 2x2 1x1 1x1 sampling.
Table 4 shows the RMSs of displacements of 3600 evaluation points between the uncompressed R+G+B data and the compressed R+G+B data. The displacements were caused by lossy JPEG compression with three different downsampling factors. Figure 9 and Figure 10 show displacement vectors of
the 600 evaluation points caused by lossy JPEG compression with 1x1 1x1 1x1 sampling and 2x2 1x1 1x1 sampling in the image shown in Figure 2 respectively. Figure 11 and Figure 12 show signed displacements caused by lossy JPEG compression with 1x1 1x1 1x1 sampling and 2x2 1x1 1x1 sampling against radial distances in the image shown in Figure 2 respectively. Solid lines in the figures show approximate cubic functions.
The results clearly indicate that the cause of the superiority of the horizontal displacements in Figure 6 would be the downsampling of 2x1 1x1 1x1 sampling. The results also indicate the effect of lossy JPEG compression with 1x1 1x1 1x1 sampling on measurement accuracy of target center would be negligible. That is to say, the reduction of the spatial resolution of the chrominance components Cb and Cr in lossy JPEG compression of an image with chromatic aberration would produce displacements between an uncompressed image data and a lossily JPEG compressed image data.
Mode Sampling Red Green Blue
Horz. Vert. Horz. Vert. Horz. Vert.
Fine
2x1 1x1 1x1 0.054 0.016 0.020 0.007 0.034 0.012
1x1 1x1 1x1 0.006 0.006 0.004 0.004 0.008 0.007
2x2 1x1 1x1 0.072 0.056 0.025 0.018 0.048 0.043
Normal
2x1 1x1 1x1 0.083 0.034 0.028 0.012 0.062 0.029
1x1 1x1 1x1 0.013 0.012 0.007 0.007 0.011 0.011
2x2 1x1 1x1 0.128 0.104 0.043 0.032 0.097 0.089
Table 4. RMS of displacements of 3600 evaluation points caused by lossy JPEG compression with 3 downsampling factors (unit: pixel)
(a) Red and Green (b) Blue and Green
Figure 8. Displacements by chromatic aberration vs. displacements by lossy JPEG compression with 2x1 1x1 1x1 sampling in the image shown in Figure 2 (Mode: Normal)
5. CONCLUSIONS
The experiment results indicate that the magnitude of the displacements caused by lossy JPEG compression using the compression parameter sets utilized in EOS 20D was considerably smaller than that by chromatic aberration. The maximum displacements GR and GB caused by chromatic aberration were 1.57 and 2.00 pixels respectively, while the maximum displacements of R, G, and B caused by lossy JPEG compression were 0.20, 0.09, and 0.20 pixels respectively. However, since the displacements caused by lossy JPEG compression were larger than the ordinary measurement errors of image coordinates, I concluded that the effect of lossy JPEG compression of an image with chromatic aberrations on measurement accuracy of target center by the intensity-weighted centroid method would be unable to be ignored.
Since I consider that it would be unable to correct displacements caused by lossy JPEG compression, I would recommend that lossy JPEG compression before recording an
image in a digital camera should not be executed in case of highly precise image measurement.
The experiment results also suggest that the downsampling of the chrominance components Cb and Cr in lossy JPEG compression of an image with chromatic aberration would produce displacements between an uncompressed image data and a compressed image data. 2x1 1x1 1x1 sampling, which is the common case of downsampling in lossy JPEG compression by most of the current digital cameras would cause horizontal displacements to be superior to vertical displacements.
(a) Red (a) Red
(b) Green (b) Green
(c) Blue (c) Blue
Figure 9. Displacement vectors caused by lossy JPEG compression with 1x1 1x1 1x1 sampling in the image shown in Figure 2 (Mode: Normal)
Figure 10. Displacement vectors caused by lossy JPEG compression with 2x2 1x1 1x1 sampling in the image shown in Figure 2 (Mode: Normal)
REFERENCES
Kaufmann, V. and Ladstädter, R., 2005. Elimination of Color Fringes in Digital Photographs Caused by Lateral Chromatic Aberration, Proceedings of CIPA 2005 XX International Symposium, Turin, Italy, pp. 403-408.
Luhmann, T., Hastedt, H., Tecklenburg, W., 2006a. Modelling of Chromatic Aberration for High Precision Photogrammetry, The International Archives for Photogrammetry and Remote Sensing, Dresden, Germany, Vol. XXXVI, Part 5, pp. 173-178.
Mallon, J. and Whelan, P.F., 2007. Calibration and Removal of Lateral Chromatic Aberration in Images, Pattern Recognition Letters, Vol. 28, No. 1, pp. 125-135.
Hattori, S., Imoto, H., Ohnishi, Y., Ikeda, K., 2011. Chromatic Aberration Compensation for Industrial Vision Metrology, Technical report of IEICE, Multimedia and virtual environment, Vol. 110, No. 457, pp. 225-230.
Luhmann, T., Robson, S., Kyle, S., Harley, I., 2006b. Close Range Photogrammetry, Whittles Publishing, Caithness, pp. 114-129, pp. 364-375.
Matsuoka, R., Asonuma, K., Takahashi, G., Danjo, T., Hirana, K., 2012. Evaluation of Correction Methods of Chromatic Aberration in Digital Camera Images, The ISPRS Annals of the Photogrammetry, Remote Sensing and Spatial Information Sciences, Melbourne, Australia, Volume I-3, pp. 49-55.
McGlone, J.C., Mikhail, E.M., Bethel, J., Eds., 2004. Manual of Photogrmmetry, Fifth Edition, American Society for Photogrammetry and Remote Sensing, Bethesda, MD, USA, pp. 346-349.
Shibuya, M., 2005a. Tutorial of Lens Optics (14), O plus E, Vol. 27, No. 10, pp. 1182-1187.
Shibuya, M., 2005b. Tutorial of Lens Optics (15), O plus E, Vol. 27, No. 11, pp. 1308-1313.
Figure 11. Signed displacements caused by lossy JPEG compression with 1x1 1x1 1x1 sampling in the image shown in Figure 2 (Mode: Normal)
Figure 12. Signed displacements caused by lossy JPEG compression with 2x2 1x1 1x1 sampling in the image shown in Figure 2 (Mode: Normal)