THE ROLE OF REMOTE SENSING FOR SUSTAINABLE ELEPHANT MANAGEMENT
IN SOUTH AFRICA. FOUR MEDIUM SIZED GAME RESERVES AS CASE STUDIES.
M. Jordaan a a
Dept. of Environmental Sciences, University of South Africa, Johannesburg, South Africa - jordam@unisa.ac.za
KEY WORDS: Ecosystem, Change Detection, Management, Monitoring, Multispectral, Classification
ABSTRACT:
Loxodonta africana (African Elephant) are running out of living space so the protection of what space they have is essential. Existing areas of suitable elephant habitat need to be protected not only from human development but from the elephants themselves.
As most elephant populations in South Africa are enclosed and multiplying, there is some increasing cause for concern as the damage caused will escalate and could reach unsustainable proportions. This study examined the utilization of satellite images for the detection of elephant induced ecosystem modification. A pilot study was conducted on four medium sized Game Reserves (each ±30 000 ha) in South Africa. The aim was to ascertain the feasibility of using image analysis as instrument by which Game Reserve managers could assess biodiversity richness, habitat loss, and population-habitat viability.
NDVI as indicator of primary production in vegetation is one of the instruments used to evaluate whether the carrying capacity for elephants of each Game Reserve has been reached and to compare the current biomass with those of previous years. The study also looked at the use of the woody canopy cover as target for change detection analysis.
Spectral characteristics of specific trees species which are known for being preferred by elephants were used to conduct a temporal analysis on satellite images starting from the period when the elephants were re-introduced into each Game Reserve, thus attempting to identify possible impact on the biodiversity of the respective Game Reserves. Images from satellites such as Landsat, SPOT, Quickbird and SumbandilaSAT provided the needed data and maps.
1. INTRODUCTION
1.1. The Elephant Issue
The once abundant, free roaming, African elephant (Loxodonta africana) has dwindled to a mere fraction of their once prolific numbers. Less than 700 000 elephants are estimated to be left in Africa (Blanc, Barnes, Craig, Dublin, Thouless, Douglas-Hamilton, 2007). This has resulted in the African elephant being listed as Cites Appendix 1 throughout most of Africa (In Southern Africa elephants have been reclassified as an Appendix 2 species)
Growing human populations and increasing human-elephant conflict has forced stakeholders to cluster the remaining elephants into relatively small areas (compared to their once unlimited space) Yough & Van Aarde (2011). In South Africa these ‘Reserves’ are protected by means of electrified fencing, preventing the elephants from roaming freely. Within these boundaries they are cut off from their traditional seasonal migration routes, essential natural resources as well as from other elephant populations.
A drawback of the very successful conservation efforts in South Africa is that the elephant numbers in these confined Reserves are indeed increasing at an alarming rate ( Mackey, Page, Duffy & Slotow, 2005) and have exceeded the outdated ‘carrying capacity’ of the larger reserves such as the Kruger National Park (KNP). These growing numbers have instigated remedial action from the KNP managers with processes such as culling and translocation to other reserves (Blanc et al, 2007). These methods were (and still remains) unpalatable to the larger society and new actions were required. The Minister of Environment Affairs and Tourism (DEAT, 2008) has promulgated new norms and standards for elephant management in South Africa. This forced all owners or
custodians of elephant to develop and implement an “Elephant Management Plan” (XXX). This was applicable to all national, provincial and private reserves and parks.
During the 1960’s and 70’s elephants could only found in four areas in South Africa namely: Kruger National Park (±6000 elephants), Addo Elephant Park (± 120 elephants), Knysna Forest (± 25 elephants) and northern KwaZulu/Natal (±200-300 elephants) (Blanc et al, 2007). The last named two areas were the only places where the elephants were still free roaming but due to human-elephant conflict their number were decreasing rapidly.
1.2 Population-habitat viability
“In short, the African elephant is a most attractive species, a ‘flagship’ animal, representing the widespread savannas and woodlands of Africa.” (Mundy, 2006, p588). The overpopulation of elephants in Kruger National Park was at first mitigated by re-locating entire elephant herds to smaller reserves and parks. This included public reserves such as Marakele, Pilansberg, and Mapungubwe as well as private conservation areas such as Welgevonden, Phinda and Thanda. The Management of the medium and small sized reserves were keen to re-locate the KNP elephants due to their popularity as tourist draw cards and to increase tourism revenue.
1.2.1 Elephant characteristics and demographics
Elephants are water-dependent, and drink up to 200 litres per day. An adult elephant may consume up to 170 kg of browse and grass per day, largely perhaps because its digestive ability is so low: only 40% of what is ingested. It is this appetite that has produced the ‘elephant problem’
In 1991 the total area utilized as elephant range comprised of 2.1% of the country and of these 75% where situated in one Reserve namely Kruger National Park which was habitat to 85% of all the country’s elephants. The remaining 25% were 13% other national or provincial reserves and only 12% was privately owned. (Guldemond & van Aarde, 2007)
1.2.2 Elephant impacts on biodiversity/ecosystems
“Not only have elephants got huge appetites, but one of their methods of feeding causes great concern for wildlife managers. Older elephants, particularly bulls, strip bark from trees, break branches, and frequently push over the smaller trees. Culling was seen as the answer to the elephant problem, and in the 1960s such population reduction exercises were started in Uganda, Zambia, the then Southern Rhodesia, and South Africa”. (Mundy, 2006:p590-591)
Elephant herbivory has been the objective of many studies, and as have been shown in some of these studies, elephants at high densities do negatively affect biodiversity (Cumming et al 1997, Western & Gichohi 1989). Coetzee et al. (1979) have already then reported a decline in Sclerocarya birrea (Marula trees) in the Satara area of KNP. – Up to 13% of Marula trees larger than 5m have been lost due to destructive damage by elephant. Eckhardt et al (2000) reported significant decline in large trees in both the granites and basalts of the KNP.
From research done by (Hiscocks, 1999) and (Johnson et al, 1999) it is clear that elephant do have a preference in their palate and that they prefer certain vegetation species above others. The following is a consensus of plant species that are preferred by elephants and also occur in all four the selected study areas: Sclerocarya birrea (Marula tree), Terminalia sericea, Dichrostachys cinerea (Sicklebush), Acasia nilotica, Acasia sieberana, Acasia robusta and Acasia burki. One aspect that can be deduced from this list is that the Acasia spesies are a favourite with elephant.
1.3 Elephant Management Plans
To successfully manage elephants, managers of conservation areas require knowledge about the rates at which their elephant populations may grow and what number and structure of re-located elephant population will be best their long-term conservation needs. (Mackey, Page, Duffy & Slotow, 2005)
Even before the Norms and Standards for elephant management was made into policy (DEAT, 2008) KNP developed a new elephant management policy which differed from the old one in that the elephant population will be managed according to measured impacts on biodiversity rather than on absolute numbers of elephants (carrying capacity).
Managers of conservation areas are concerned that high elephant densities will harm biodiversity by degrading ecosystems (Owen-Smith, 1996; Whyte et al., 2003; Guldemond & van Aarde, 2007). Culling, translocation and birth control are short term solutions and are ethically frowned upon (van Aarde et al., 1999; Pimm & van Aarde, 2001).
The size and structure of a reserve’s desired elephant population will depend on the objectives of that reserve; for example, a reserve being managed for the conservation of biodiversity will want fewer elephants than a similarly sized reserve that stocks elephants for tourism or consumptive use. (Mackey et al, 2005)
1.4 Role of Remote Sensing in Reserve Management
To understand the dimensions of the problem that conservation managers face, Yough & Van Aarde (2011) did research on the practises of the conservation managers in developing an ‘elephant management plan’ as prescribed by the DEAT policy (2008) .Of the 30 managers interviewed, all but one viewed science as an important basis for making decisions on elephant management and the maintenance of biodiversity.
Remote sensing, as a relatively new science, is seen as a useful instrument to assist conservation managers with the development and implementation of their respective elephant management plans.
When using satellite imagery the following aspects need to be considered with the elephant population management as well as general biodiversity base line studies and ecological assessment. • Mapping the vegetation types and possible changes in
biodiversity with regards to specie richness.
• Mapping and detecting the changes that have occurred over time.
• Mapping possible “refugia” sites for endangered species in the Park as well as the changes in the thicket patch and woody canopy sizes over time.
• The possibility of identifying biomass (for carrying capacity and carbon sink potential) using satellite data. • Cost implications of the data needed as well as image
analysis needed in order to get results.
2 STUDY AREAS
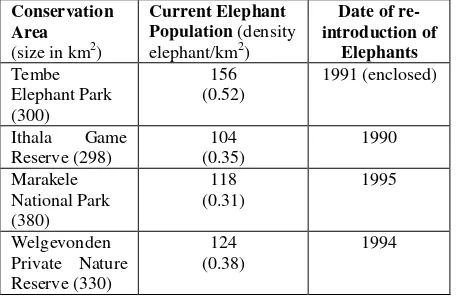
Kruger National Park as flagship reserve in South Africa is (and has been) the focus of research for many years and by many different researchers, not only from South Africa but also from foreign researchers as far afield as the USA, Scandinavia, the UK and even other parts of the world. With all this interest on the largest conservation area there is unfortunately a severe lack of attention on the medium and smaller reserves and parks in South Africa, both private and government owned. This study focuses on four medium sized reserves (± 300km2) listed in Table 1.
Figure 2 indicates the location of each of the reserves within the boundaries of South Africa and as can be seen the four reserves are divided into two zones. The first zone is in the more northern Limpopo province and the two reserves namely Marakele National Park and Welgevonden Private Nature Reserve are situated in a large area for conservation called the Waterberg Biosphere. The second zone is from the KwaZulu/Natal Province but the main reason for the selection of these specific reserves was that they all have been hunted ‘clean’ from all mega-herbivores until 1990s when the translocation from the over-populated Kruger National Park took place and these specific reserves (with the exception of Tembe Elephant Park) were again stocked with elephants. Tembe is the exception since the elephant there are indigenous to that east coast area and the reserve established to protect those elephants from being poached and slaughtered during the civil war period in Mozambique.
Each of these reserves is unique in its purpose, conservation objectives and its management.
Figure 2: Geographical location of the four reserves in South Africa
• Tembe Elephant Park:
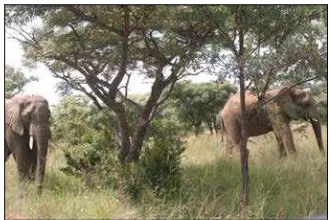
A private eco-tourism reserve owned by local rural community but managed by Ezemvelo KZN Wildlife, the Provincial government’s conservation section. Tembe Elephant Park was originally established to protect the last remaining ‘East Coast elephants’ but has since broaden its objectives by primarily conserving the threatened Sand Forest and the Maputoland centre of plant endemism, unique to the northern KwaZulu/Natal east coast. Their second priority is the elephants and the third is the protection of the ‘Suni’ a rare and highly endangered small antelope. As can be seen from Figure 3 below the area is reasonably densely vegetated with patches of large Sand Forest trees and undergrowth.
Figure 3: Tembe Elephant Park (Source M Jordaan, 2011)
• Ithala Game Reserve:
Ithala is a public owned conservation area, managed by the KwaZulu/Natal provincial government’s Ezemvelo KZN Wildlife. Ithala was originally an amalgamation of a few large
game farms that were sanctioned into a Reserve in 1982. Ithala differs from Tembe in that it represents the interior ‘bushveld’ ecosystems found between the high Drakensberg mountain range and the coast. The conservation objectives of Ithala are firstly to restore and conserve the natural biodiversity and ecological processes including the influence of the altitudinal gradient (see Figure 4). Secondly to conserve conserve Red Data species including: Warburgia salutaris, Eugenia simmii and the rare Protea comptonii communities. Thirdly to maintain viable populations of black rhinoceros, white rhinoceros, tsessebe and oribi as priority species.
Figure 4: Ithala Game Reserve (Source M Jordaan, 2011)
• Marakele National Park:
Marakele National Park is managed by SANparks, South African Parks Board. Established in 1988 with the conversion of a small provincial reserve aptly named Kransberg (Cliff Mountain) and including a few adjacent hunting farms to form the original reserve but has since been enlarged with the addition of more farms to be 38000ha in size. The main conservation objective for Marakele National Park is to maintain its biodiversity in all its aspects and fluctuations. Figure 5 illustrate the mountainous terrain of Marakele as seen from the south.
Figure 5: Marakele National Park (Source M Jordaan, 2011)
• Welgevonden Private Nature Reserve
Welgevonden Private Nature Reserve is as the name indicates owned by private individuals and companies with a large portion of the luxury lodges developed on the reserve, owned by foreign investors. These 14 lodges cater for tourists (mainly foreign) and therefore determine the conservation objectives for Welgevonden. As a tourist destination the conservation objectives focus mainly on maintaining viable populations of the “big five”. Sustain a functioning local ecosystem and contribute to the conservation of the larger Waterberg Biome.
The four reserves used for the research were selected based on similar characteristics which are fundamental for comparative research studies. The similarities of the four reserves used in the pilot study are as follows:
• Firstly, the size of each of the conservation areas are ± 300km2 classing them all into the medium sized category for conservation areas (250-500 km2).
• The second similarity is the elephant population numbers ranging from 100+ and with proper elephant management plans in place these numbers are set to stabilize and remain within the prescribed parameters set out by the National Norms and Standards policy (DEAT, 2008). This relates to an average elephant density of 0.39 elephants/ha.
• The third similarity is the duration of elephant occupation. This is determined by the date of relocation of the elephants to each individual reserve and for Tembe, the date of enclosure from Mozambique. All the reserves have thus been exposed to the impact of elephant forage for an extended and continuous period of 15 years or more.
Comparing the impact of elephants are further extended by the fact that all four the conservation areas have basically similar vegetation types. There are also some tremendous differences in that Marakele and Ithala are both extremely mountainous with deep valleys and steep cliffs (figures 4&5). Tembe is however the opposite, in that it is very flat with only a slight undulations. Welgevonden is also in the mountains but does not have the steep cliffs and deep valleys and is situated on the higher more central region of the Waterberg.
3 ANALYSIS
3.1 Rationale
“Most conservation practitioners rely on experience-based information for management decisions. In South Africa, government policy thus directs managers to base decisions for elephant management on the best available scientific information”. (Young & Van Aarde 2011, p 876).
The research is rooted in the requirement of these smaller reserves to acquire much needed information on a regular basis over the whole extent of the reserve. Remote sensing and the use of satellite images are therefore ideal for this endeavour except for the fact that the reserve managers usually do not have the expertise to do the satellite image analysis and to use GIS for further enhanced spatial analysis.
The first stage and pilot project of the research had the objective of illustrating to the reserve managers and conservation decision makers, the potential of satellite imagery and to demonstrate the advantages (and limitations) of imagery as a source of management information. These included the capabilities related to the temporal, spectral and to a smaller extend the spatial resolutions associated with universally available satellite imagery.
3.2 Method
For the pilot phase of this research Landsat 5 and 7, SPOT 4, Quickbird and where possible Sumbandilesat images for each reserve were collected. Two of the images were from the date when the elephants were first relocated (for Tembe when first fenced in). The one image was selected to be from the summer (rainfall season) and one from winter (dry season).
To start the research spectral scans were done on those vegetation types identified previously as favourite forage for
elephants. A hand-held multispectral radiometer was used (figure 8) to scan individually selected samples of each of the tree species. This multispectral radiometer was specifically designed and calibrated to scan spectral bands that correspond exactly with those of Landsat and SPOT as indicated in Table 7.
Table 7: Wavelengths used to correspond with TM from Landsat and SPOT
WAVELENGTHS SELECTED Green
(low) Green
(low)
Yellow Red (low)
Red (high)
Near Infrared
(low) NIR (middle)
NIR (high)
530nm 560nm 580nm 630 nm
670 nm 800nm 840 nm 890 nm
The scanning was done to resemble a passage from Landsat in that it was done at a time similar to when Landsat would have passed and from a direction corresponding to that of a Landsat orbit angle.
Figure 8: Scanning Dichrostachys cinerea with the multispectral radiometer. (Source M Jordaan, 2011)
4 RESULTS
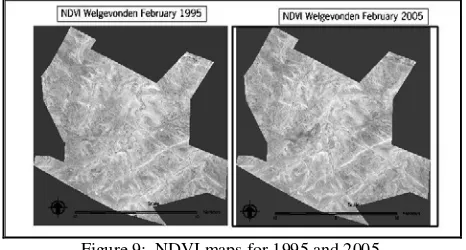
NDVI was run on all the multispectral images for all four the reserves. Using Marakele to illustrate the process, two images taken over summer ten years apart are shown in Figure 9. Note that the areas with higher values (more biomass) in the later image are predominantly within the lower lying Marakele National Park. Interestingly this correlates exactly with the area classified as Western Sandy Bushveld vegetation type (Mucina & Rutherford, 2006).
Figure 9: NDVI maps for 1995 and 2005.
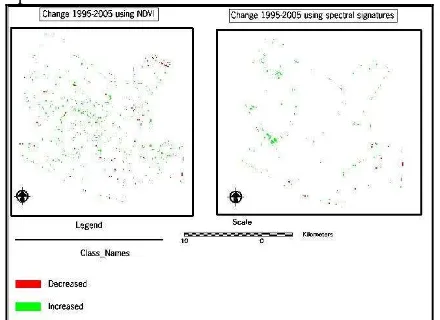
corresponding pixels in the old image (before elephant impact image = 1995). The comparison is based on a 25% change in the NDVI value per pixel and if the was a change of more than 25% the relevant pixel is green (if there was an increase) and red (if there was a decrease).
A similar process was done on the digital numbers of the spectral bands of the satellite images directly (Landsat bands 2, 3 and 4 were used) and again if a change of more than 25% was detected per corresponding pixel, it was coloured green for an upwards increase in value and red if the was a decrease. Figure 10 shows the changes detected using Landsat band 4 as NIR was found to be the most predominant indicator of vegetation.
Figure 10 illustrates the changes detected (25% or more per pixel) when the two NDVI images were compared and also when the two satellite images using spectral band 4 were compared.
Figure 10: Changes by NDVI versus Changes by reflectance value
Marakele National Park does not show much change with exception to some uniform black areas (figure 9) that may indicate fire events rather than a decrease in vegetation. Welgevonden, Tembe and Ithala also indicated patches of darker area but these are not likely to be fire related as it is not uniform. These darker areas are suspected to be caused by elephant browsing. Overall the later image (figure 9) appears lighter which would indicate an increase in vegetation over the area rather than a decrease. Rainfall data indicated both years to have been relatively dry but the preceding year has been a relatively wet year for Welgevonden. As commonly understood NDVI is used indicator of biomass and of vegetation production which is directly linked to rainfall, so the rainfall figures for the areas surrounding the four reserves were scrutinized to determine possible NDVI increases.
5 DISCUSSION
Wessels et al. (1999) indicates that the relationship between remotely sensed measures of landscape and biological diversity is valuable in terms of biodiversity assessments and is beginning to be used as an important tool in integrated approaches to biodiversity assessment and conservation. The use of remote sensing has been found to be a successful method of determining vegetation change over time while also providing reliable information on vegetation composition (Liu et al, , 2008, Brink & Eva, 2008 and 2005Akasheh et al.).
However the results from this study initially appear inconclusive. The change detection image generated suggests that the vegetation in Welgevonden has decreased over a ten year period, but there has been little change in Marakele.
Change detection for Tembe indicates changes in the Coastal bushveld and shrubveld but very little in the threatened ‘Sand Forest’. Ithala however has had severe changes but this can be contributed to their dedicated fire regime (Bigwood, T. personal communication, December 04, 2010)
A similar study done by Guldemond & Van Aarde (2007) who conducted a study looking at what they classified ‘Woodlands’ (basically ‘Tembe Sandy Bushveld’ and ‘Sand Forest’) comparing these woodlands inside ‘Tembe Elephant Park’ and at intact vegetation communities outside the Park. Three representative sampling sites were selected inside and outside the Park where quadrants (16*16 m) were used to record the number, species and structure of vegetation. Their study concluded that the elephants in Tembe Elephant Park fed on seven main species (Acacia burkei, Afzelia quanzensis, Albizia adianthifolia, Dialium schlechteri, Maniklara discolour, Sapium integerrimum and Spirostachys africanum). These species occur at low numbers within the Sand Forest and are more common in ‘Tembe Sandy Bushveld’. Using remote sensing alone as instrument to determine elephant impact can also be misleading in that at Tembe the elephant do not impact severely on the endangered Sand Forest but they do create openings for the smaller antelopes such as Nyala (Nyala angasi) and Kudu (Tragelaphus strepsiceros). (Mathews, W. personal communication, April 2009). These antelopes then destroy the undergrowth and lower branches but not the larger trees and tree canopy. Therefore there is little immediate change to the vegetation but in the long run there is no succession as al the seedlings have been foraged by the antelopes.
This study indicates (1) the value of NDVI variability as an indicator of landscape heterogeneity and biological diversity, and (2) the potential of integrating vegetation data from vegetation maps with the NDVI information to indicate landscape patterns of biological diversity.
At an annual increase of 7% the populations in the four reserves would have a density of ±2.15 elephants per km². This would lead to huge losses in biomass and likely diversity as well, as shown in Sengwa Wildlife Research Area where there was a reduction of 45% in biomass of woodland species over a five year period (Cumming 1981) when the elephant population density was at a similar level to what the population could be in the four reserves by 2020, if the elephant population grows at 7% per annum.
Management of the four reserves used in the study, in particular but all reserves conserving elephants, will need to decide whether they want to manage according to biodiversity or whether they want to manage to the elephants needs. Various management actions could include culling, contraception of female elephants or possible vasectomies of elephant bulls (this has been done successfully at Welgevonden Private Nature Reserve).
6 REFERENCES
Akasheh, O.Z., Neale, C.M.U. and Jayanthi, H., 2008. Detailed Mapping of Riparian Vegetation in the Middle Rio Grande River using High Resolution Multi-Spectral Airbourne Remote Sensing. Journal of Arid Environments, 72, 1734-1744.
Blanc, J.J., Barnes, R.F.W., Craig, G.C., Dublin, H.T., Thouless, C.R., Douglas-Hamilton, I. & Hart, J.H., 2007. IUCN African Elephant Status Report: An update from the African Elephant Database. IUCN.
Brink, A.B. and Eva, H.D., 2008. Monitoring 25 Years of Land Cover Change Dynamics in Africa: A Sample Based Remote Sensing Approach. Applied Geography, 1-12.
Coetzee, B.J., Engelbrecht, A.H., Joubert, S.C.J P. & Retief, F., 1979. Elephant impact on Sclerocarya Caffra trees in Acacia Nigrescens tropical plains Thornveld of the Kruger National Park. Koedoe, Vol 22.
Cumming, D.H.M., Fenton, M.B., Rautenbach, I.L., Taylor, R.D., Cumming, G.S., Cumming, M.S., Dunlop, J.M., Ford, G.A., Hovorka, M.D., Johnston, D.S., Kalcounis, M., Mahlangu, Z. & Portfors, C.V.R., 1997. Elephants, woodlands and biodiversity in southern Africa. South African Journal of Science 93: 231-236.
Department of Environmental Affairs and Tourism (DEAT)., 2008. National Norms and Standards for the Management of Elephants in South Africa. Pretoria: DEAT.
Gould, W., 2000. Remote Sensing of Vegetation, Plant Species Richness, and Regional Biodiversity Hotspots. Ecological Applications, Vol. 10, No. 6. pp. 1861-1870.
Guldemond, R.A.R. & Van Aarde, .RJ., 2007. The impact of elephants on plants and their community variables in South Africa’s Maputaland. African Journal of Ecology, 45, 327–335. Hiscocks, K., 1999. The impact of increasing elephant population on woody vegetation in southern Sabi Sand Wildtuin, South Africa. Koedoe: 42/2, 47-55
Johnson, C.F., Cowling, R.M. & Phillipson, P.B., 1999. The Flora of the Addo Elephant National Park, South Africa: are threatened species vulnerable to elephant damage? Biodiversity and Conservation 8: 1447-1456
Liu, Q.J., Li, X.R., Ma, Z.Q. and Takeuchi, N., 2005. Monitoring Forest Dynamics Using Satellite Imagery – A Case Study in the Natural Reserve of Changbai Mountain in China.
Forest Ecology and Management, 210, 25-37.
Mackey, R.L, Page, B.R.,. Duffy, K.J & Slotow, R., 2006. Modelling elephant population growth in small, fenced, South African reserves. SA Journal of Wildlife Research. 36: 33-43.
Mathews, W., 2009. Personal communication, April 2009.
Mucina, L. & Rutherford, M.C., (eds), 2006. The Vegetation of South Africa, Lesotho and Swaziland. Strelitzia 19. South African National Biodiversity Institute, Pretoria.
Mundy, P.J., 2006. 'The African elephant - something to cherish and to use', International Journal of Environmental Studies, 63:5, 587 – 597
Owen-Smith, R.N., 1988, Megaherbivores: The Influence of Very Large Body Size on Ecology: Cambridge University Press, Cambridge.
Owen-Smith, N., 1996. Ecological guidelines for water points in extensive protected areas. South African Journal of Wildlife Resources, 26, 107–112
Pimm, S.L. & Van Aarde, R.J., 2001. Population control: African elephants and contraception. Nature, 411, 766.
Van Aarde, R.J., Whyte, I. & Pimm, S.L., 1999. Culling and the dynamics of the Kruger National Park African elephant population. Animal Conservation, 2, 287–294.
Wessels, K.J., Freitag, S. & van Jaarsveld, A.S., 1999. The use of land facets as biodiversity surrogates during reserve selection at a local scale. Biological Conservation 89:21-38.
Western, D. & Gichohi, H., 1989. Segregation effects and the impoverishment of savannah parks: the case for ecosystem viability analysis. African Journal of Ecology 31: 269-281.
Whyte, I.J., Biggs, H.C., Gaylard, A. and Braack, L.E.O., 1999. A new policy for the management of the Kruger National Park’s elephant population. Koedoe 42 : 111–132.
Whyte, I.J., Van Aarde, R.J. & Pimm, S.L., 2003. Kruger’s elephant population: its size and consequences for ecosystem
heterogeneity. In The Kruger Experience: Ecology and
Management of Savanna Heterogeneity (eds J.T. du Toit, H. Biggs & K. Rodgers), pp. 332–248. Island Press, Washington, DC, USA.