QUANTITATIVE ASSESSMENT OF DIGITAL TOPOGRAPHIC DATA FROM
DIFFERENT SOURCES
N. Yastıklı a , F. Esirtgen b, U. G. Sefercik c a
YTU, Department of Geomatic Engineering, Davutpasa Campus, 34210, Istanbul, Turkey -
[email protected] bMescioglu Engineering and Consulting Co. Inc., Ankara, Turkey -
[email protected] cZKÜ, Department of Geodesy and Photogrammetry Engineering, Zonguldak, Turkey -
[email protected]ISPRS WG I/4, III/4, IV/2, VII/2
KEY WORDS: Accuracy, Quality, DEM, Quality, Photogrammetry, Remote Sensing, SAR, SPOT
ABSTRACT:
This study includes the quantitative assessment of digital topographic data of the terrain from photogrammetric methods, satellite imaging and RADAR techniques in test side in Istanbul. The side area covers 10 x 10 km2 and includes five different land cover types. The 3 m sampled DEM, which was produced by 1/1000 scaled photogrammetric maps is used as reference and tested against the 94 Ground Control Points (GCP). The 5 m and 30 spacing DEMs derived from 1/5000 scaled photogrammetric maps are used as test data sets as well as 20 m spacing SPOT DEM and 80 m spacing ASTER DEM. Besides, 90 m spacing DEM generated from InSAR technique with SRTM mission was also used as test data. The quantitative assessment of all DEMs were performed and reported based on FEMA and NDEP specifications. The quantitative assessment was carried out for open terrain (%19), forest (%15), built-up areas (%32), scrub and bushes (%26), and rough terrain (%8). The accuracy assessment and quality analyses had been conducted for each terrain classes to reflect the quality with more suitable approach. The 3 m spacing reference DEM is tested against the 94 GCP and obtained Root Mean Square Error (RMSE) for Z was in the range of 0.85 m (open terrain) to 1.94 m (rough terrain) for different terrain classes and 1.45 m using all terrain classes. The more than 20 GCP was available for each terrain classes for quantitative assessment of DEMs. As a result of quantitative assessment, RMSE Z of tested DEMs from photogrammetric methods, satellite imaging and RADAR techniques were computed for each land cover types based on international standards. It is no surprise that, the DEM from photogrammetry were more accurate than the DEM from satellite imaging (SPOT, ASTER) and RADAR (SRTM). As expected, open terrains have better results than the other classes like forest, scrub, built-up and rough terrain for all DEMs. The accomplished results of the quantitative assessment demonstrated the importance of the data source, resolution, and production methods of DEMs. The terrain class is important factor and can not be disregarded in quantitative assessment of digital topographic data.
1. INTRODUCTION
The digital topographic data of the terrain is represented by Digital Terrain Model (DTM), Digital Elevation Model (DEM) and Digital Surface Model (DSM). DEM is the most popular digital topographic data implies the elevation of the terrain (bare earth) with regularly spaced intervals in X and Y. DTM is used as synonym with DEM, the elevation of significant topographic features like mass point and break lines are used to characterize shape of bear earth terrain in addition to uniformly spaced z values. DSM is the same with a DEM or DTM but depicts the elevation of the top surfaces of the object including building, trees and tower etc. The concept of DEM was introduced in 1950s. Although photogrammetry was used as a data collection method in early applications mostly, today different techniques have been applied for DEM generation including satellite images (Iscan, 2005, Kaczynski vd., 2004), Radio Detection and Ranging (RADAR) (Sanlı, 2006, Sefercik, 2010) and Light Detection and Ranging (LiDAR) (Yastıklı vd., 2007) technologies.
The photogrammetry and LiDAR are the techniques preferred for larger scale local application with their higher accuracy. The significant advances in remote sensing technologies enable the production of high quality global DEM such as Shuttle Radar Topography Mission (SRTM) C band and X band DEM, SPOT DEM and ASTER DEM. Today, DEM is used wide range of applications and represented by different form (Maune, 2007,
McGlone, 2004, Yastıklı ve Jacobsen 2003, Yastıklı, 2009). The quantitative assessment of DEMs from different source and technologies is still popular research topic (Erdogan, 2007, Esirtgen 2011, Li, 1994, Bolstad vd., 1994). The production of DEMs with different methods has reached certain standard but quantitative assessment procedures differ for each country in the term of accuracy assessment and quality analyses. The general standard for photogrammetric map production is in use in most of the countries like in Turkey. There isn’t any comprehensive production standard related to the DEM quality assessment in Turkey. The detailed procedures can be found in USA which is specified by the user including the Federal Emergency Management Agency (FEMA) and National Digital Elevation Program (NDEP) for quantitative assessment of DEMs. These agencies asses the products based on these standards and regulations (ASFLSM, 1990, GFDED, 2004, GFAMAS, 2003, NMAS, 1947, NSFSDA, 1998).
In sections to follows, the international standards and regulations used for quality assessment have been summarized and Istanbul test field and dataset were expressed. Then quantitative assessment of DEMs from different source was given. The obtained results were reported in detail and analysed.
2. ACCURAY STANDARDS
The specifications and accuracy standards for quantitative assessment of DEMs are summarized which are based on US National Standards. These national standards include the National Map Accuracy Standards (NMAS), ASPRS Accuracy Standards Large Scale Map, Federal Geographic Data Committee (FGDC), Federal Emergency Management Agency (FEMA) and National Digital Elevation Program (NDEP).
2.1
2.2
2.3
2.4
2.5
National Map Accuracy Standards (NMAS–1947)
• Maximum 10 percent of the elevations tested should be in the error more than the half of the contour interval,
• The test points must be well defined.
ASPRS Accuracy Standards for Large Scale Maps (ASPRS-1990)
• Vertical map accuracy is defined as the Root Mean Square Error (RMSE) in the vertical datum for well defined points,
• The limiting RMSE in the elevation set by the one-third the indicated contour interval for well defined points,
• Maps divided into 3 groups according to their qualities:
- Class 1. the accuracy in the elevation within the limiting RMSE,
- Class 2. the accuracy in the elevation within twice the limiting RMSE,
- Class 3. the accuracy in the elevation within three times the limiting RMSE.
FGDC Geospatial Positioning Accuracy Standards (FGDC-1998)
• Vertical accuracy should be tested by comparing the elevations in the data sets with the elevations of the same points from an independent source of higher accuracy the comparison between the reference data and test data,
• A minimum of 20 check points should be tested which is well distributed in project area,
• 95 % confidence level allows one check point (total 20 check points) to fail,
• It has been assumed that the systematic errors have been eliminated,
• If the vertical error is normally distributed, the factor 1.96 is applied to compute linear error at 95 % confidence level. AccuracyZ=1.96*RMSEZ
Guidelines and Specifications for Flood Hazard Mapping Partners (FEMA-2003)
• The accuracy assessment should be made and reported separately for each major land cover categories,
• The minimum of 20 check points must be selected for each major land cover categories,
• The check points should be selected in flat or uniformly slopped within 5 meters in all directions, • The slope mustn’t exceed 20 %.
Guidelines for Digital Elevation Data (NDEP-2004)
• The FEMA specifications have been developed and specification about the DEMs from LiDAR and IfSAR has been attached.
• The check points determined by an independent source of higher accuracy should be at least three times more accurate then the data set being tested, • At least 20 ground control points are required for each
land class.
• Reporting of quantitative assessment has been developed.
3. TEST SIDE AND DATA SETS
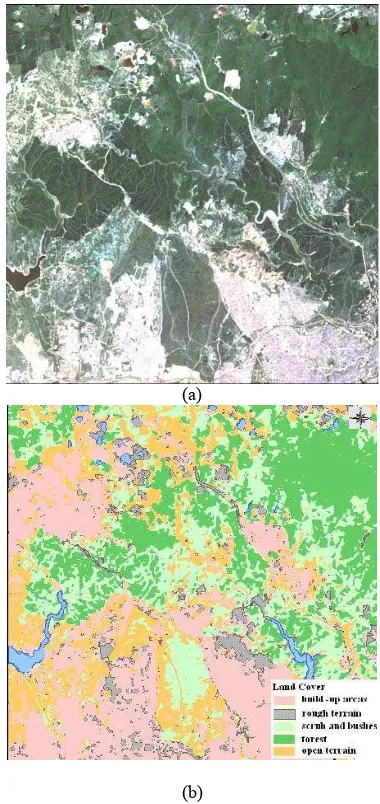
The test side occupies the area of 10x10 km² including Gaziosmanpaşa, Küçükçekmece, Esenler and Eyüp district of Istanbul, Turkey. This area has been chosen because it contains the five different land covers types which includes open terrain (%19), forest (%15), built-up areas (%32), scrub and bushes (%26), and rough terrain (%8). The test side and land cover types can be seen in Figure 1.
(a)
(b)
Figure 1. The test side in Istanbul (a) and land covers types (b)
The data sets used for quantitative assessment of digital topographic data were listed below based on production methods:
Produced by stereo photogrammetry,
• DEM produced by 1/1000 scaled map (2009) • DEM produced by 1/5000 scaled map (2008) Produced by stereo satellite imaging,
• SPOT DEM • ASTER DEM Produced by InSAR techniques,
• SRTM C-BAND DEM (2000) Control points,
• C1, C2, C3 degree GPS network points.
The land cover types were obtained by classification of Landsat satellite images which were used for separate analysis for each terrain classes.
(a) (b) (c)
Figure 2. DEM data set DEM1000 (a), DEM5000–30 (b), DEM5000–5 (c)
4. QUANTITATIVE ASSESMENT OF DEMs
The systematic shift between reference and test data set were checked before quantitative assessment of DEMs. The DEMSHIFT module of BLUH program system developed by Dr. Karsten Jacobsen has been used. The computed shift values between test data set and reference data set are given in Table 1. The test data set were shifted based on computed shift values.
Table 1. DEM shift values
DEM5000–30 DEM 1000 0.503 17.867
DEM5000–5 DEM 1000 2.95 -5.72
SPOT DEM 1000 -6.17 -4.63
ASTER DEM 1000 19.59 -31.26
SRTM DEM 1000 -0.54 -16.28
The quantitative assessment was performed by DEMANAL module of the BLUH program system. The 3 m spacing DEM derived from 1/1000 scaled digital photogrammetric maps has been used as the reference data, and assessed against the control points. According to the NDEP instruction, an independent reference data with high accuracy is required for the quality control of the DEM and the reference data should be 3 times more accurate than the tested data. It has been defined in instructions like NDEP and FEMA that at least 20 test points
are required for each terrain class for assessment of vertical accuracy. If these requirements are provided, quantitative assessment will be conducted and reported in 95% confidence level based on instructions and standards mentioned previous sections.
The test side were extended to an area of 20km² to supply the NDEP and FEMA requirement that at least 20 test points are required. The 94 control points from GPS network (C1, C2 and C3 types) have been used for the accuracy analysis of the reference data. The RMSEZ of the reference DEM (SYM1000) was 1.45 m for all land cover types. Subsequently, separate analyses have been performed for each land cover types. The Table 2 shows the result of accuracy analyses of the 3 m spaced reference DEM from photogrammetry (DEM1000) by using control points from GPS network.
Table 2. Accuracy Analysis of DEM 1000
Number
As expected, the highest accuracy was obtained for open areas. In forests where the vegetation was dense and the accuracy was the lowest. From the results, the RMSEZ value of the DEM has increased due to the restrictions in defining the terrain surface caused by the scrubs, forests, the buildings or the other human-made objects in built-up areas.
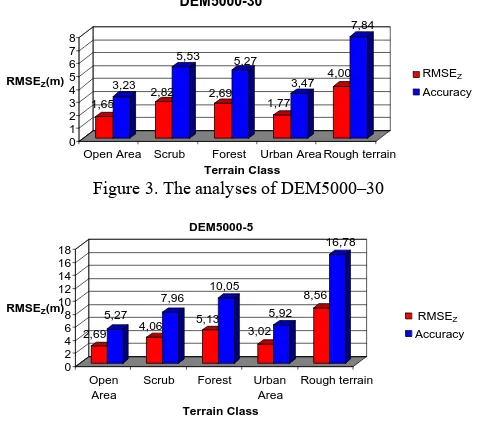
The DEM with 30 m grid spacing derived from 1/5000 scaled photogrammetric map (DEM 5000-30) were assessed against the reference DEM (DEM 1000). The photogrammetric DEM with 5 m grid spacing (DEM 5000-5), which were produced by interpolation using 30 m grid spacing photogrammetric DEM, were assessed also against the reference DEM. The computed RMSEZ and accuracy for different terrain classes have been given in Figure 3 and Figure 4.
Figure 3. The analyses of DEM5000–30
Figure 4. The analyses of DEM5000–5 1,65
Open Area Scrub Forest Urban Area Rough terrain
Terrain Class
The RMSEZ of the DEM5000- 5 which was produced by interpolation from 1/5000 scaled photogrammetric map (same data source with DEM5000–30) approximately two times poorer then DEM5000–30 for all terrain classes. The high RMSEZ can be explained by grid size for interpolated DEM, which were higher in comparison to 1/5000 scaled photogrammetric map. Considering the RMSE value of the rough terrain, it seems that sudden changes in the elevation and the rough topography increase the RMSEZ.
The 20 m grid spacing SPOT DEM and 80 m grid spacing ASTER DEM derived from the stereo satellite image have also been assessed against the reference DEM. The computed RMSEZ and accuracy for different terrain classes can be seen in Figure 5 and Figure 6.
Figure 5. SPOTDEM analyses according to the classes
Figure 6. ASTERDEM analyses according to the classes
Considering the results of the analysis, the obtained RMSEZ and accuracy is higher then photogrammetric DEMs but same tendency can be seen for different terrain classes. The highest accuracy was obtained in open areas and the lowest in rough terrain.
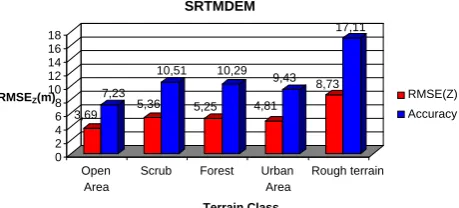
Finally, the 90 m grid spacing SRTM90 DEM produced by InSAR technique with SRTM mission (C-Band) were assessed and results were given in Figure 7.
Figure 7. SRTM DEM analysis according to the classes
The obtained accuracy from 90 m grid spacing SRTM DEM is more accurate than the 80 m grid spacing ASTER DEM almost same with 20 m grid spacing SPOT DEM. This can be explained by the fact that the data from ascending and descending orbits were used for generation of SRTM DEM. The relation between the accuracy of DEMs and RMSEZ has been defined in 95% confidence level by “Accuracy (Z) = RMSEZ x 1,96”, when the errors follow the normal distribution.
The RMSEZ and accuracy were computed for test data set for each terrain based on reference DEM. The next step is the reporting of quality assessment and analyse of accuracy. One of most important item is the fundamental vertical accuracy. The NDEP defines the different vertical accuracy for each terrain classes. The term “Fundamental Vertical Accuracy” (FVA) is calculated in open terrain, “Supplemental Vertical Accuracy” (SVA) is calculated in other individual terrain classes and “Consolidated Vertical Accuracy” (CVA) is calculated all terrain classes combined.
The reports for FVA and SVA for photogrammetric DEMs with 30 m grip spacing (DEM5000-30) as:
“Tested 3.23 m fundamental vertical accuracy at 95 percent confidence level in open terrain using RMSEZ x 1,96”.
“Tested 5.53 m supplemental vertical accuracy at 95 percent confidence level in scrub and bushes using RMSEZ x 1,96”
“Tested 5.27 m supplemental vertical accuracy at 95 percent confidence level in forested using RMSEZ x 1,96”
Open Area Scrub Forest Urban Area
“Tested 3.47 m supplemental vertical accuracy at 95 percent confidence level in build-up areas using RMSEZ x 1,96”
5.
CONCLUSION
In this study, the quantitative assessment of DEMs from different source were performed and reported based on FEMA and NDEP specifications. The quantitative assessment was carried out for open terrain (%19), forest (%15), built-up areas (%32), scrub and bushes (%26), and rough terrain (%8) separately. The accuracy assessment and quality analyses had been conducted for each terrain classes to reflect the quality with more suitable approach.
The 3 m spacing reference DEM is tested against the 94 GCP and obtained RMSEZ for Z was in the range of 0.85 m (open terrain) to 1.94 m (rough terrain) for different terrain classes and 1.45 m using all terrain classes. The more than 20 GCP was available for each terrain classes for quantitative assessment of reference DEM. The reference DEM should be at least three times more accurate then the data sets being tested base don the NDEP specifications. The shifts between 5 m and 30 m spacing photogrammetric DEM, 20 m spacing SPOT DEM, 80 m spacing ASTER DEM and 90 m spacing SRTM C bad DEM were determined then quantitative assessment was performed. The determined RMSEZ was in the range of 2.69 m to 8.56 m for 5 m spacing photogrammetric DEM but for 30 m spacing photogrammetric DEM it was in the range of 1.65 m to 4 m for different terrain classes. These results illustrates that, the resampling of DEM to smaller grid spacing from same source do not improves the accuracy even inferior than original grid 3,69
size. The computed RMSEZ was varying 4.25 m to 9.12 m for 20 m spacing SPOT DEM and 6.65 m to 9.96 m for 80 m spacing ASTER DEM. The achieved RMSEZ was between 3.69 m to 8.73 m for 90 m spacing SRTM C band DEM which is better than 80 m spacing ASTER DEM. This situation can be explained by ascending and descending orbital passes of SRTM in contrast to larger grid size.
As expected, open terrains have better results than the other classes like forest, scrub, built-up and rough terrain for all DEMs. These results underline the fact that open areas are reflecting the surface in most suitable way. The lower accuracy at forests, scrubs and urban areas can be explained by the difficulties with having points on terrain surface because of the terrain coverage. Another important issue is the reporting of quality assessment and analyse of accuracy and should be done for each terrain classes.
The accomplished results of the quantitative assessment demonstrated the importance of the data source, resolution, and production methods of DEMs. The terrain classes are an important factor and can not be disregarded in quantitative assessment of digital topographic data. The internationally accepted detailed procedures and standards are required for quantitative assessment of DEMs for different data source and production methods for the countries like in Turkey.
6. REFERENCES
ASFLSM, Accuracy Standards For Large Scale Map, (1990), The American Society for Photogrammetry and Remote Sensing, U.S.A.
Bolstad, P.V. ve Stowe T., 1994, “An Evaluation of DEM Accuracy: Elevation, Slope and Aspect”, Photogrammetric Engineering and Remote Sensing, 60(11), pp.1327-1332.
Erdoğan, M.. (2007), “Investigation of Digital Elevation Model Standarts According to Source and Quality of Data and Production Method”, Istanbul Technical University Institute of Science and Technology PhD Thesis, Istanbul.
Esirtgen, F., (2011), “Quality Assessment and Accuracy Analysis of Digital Elevation Models”, Yildiz Technical University Institute of Science and Technology MSc Thesis, Istanbul.
GFDED, Guidelines for Digital Elevation Data, (2004), National Digital Elevation Program, U.S.A.
GFAMAS, Guidance for Aerial Mapping and Surveying, (2003), Guidance for Flood Hazard Mapping Partners, U.S.A.
İşcan, L., (2005), Investigation of Orthophoto Production With The Use of Ikonos Imageryı”, Yildiz Technical University Institute of Science and Technology MSc Thesis, Istanbul.
Kaczynski, R., Majde, A., Ewiak, I., (2004). “Accuracy of DTM and Ortho Generated from Ikonos Stereo Images”, ISPRS-2004 Congress, Istanbul.
Li Z., (1994), “A Comparative Study of The Accuracy of Digital Terrain Models (DTMs) Based On Various Data Models”, ISPRS Journal Of Photogrammetry And Remote Sensing, 49(1), pp.2-11.
Maune D. F., (Editor) (2007), Digital Elevation Model Technologies and Applications: The Dem Users Manual” American Society for Photogrammetry and Remote Sensing, USA
McGlone J.C. (2004), “Manuel of Photogrammetry Fift Edition” American Society for Photogrammetry and Remote Sensing, ASPRS,USA.
NMAS, National Map Accuracy Standards,(1947) U.S. Bureau Of The Budget, U.S.A
NSFSDA, National Standards for Spatial Data Accuracy, (1998), U.S. Federal Geographic Data Commite, U.S.A
Öztürk, E.. (2006) “Accuracy Assessment of Digital Elevation Models, Produced in Different Scale From Different Sources by Using Various Techniques”, Zonguldak Karaelmas Üniversity Department of Geodesy and Photogrammetry Engineering, MSc Thesis, Zonguldak
Sefercik U.,(2010), “Generation and Evaluation of DEMs Derived by TerraSAR-X InSAR Images”, Zonguldak Karaelmas Üniversity Department of Geodesy and Photogrammetry Engineering, MSc Thesis, Zonguldak
Şanlı, F.. (2006), “Accuracy Assessment of Radargrammetric DEM Generation From Radarsat F1-F5 Images”, Journal of HKM Jeodezi Jeoinformation and Land Management, 2006/1 Vol 94
Yastıklı N., Jacobsen K., (2003), “Automatic Digital Elevation Model Generation, Problems and Restrictions in Urban Areas”, Journal of YTU Vol:2003-2, pp:38-46
N. Yastikli, C. Toth, D.A. Grejner-Brzezinska, (2007), “In-situ Camera and Boresight Calibration with LiDAR Data”, Proc. The Fifth International Symposium on Mobile Mapping Technology(on CD), MMT’07 28-31 May, Padua, 2007.
Yastıklı, N.. (2009) Digital Elevation Models Lecture Notes” (In Turkish), Yildiz Technical University, Department of Geodesy and Photogrammetry Enginnering