COMPARISON OF GOSAT CAI AND SPOT VGT NDVI DATA WITH DIFFERENT
SEASON AND LAND COVER IN EAST ASIA
Yang LIU a, *, Xiufeng WANG b, Meng GUO a, Hiroshi TANI b
a Graduate School of Agriculture, Hokkaido University, 060-0808, Sapporo, Japan - (liuyang,
guomeng)@env.agr.hokudai.ac.jp
b Research Faculty of Agriculture, Hokkaido University, 060-0808, Sapporo, Japan – (wang, [email protected]
ISPRS, WG IV/1
KEY WORDS: Comparison, Correlation, Data, Remote sensing, Satellite
ABSTRACT:
The Normalized Difference Vegetation Index (NDVI) has become one of the most widely used indices in remote sensing applications in a variety of fields. Many studies have compared the NDVI values for different satellite sensors. Nowadays, the Greenhouse Gases Observing Satellite (GOSAT) was successfully launched on January 23, 2009. It is used to monitor greenhouse gases on the Earth’s surface and also has a sensor, the Cloud Aerosol Imager (CAI), that senses red and near infrared spectrums. It can also process NDVI data. Therefore, we are first compare GOSAT CAI and SPOT VGT NDVI data in different seasonal and land cover in East Asian, to explore the relationship between the two types of datasets, and to discuss the possibility of extending SPOT VGT data using GOSAT CAI NDVI data for the same area. We used GOSAT CAI Level 3 data to derive 10–day composite NDVI values for the East Asia region for November 2009 and January, April and July 2010 using the maximum value composite (MVC) method. We compared these values with 10–day composite SPOT VGT NDVI data for the same period. The results show that the correlation coefficients of regression analysis generally revealed a strong correlation between NDVI from the two sensors in November 2009 and January, April and July 2010 (0.88, 0.85, 0.77 and 0.74, respectively). The differences place may be affected by cloud cover. From the combined analysis of seasonal changes and land cover, we found that the correlations between the SPOT VGT and the GOSAT CAI NDVI data are less affected by seasonal change and the SPOT VGT data is more sensitive to high vegetation coverage than the GOSAT CAI data. In the future, through continued monitoring and processing by cloud removal technology, the accuracy of GOSAT CAI NDVI data will be further improved and thus be more widely used.
* Corresponding author. This is useful to know for communication with the appropriate person in cases with more than one author. 1. INTRODUCTION
The Normalized Difference Vegetation Index (NDVI) is the indice derived from the red and near infrared spectrums of multi–spectral remotely sensed data. It plays important roles in remote sensing applications in a variety of fields. Many studies have compared the NDVI values from different satellite sensors such as SPOT VGT, MODIS, AVHRR GIMMS, SeaWiFS, Landsat TM, ETM+ and ASTER (Brown et al, 2006).
The Greenhouse Gases Observing Satellite (GOSAT) was developed by the National Institute for Environmental Studies (NIES) and the Japan Aerospace Exploration Agency (JAXA), in order to globally measure precise concentrations of atmospheric greenhouse gases (CO2 and CH4) from space. The GOSAT contains two sensors: the Fourier Transform Spectrometer (FTS) and the Cloud Aerosol Imager (CAI). The FTS is the main sensor used for observing high resolution spectra over wide ranges of near infrared and thermal infrared wavelengths, whereas CAI is a narrow–band imager of 4 bands, at wavelengths from ultra–violet to near infrared (Ishida et al, 2010). It can also process NDVI data.
Because the characteristics and time periods of satellite data are different, many researchers have compared them (Fensholt et al, 2006, 2009; Du et al, 2007; Song et al, 2010), but GOSAT data research has just begun. To explore the relationship between
these two types of datasets. We are first compared GOSAT CAI and SPOT VGT NDVI data for seasonal changes and land cover changes in East Asian. The second objective is to discuss the possibility of extending SPOT VGT NDVI data using GOSAT CAI NDVI data for the same area.
2. STUDY AREA AND DATA
2.1 Study area
The study area is the northeast part of the Asian continent, which covers approximately 5,125,000 km2 and stretches from 5°N to 55°N latitude and from 110°E to 150°E longitude.
Figure 1 depicts the land cover map derived from European Space Agency Global Land Cover (ESA GLC) data. The ESA GLC map was generated from 19 months of full–resolution MERIS / ENVISAT data acquired between May 2005 to April 2006. It has a resolution of 300 m and discriminates among the land surfaces of 22 representative continental ecosystems. With the permission of ESA, the data are publically available through
the POSTEL Service Centre
(http://www.esa.int/due/ionia/globcover). In this study, we generate the land cover classification for eight types of surfaces that include cropland, forest, grassland, mixed vegetation, urban, bare ground, water, and other (snow, ice, burnt areas, and clouds).
International Archives of the Photogrammetry, Remote Sensing and Spatial Information Sciences, Volume XXXVIII-4/W25, 2011 ISPRS Guilin 2011 Workshop, 20-21 October 2011, Guilin, China
Based on temperature and precipitation, seasonal changes in this region occur during the months of January, April, July, and October (Preston et al, 2006).
2.2 GOSAT CAI and SPOT VGT NDVI datasets
An overview of sensor specifications and the NDVI datasets is provided in Table 1. The first dataset summarizes the GOSAT CAI data. The CAI Level 3 radiance distribution data products are generated for three observation days, which are shifted day by day and assembled to give a global cloud distribution map. The radiance data of Thermal And Near infrared Sensor for carbon Observations (TANSO) CAI Level 3 is corrected by using the vicarious calibration coefficients acquired after launch. Tools for reading the data products are available at the GOSAT webpage (http://www.gosat.nies.go.jp/). Data from November, January, April, and July were selected to represent autumn, winter, spring and summer seasons, respectively. Based on the cloud distribution of CAI data, the first 10 days of each monthly data with a relatively small cloud cover was chosen over other data.
Another dataset is the SPOT VGT 10–day composite NDVI data. The 10–day synthesis product (S10) with a full 1–km resolution derived from P products (surface reflectance corrected for molecular and aerosol scattering, water vapour, ozone and other gas absorption) through maximum value atmosphere, for the measurement of global greenhouse gas concentrations. The TANSO–CAI sensors acquire data measured at wavelengths in the near infrared and visible regions, which are the same wavelengths used to acquire the SPOT VGT NDVI data (also see Table 1). So CAI NDVI is defined from the reflectance at band 2 and band 3 by:
2)
Secondly, the CAI NDVI and SPOT VGT NDVI datasets have different time resolutions of 3 days and 10 days, respectively. The temporal resolution of both datasets must be equal to enable the use of consistent datasets. Therefore, the MVC method was used for 10 days of CAI NDVI data viewing, which implies that each pixel is the result of 10 views (Table 2). For a given pixel that has been viewed several times, the selected reflectance corresponds to the view with the best ground NDVI. Views with high cloud cover and bad quality or interpolated views are excluded; the pixels from sea or great lakes are set to null values. This method makes the CAI NDVI and SPOT VGT NDVI datasets compatible, with the same temporal resolution of 10 days.
Thirdly, the two datasets have different spatial resolutions. The subsets of the full spatial extents of the same site from the two datasets are shown in figure 2. In order to directly compare these datasets, we resampled both datasets to the 0.125 degree spatial resolution using the nearest neighbour method.
Figure 1. Land cover classification map of East Asia derived from ESA GLC data.
Figure 2. 10–day composite GOSAT CAI and SPOT VGT NDVI subsets at full spatial extent for an example site.
Table 1. Characteristics of GOSAT CAI and SPOT VGT NDVI datasets
Spatial characteristics: GOSAT CAI SPOT VGT
Norminal pixel size (km) 0.5 1
Table 2. Data used from two sensors in each month
Period GOSAT CAI SPOT VGT
3–day composite 10–day composite
International Archives of the Photogrammetry, Remote Sensing and Spatial Information Sciences, Volume XXXVIII-4/W25, 2011 ISPRS Guilin 2011 Workshop, 20-21 October 2011, Guilin, China
Finally, following the post processing, comparison of the GOSAT CAI and the SPOT VGT NDVI datasets was carried out using regression analyses.
4. RESULT AND ANALYSIS
4.1 Correlation analysis
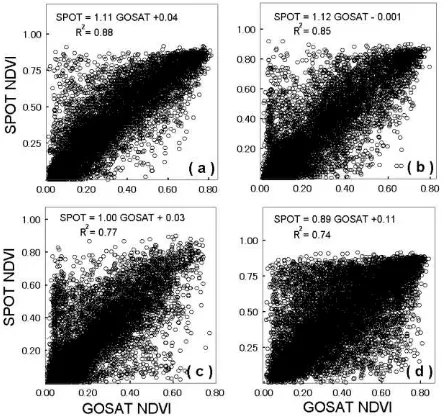
Scatter plots exemplify the relationship between two datasets by displaying data points on a two–dimensional graph. They are especially useful when there are a large number of data points. Scatter plots of seasonal 10–day composite NDVI data from SPOT VGT and GOSAT CAI coverage of the continental area illustrate the linear relationship between the two sensors (Figure 3). Therefore, a traditional linear regression method could be employed, with 95% individual prediction interval using Pearson correlation analysis. Correlation coefficients of regression analysis (SPOT VGT as the dependent and GOSAT CAI as the independent) generally revealed a strong correlation between NDVI from the two sensors in November 2009 and January, April and July 2010 (0.88, 0.85, 0.77 and 0.74, respectively). Based on the distribution of scatter plots, most of the points are distributed around the fit line, but there are some individual points that have large error, especially for July 2010.
4.2 Residuals analysis
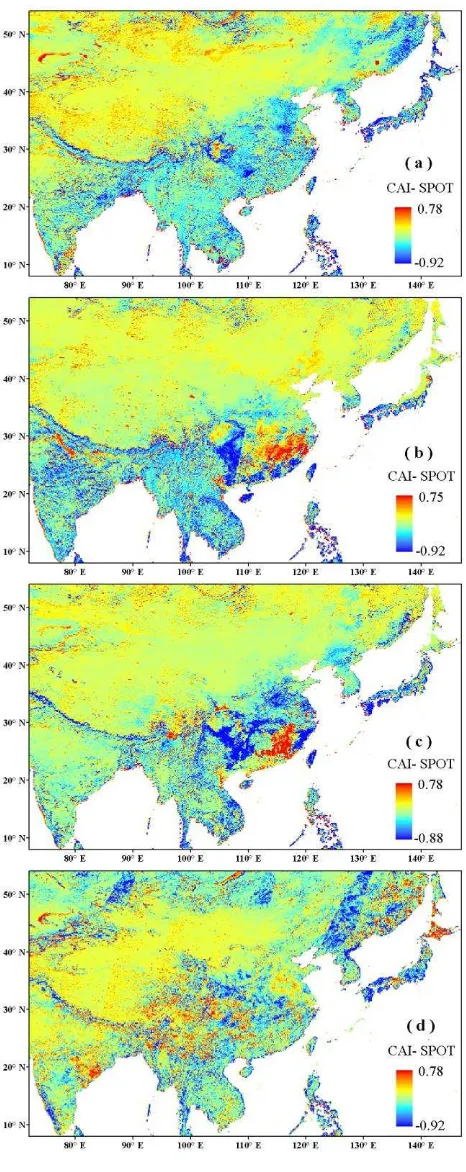
Because the independent variable can be assessed accurately and with no errors, errors only occurred in the dependent variable. However, in this study the residuals of regression were subsequently analyzed without taking into account the differences in calibration routines, geometric rectification, and the various resampling routines employed. The histograms of the standardized residuals over the four months show that the residuals were normally distributed (Fig. 4), and that the highest frequency of standardized residual values occurred within 1–10 days for November, January, April, and July are –0.048, –0.036, –0.044 and –0.108, respectively. Four seasonal 10–day composite maps of regression residuals are pictured in Fig. 5. Blue pixels indicate that a given residual occurred due to SPOT VGT NDVI values larger than GOSAT CAI NDVI values for the same pixel. Light yellow and green pixelated areas depict the areas experiencing little change. Red pixels indicate that the values of GOSAT CAI NDVI are greater than those of SPOT VGT NDVI. Based on Fig. 5, more obvious blue areas may be affected by cloud cover because of low values of GOSAT CAI NDVI, which is the case in Southwest China.
4.3 Difference in land cover
The differences in NDVI between SPOT VGT and GOSAT CAI for different land covers are shown in Table 3. The results indicate that the means NDVI values of 4 months from both sensors increase as seasonal temperatures increase. From the comparison of mean NDVI values, we found that the mean NDVI values from SPOT are higher than those from CAI in the areas with high vegetation coverage (forest, grassland, cropland, and mixed vegetation). In contrast, the mean NDVI values of CAI are higher than those from SPOT in the areas with low vegetation coverage (bare, water). The mean NDVI values of the two datasets are more similar in urban and other areas. These results showed that the NDVI values from the two sensors are less affected by seasonal change and that the SPOT VGT data is more sensitive than GOSAT CAI in the areas with
high vegetation coverage, which may be because the NIR spectral wavelength from the GOSAT CAI sensor was narrow.
Figure 3. Scatterplot of GOSAT CAI and SPOT VGT NDVI for each pixels in November 2009 (a), January 2010 (b), April 2010 (c) and July 2010 (d).
Figure 4. Histogram of regression standardized residual between SPOT VGT and GOSAT CAI NDVI in November 2009 (a), January 2010 (b), April 2010 (c) and July 2010 (d).
Table 3. Statistices of the mean NDVI values from GOSAT CAI and SPOT VGT in different land cover during four time period
1–10 day Nov. 2009
1–10 day Jan. 2010
1–10 day Apr. 2010
1–10 day Jul. 2010
CAI VGT CAI VGT CAI VGT CAI VGT
Cropland 0.34 0.41 0.27 0.31 0.24 0.29 0.36 0.44
Forest 0.36 0.48 0.26 0.32 0.23 0.29 0.51 0.63
Grassland 0.25 0.31 0.16 0.18 0.16 0.20 0.42 0.52
Mix 0.23 0.28 0.17 0.19 0.16 0.19 0.34 0.42
Urban 0.26 0.28 0.20 0.16 0.22 0.22 0.34 0.36
Bare 0.09 0.08 0.07 0.05 0.08 0.08 0.15 0.14
Water 0.25 0.24 0.18 0.16 0.18 0.17 0.29 0.20
Other 0.11 0.15 0.09 0.07 0.07 0.08 0.17 0.18
International Archives of the Photogrammetry, Remote Sensing and Spatial Information Sciences, Volume XXXVIII-4/W25, 2011 ISPRS Guilin 2011 Workshop, 20-21 October 2011, Guilin, China
Figure 5. Residuals of the regression analysis between GOSAT CAI and SPOT VGT NDVI for November 2009 (a), January 2010 (b), April 2010 (c) and July 2010 (d). (Blue: GOSAT > SPOT; Red: GOSAT < SPOT)
5. CONCLUSIONS
This study implemented the latest GOSAT CAI L3 data to generate a 10–day composite NDVI data application MVC
method, which was used to compare GOSAT CAI L3 data to SPOT VGT NDVI data from the corresponding time period. The results show that there is a good linear relationship between the SPOT VGT and the GOSAT CAI NDVI values for East Asia, and the SPOT VGT NDVI data were correlated well with GOSAT CAI NDVI data (R2 value = 0.74–0.88). Based on the residual analysis, the residuals fit the normal distribution and there are several areas affected by the clouds. In addition, from the combined analysis of seasonal changes and land cover classification, we found that the correlations between the SPOT and the GOSAT NDVI data are less affected by seasonal change and the SPOT VGT data is more sensitive to high vegetation coverage than the GOSAT CAI data. In the future, through continued monitoring and processing by cloud removal technology, the accuracy of GOSAT CAI NDVI data will be further improved and thus be more useful.
REFERENCES
Brown, M. E., Pinzón, J. E., Didan, K., Morisette, J. T., Tucker, C. J., 2006. Evaluation of the Consistency of Long–Term NDVI Time Series Derived from AVHRR, SPOT–Vegetation, SeaWiFS, MODIS, and Landsat ETM+ Sensors. IEEE Transactions on Geoscience and Remote Sensing, 44(7), pp. 1787–1793.
Du, P. J., Zhang, H., Yuan, L. S., Liu, P., Zhang, H., 2007. Comparison of Vegetation Index from ASTER, CBERS and Landsat ETM+. IEEE Geoscience and Remote Sensing Symposium IGARSS, pp. 3341–3344, July, 2007.
Fensholt, R., Nielsen, T. T., Stisen, S., 2006. Evaluation of AVHRR PAL and GIMMS 10–day composite NDVI time series products using SPOT–4 vegetation data for the African continent. International Journal of Remote Sensing, 27(13), pp. 2719–2733.
Fensholt, R., Rasmussen, K., Nielsen, T. T., Mbow, C., 2009. Evaluation of earth observation based long term vegetation trends– Intercomparing NDVI time series trend analysis consistency of Sahel from AVHRR GIMMS, Terra MODIS and SPOT VGT data. Remote Sensing of Environment, 113(9), pp. 1886–1898.
Holben, N., 1986. Characteristics of maximum-value composite images from temporal AVHRR data, International Journal of Remote Sensing, 7, pp.1417-1434.
Ishida, H., Nakjima, T. Y., Yokota, T., Kikuchi, N., Watanabe, H., 2010. Development and validation of cloud screening algorithm for GOSAT/CAI. International Archives of Photogrammetry. Remote Sensing and Spatial Information Sciences, Vol. 38, Part 8, Kyoto Japan.
Preston, B., Suppiah, R., Macadam, I., Bathols, J., 2006. Climate Change in the Asia Pacific region. A consultancy report prepared for the Climate Change and Development Roundtable. CSIRO Marine and Atmospheric Research, 93pp.
Song, Y., Ma, M., Veroustraete, F., 2010. Comparison and conversion of AVHRR GIMMS and SPOT VEGETATION NDVI data in China.
International Journal of Remote Sensing, 31(9), pp. 2377–2392.
ACKNOWLEDGMENT
This research was supported by a Grand-in-Aid for Scientific Research (B), 23405005 (PI: Lecturer Xiufeng Wang, Hokkaido University, Japan). The GOSAT CAI Level 3 Data Product is available with a user registration through the GOSAT User Interface Gateway: https://data.gosat.nies.go.jp.
International Archives of the Photogrammetry, Remote Sensing and Spatial Information Sciences, Volume XXXVIII-4/W25, 2011 ISPRS Guilin 2011 Workshop, 20-21 October 2011, Guilin, China