10 (2000) 109 – 132
The deregulation of capital markets in France
Benedicte Millet-Reyes *
Long Island Uni6ersity School of Business,Public Administration,and Information Sciences, 1Uni6ersity Plaza,Brooklyn,NY11201-5372,USA
Received 13 November 1998; accepted 20 July 1999
Abstract
This paper investigates how the deregulation of French capital markets affected corporate investment in the 1980s. Access to public financial markets may be less important in countries that have traditionally relied on institutional investors to finance their corporate investment projects. This should be true for France where, contrary to the US, banks and government agencies have always been involved in firms’ long term activities. In this study, French firms are categorized based on their ownership structure and trading characteristics. Two investment models are augmented with measures of corporate liquidity in order to test the role of internal funds on investment. Empirical results show that only small French firms trading on the secondary stock market have to rely on liquid assets to finance their capital expenditures. French firms with strong bank ties avoid this constraint since they are allowed to maintain higher debt levels. © 2000 Elsevier Science B.V. All rights reserved.
JEL classification:G31; G32
Keywords:Deregulation; Liquidity; Investment
www.elsevier.com/locate/econbase
1. Introduction
This paper studies the investment behavior of French corporations during the 1980s. This period was characterized by significant political changes leading to the privatization of French banks and the expansion of the Paris Stock Market. Three types of companies are examined in this paper: industrial groups with bank ties,
* Tel.: +1-718-4881150; fax: +1-718-4881125.
E-mail address:[email protected] (B. Millet-Reyes)
industrial groups without bank ties, and independent firms. The first category consists of large corporations with institutional shareholders (banks, insurance companies, and government agencies). The second class of firms is limited to large industrial groups that do not have any significant link with France’s main institutional investors. The third category includes small and independent firms that do not belong to any consolidated group and do not have any large institutional shareholders in their ownership structure.
First, this study investigates whether ownership structure had an impact on corporate investment in the 1980s. Bank owners can provide access to debt as well as monitoring of the firm. They are expected to mitigate the information and incentive problems that lead to sub-optimal investment behavior. In con-trast, firms without any bank links are expected to face larger information asymmetries and agency conflicts. As a result, these companies have limited leverage and rely on internal funds to finance their capital expenditures. In a second step, I test whether access to public capital markets modified corporate investment during this period. In France, well-established firms are traded on the largest stock market where information asymmetries between owners and in-vestors are limited. In contrast, younger firms are often traded on the second or over-the-counter market. They should be more financially constrained because of their limited access to external funds. Third, the period covered by this sample provides a good opportunity to study how French corporations adapted their investment behavior to the deregulation of the French economy. Well-established firms as well as growing companies looking for external investors benefitted from the liberalization of French capital markets. Last, this paper provides new evi-dence on the limited role of cash flow as a determinant of the level and timing of corporate investment. Cash and working capital variables are shown to be more consistent in their explanatory power.
The remainder of this paper is organized as follows. Section 2 summarizes the existing literature on corporate investment. Section 3 describes key aspects of the French economy and capital markets during the 1980s. Comparison is made with the financing characteristics of Japanese and American firms. In Section 4, a
panel of French companies is studied for the period 1987 – 1990. A Tobin’s Q
2. Corporate investment theory
Neoclassical investment models show that, when capital markets are assumed to be perfect, the financial structure of the firm is irrelevant to corporate investment
decisions (Miller and Modigliani, 1958). More specifically, in the standardQmodel,
firms should invest until marginalQis one. In the Euler equation model, financial
factors such as debt limits and liquidity are not included when determining the firm’s cost of capital.
However, asymmetric information and incentive problems may modify corporate investment behavior in two ways. First, providers of external finance may reduce the availability or increase the cost of debt for corporations whose profitability cannot be assessed (Myers and Majluf, 1984). As a consequence, companies with limited access to external finance often make sub-optimal investment decisions based on the availability of internal funds. Agency problems can also lead to inefficient investment behavior. As Jensen (1986) notes, management may act against the best interests of shareholders by investing the firm’s free cash flow in sub-optimal projects. The value-maximization goals of stockholders also conflict with those of debt-holders.
Shareholders favor riskier projects, since limited liability means they do not have to bear the full cost of negative outcomes (Jensen and Meckling, 1976). Further, equity holders can appropriate wealth by distributing dividends instead of investing in projects whose returns would have to be shared with debt-holders. Therefore, a firm’s access to external funds may be limited by creditors who seek to reduce the scope for wealth transferring activities.
Institutional ownership, especially from banks, can mitigate incentive conflicts and information asymmetries. First, because banks are more involved in the day-to-day activities of the company, they have better information on the firm’s investment policy and profitability. Second, they can also control managers’ consumption of perquisites and investment decisions. Finally, as both shareholders and debt-holders, banks can increase the firm’s leverage without being concerned about the owners’ incentives to appropriate wealth at the expense of creditors.
2.1. Tobin’s Q models with financing constraints
Empirical specifications of Tobin’s Qmodels use market valuation of capital to
the board of directors and the largest outside shareholders. Their results provide support for information asymmetries as a source of the finance hierarchy favoring internal funds. In their study of Japanese firms, Hoshi et al. (1991) investigate the role of bank ownership in facilitating access to debt. They demonstrate that firms belonging to keiretzu, Japanese industrial groups centered around banks, have higher debt ratios and depend less on internal liquidity to make investment decisions. Prowse (1990) also shows that Japanese banks mitigate agency conflicts by increasing their equity holdings.
2.2. Euler equation models with borrowing constraints
Another way of testing the link between internal funds and investment is to modify the Euler equation model to include borrowing constraints. Hubbard et al. (1994) show that the neoclassical model without capital markets frictions is accepted for a sample of US manufacturing companies with high dividend payout. However, low payout firms, which are more likely to be financially constrained, reject the standard model but accept the augmented version with borrowing constraints. These results remain valid when the characterization of information asymmetries is modified: financially constrained firms can be defined as having higher interest coverage ratios, higher debt-to-asset ratios, or no bond rating (Whited, 1992). Access to external funds can also change over the lifetime of a corporation and modify the role of liquidity. Petersen and Rajan (1994) explain that smaller US firms rely on internal funds in their initial years. As a consequence, for such firms, higher debt levels are a sign of better credit availability, rather than that they have borrowed up to their credit limits. Changes in domestic capital markets can also modify the sources of external finance. Hoshi et al. (1990) study the deregulation of Japanese debt markets in the 1980s. They find that, during this period, mature and successful companies switched from bank loans to public debt in order to avoid the monitoring cost of bank financing. However, these firms also became increasingly sensitive to cash flows for their capital expenditures. In contrast, liquidity remained unimportant for companies that had maintained bank ties.
3. Capital markets and corporate financing in France
3.1. Ownership characteristics of French companies
banking groups: Paribas; Suez; Credit Commercial de France and Societe Generale (Fremont and Latapie, 1992).
Despite these political and economic changes, France maintains major institu-tional differences with the US and Japan. First, the French government retains large equity positions in corporations, despite the recent privatization of 1986 and 1993. Second, unlike American institutional investors, French banks and insurance companies have been allowed to take shareholding positions in non financial companies of up to 5% of their own equity (this limit was increased to 15% in 1991). Other institutional investors consist mostly of national and regional govern-ment agencies. Investgovern-ment funds are also more limited because pension provisions are principally run by state schemes.
While French banks are an important source of external finance, they have not tried to participate as actively in the running of firms as German or Japanese banks have. However, this attitude has started to change in the 1990s, with banks moving more into the financial services markets and establishing investment funds based on government securities and company shares. Despite this evolution, most French industrial groups remain without any bank ties. Moreover, families still control some of the largest French corporations, as well as a large share of the firms traded on the second market.
3.2. Sources of external finance in France
During the period 1970 – 1985, French and Japanese firms relied mostly on loans from financial institutions, whereas US corporations also used instruments like bonds and commercial papers. However, the deregulation of Japanese capital markets resulted in a decline of bank debt from more then 90% of corporate debt
in 1975 toB50% in 1992 (Hoshi et al., 1993). The reliance on bonds increased from
3% in 1985 – 1986 to 6% in 1993 – 1994 (OECD Statistics, 1994).
In France, the development of capital markets provided new sources of external funds to companies. The introduction of the second market in 1983 and the privatizations of 1986 brought interest in the stock market. Family businesses started giving up some degree of corporate control in exchange for equity financing. In fact, share trading increased by 600% between 1983 and 1990. Increased reliance on public capital markets is reflected in these OECD Statistics: in 1985 – 1986, 24% of corporate financing was provided by equity, and only 1% by bonds. These numbers jumped to 38 and 7%, respectively, in 1993 – 1994.
any dividend requirements. Last, there is an unregulated over-the-counter market, the ‘Hors Cote’. All stock exchange activities are subject to the oversight of the Commission de Operations en Bourse (COB), a state-appointed body similar to the US Securities and Exchange Commission. In 1990, 70% of the companies were traded on the main market, representing 93% of the French market capitalization. However, the growth in the second market has brought significant changes in corporate ownership and financing. A large number of the companies traded on this market were originally owned by families, but they have been able to raise more equity than the minimum requirements thanks in part to the interest shown by institutional investors.
4. Testing the impact of corporate ownership structure on investment
4.1. Sample construction
This section analyses a sample of 123 non-financial French corporations, all publicly traded between 1983 and 1990. Subsidiaries of French and foreign compa-nies are excluded from this project. The years 1983 – 1986 are used as instruments for the regressions run on the period 1987 – 1990. Accounting and financial informa-tion, as well as details on the ownership structure have been obtained from the reports published by the French company DAFSA. Sources and uses of funds, including investment expenditures, are provided for all companies. DAFSA also publishes a list of all French groups having more then ten subsidiaries. This list is used in this study to separate group firms from independent firms.
earnings are much larger for companies that do not have bank links. t-tests and non-parametric tests between the three sub-samples confirm that these differences are statistically significant.
4.2. A Tobin’s Q model with measures of corporate liquidity
In this section, aQmodel of investment is used, first on the whole sample, then
on each category of firms. The reduced form equation used for empirical estimation is:
Ii,t/Ki,t−1=c+ci+ct+b·Qi,t−1+ui,t (1)
Ii,t, investment at timetfor firmI;Ki,t−1, physical capital stock at the end of period
t−1;ci, firm specific effect;ct, year dummy;Qi,t−1(market value of equity+book
value of debt−book value of inventory) divided by book value of tangible assets
at the beginning of period t.
Cash flow working capital and lagged sales are then added to the model in order to estimate the effect of financing constraints on investment decisions. The resulting empirical specification is:
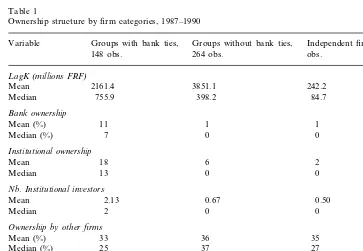
Ownership structure by firm categories, 1987–1990
Groups without bank ties,
Variable Groups with bank ties, Independent firms, 80
148 obs. 264 obs. obs.
LagK(millions FRF)
242.2
Nb.Institutional in6estors
Mean 2.13 0.67 0.50
Family and indi6iduals
5 12 17
Mean (%)
0 0
Table 2
Summary statistics by firm categories, 1987–1990a With bank
All firms Without bank Independent
Variable
Ret.earnings/LagK
Mean 1.09 0.72 1.24 1.30
0.93 1.34
aCash flow, operating income+depreciation; payout ratio, dividend/operating income; interest cover-age, interest/(interest+cash flow); liquidity, cash+ST securities+accounts receivable−accounts payable; working capital, liquidity+inventory.
St−1, lagged sales,CFt, cash flow in periodt,WCt−1, beginning of period working
capital.
The two measures of liquidity included in this regression create new problems of estimation because they can also proxy for investment opportunities. Although the
Qvariable used in this model is supposed to control for profitability, its empirical
value may be biased because of stock market imperfections. As a consequence, variables measuring liquidity may be significant for all categories of firms, only because they proxy for future performance.
In order to address this problem, this study tries to reduce endogeneity in two
regression in order to control for future demand for capital goods. Further, instruments based on lagged values of the dependent and independent variables are used to control for future profitability. The equations are then first-differenced in order to remove the firm’s specific effect. Estimation is made with the Generalized Method of Moments, since it allows for heteroskedasticity, autocorrelation, and the use of instrumental variables.
4.3. Empirical results
Tables 3 – 6 present detailed regression results for the whole sample and for each category of firms. Estimated coefficients, standard errors, and tests of the overiden-tifying restrictions are given for each model specification. Firm specific effects are removed by first differencing the equation. Year dummies are included as regressors
and instruments in all equations. The instruments used in all equations are: Q at
t−1; cash flow ratio at t−2 and t−3; investment ratio at time t−2 and t−3;
retained earnings ratio at timet−2 andt−3; liquidity ratio att−2 andt−3 and
working capital ratio at time t−2 and t−3.
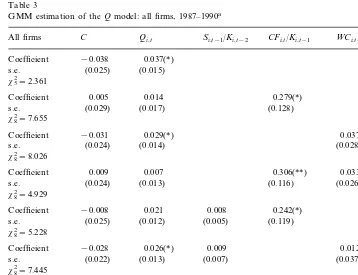
Table 3
GMM estimation of theQmodel: all firms, 1987–1990a C
All firms Qi,t Si,t−1/Ki,t−2 CFi,t/Ki,t−1 WCi,t−1/Ki,t−2 Coefficient −0.038 0.037(*)
s.e. (0.025) (0.015)
x52=2.361
Coefficient 0.005 0.014 0.279(*)
(0.017) (0.128)
(0.029) s.e.
x82=7.655
−0.031 0.029(*)
Coefficient 0.037
s.e. (0.024) (0.014) (0.028)
x82=8.026
0.009
Coefficient 0.007 0.306(**) 0.033
s.e. (0.024) (0.013) (0.116) (0.026)
x8 2=4.929
−0.008 0.021
Coefficient 0.008 0.242(*)
(0.025) (0.119)
s.e. (0.012) (0.005)
x82=5.228
0.012 Coefficient −0.028 0.026(*) 0.009
(0.022) (0.013) (0.037)
s.e. (0.007)
x82=7.445
Coefficient −0.001 0.015 0.005 0.268(*) 0.018
(0.017) (0.029)
s.e. (0.007) (0.131) (0.035)
x72=4.501
Table 4
GMM estimation of the O model: groups with bank ties, 1987-1990a
C Qi,t Si,t−1/Ki,t−2 CFi,t/Ki,t−1 WCi,t−1/Ki,t−2
Coefficient −0.001 0.015 0.144 −0.054(*)
(0.008) (0.102)
(0.017) (0.024)
s.e. (0.029)
x72=1.925
a(*) and (**) indicate significance at the 5 and 1% levels.
As reported in the empirical literature, the Q coefficient is small but significant
when estimated without any adjustment for capital markets imperfections. The lack of significance for the categories of groups with bank ties and independent firms is attributed to the small size of these two classes, since pooling observations from any
two of these three sub-samples makes the statistical significance of Q reappear.
Tables 3 – 6 also present results for the Qmodel augmented to include measures of
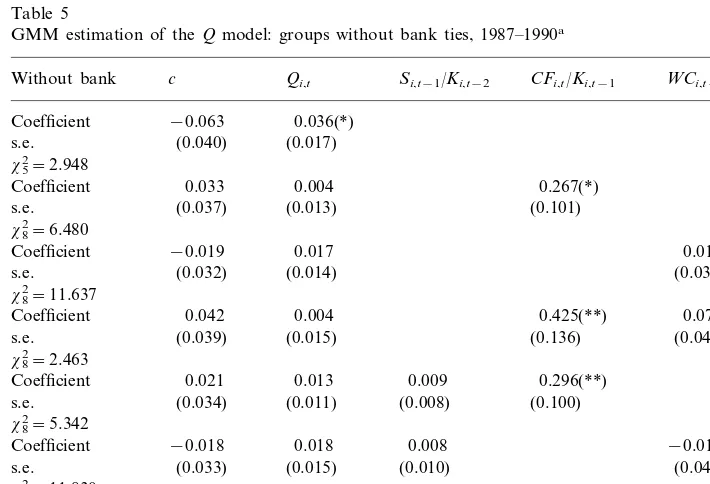
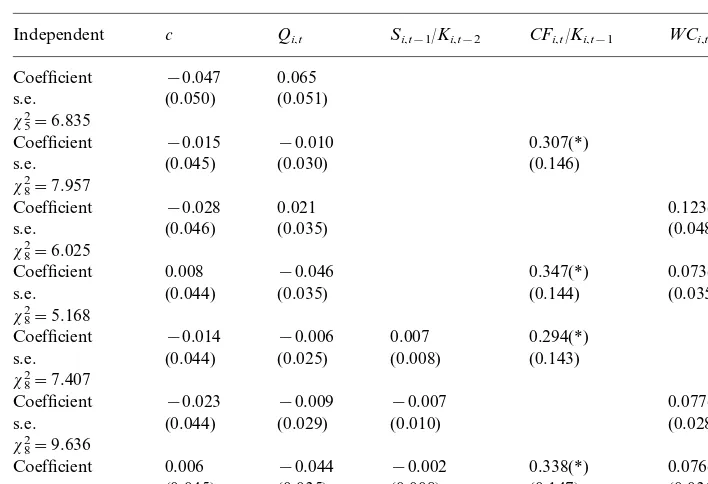
liquidity. Under the hypothesis of perfect capital markets, even if the model generates biased results for each category, there should be no difference in the estimated liquidity coefficients of each class as long as the bias is the same. However, the assumption of frictionless markets does not hold for the sample studied here. Groups with bank ties behave differently than firms from the two other sub-samples. Their cash flow and working capital coefficients are small and not statistically significant. In contrast, cash flow matters for groups without bank ownership, and for independent firms. Working capital is significant only for the latter category.
and institutional investors are often controlled by the state, the Q model of investment may not be the right structural approach for corporations with strong institutional ties. Such companies may be less responsive to private incentives such as market valuation and internal liquidity.
As for the two other firm categories (groups without bank ties, and independent companies), two major results appear from the regression analysis. First, the coefficient on the cash-flow variable is higher for large groups (when lagged sales and working capital are included in the regression) than for independent firms. This result may support the hypothesis that large corporations suffer from significant agency conflicts related to the use of free cash-flow. It is also consistent with the international findings of Kadapakkam et al. (1998) showing that large firms rely more on cash flow than small firms. Second, the working capital variable is only significant for the category of small firms. This is consistent with the hypothesis that independent firms suffer from strong adverse selection problems. They retain higher stocks of liquid assets to finance their capital expenditures.
4.4. Corporate in6estment and public capital markets in France
As explained in Section 3.2, France has three categories of stock markets with specific information requirements. Since these markets were started at different
Table 5
GMM estimation of theQmodel: groups without bank ties, 1987–1990a
c Qi,t CFi,t/Ki,t−1 WCi,t−1/Ki,t−2
Coefficient 0.042 0.004 0.425(**) 0.071
(0.136) (0.040)
Coefficient −0.018 0.018 0.008 −0.010
(0.033)
s.e. (0.015) (0.010) (0.048)
x82=11.830
0.001
Coefficient 0.046 0.001 0.424(**) 0.067
(0.045) (0.019) (0.013) (0.149) (0.057) s.e.
x72=2.172
Table 6
GMM estimation of theQmodel: independent firms, 1987–1990a
c Qi,t Si,t−1/Ki,t−2 CFi,t/Ki,t−1 WCi,t−1/Ki,t−2
Coefficient −0.028 0.021 0.123(*)
(0.035) (0.048)
Coefficient 0.006 −0.044 0.338(*) 0.076(*)
(0.008) (0.147)
(0.035) (0.036)
s.e. (0.045)
x72=5.090
a(*) and (**) indicate significance at the 5 and 1% levels.
points in time, they also provide useful information on the age and size of their listed companies. In this section, I will use this criterion to proxy for the severity of information asymmetries between firms and external investors. The objective is to show that constrained firms accumulate liquid assets when they have poor access to public markets.
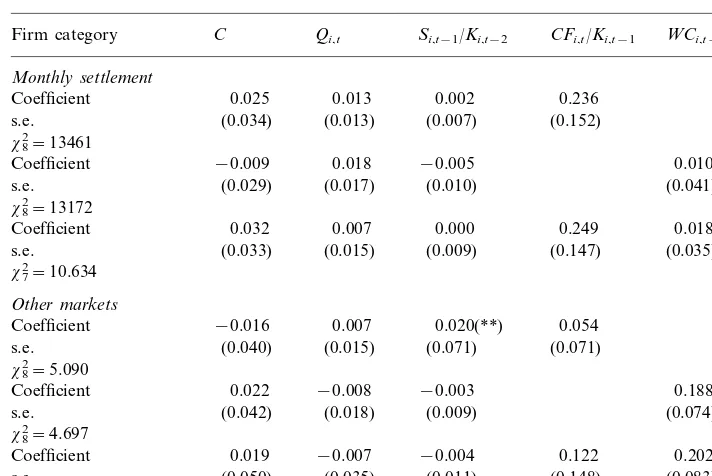
In order to test this hypothesis, groups with bank ownership are removed from the sample, since their investment decisions are not sensitive to liquidity in this model. Further, they are often government controlled firms for which public trading has not been consistent. The remaining firms, groups without bank ties and independent firms, are split into two categories based on their stock exchange listing. The first sub-sample is restricted to companies traded on the monthly settlement market. As described in Section 3, they are all large and mature firms. The other sub-sample includes all other corporations traded on the cash, second market or over-the-counter markets. The monthly settlement market should allow companies to raise external funds more easily, since it deals only with well-estab-lished corporations. In contrast, smaller and less mature firms traded on the secondary markets should have limited access to external finance.
statistically different from each other, firms traded on the monthly settlement market have a lower interest coverage ratio. Moreover, these companies also retain lower stocks of liquidity and working capital. These results validate the hypothesis that information asymmetries between external providers of funds and a firm are mitigated when the company is traded on a mature and active stock market. Companies that do not benefit from a privileged position on capital markets face a higher cost of external finance and choose to rely on internal funds.
Table 7
Summary statistics by categories of stock markets, 1987–1990a
Without bank ties other trading Without bank ties monthly
Variable
settlement, 192 obs. markets, 152 obs. 1
Interest co6erage 1
0.60 Ret.earnings/LagK
Mean 1.27 1.22
Table 8
GMM estimation of the O model by stock market categories, 1987–1990a
C Qi,t Si,t−1/Ki,t−2 CFi,t/Ki,t−1 WCi,t−1/Ki,t−2
Coefficient 0.019 −0.007 0.122 0.202(*)
(0.011) (0.148)
(0.035) (0.083)
s.e. (0.050)
x7 2=4.035
a(*) and (**) indicate significance at the 5 and 1% levels.
Empirical analysis is then conducted with the reduced form investment equations used in the previous section. Table 8 shows that the investment decisions of firms traded on the monthly settlement market are not based on their level of working capital or cash flow. In contrast, companies traded on less-established markets make their amount of investment dependent on their accumulation of working capital. Importantly, when the sample is split based on trading patterns, the
statistical significance of the cash flow variable disappears in the Qmodel.
4.5. E6olution of corporate financing between 1983and 1990
before 1986. The objective is to compare the period 1983 – 1985 to the period 1988 – 1990 (using 81 – 82 and 86 – 87 as instruments). Table 9 describes in more details the ownership characteristics of the two categories, as well as their evolution between 1983 and 1990. Institutional ownership declined for firms with bank ties, and increased for firms without bank ties. This reflects the diversification strategy implemented by recently privatized institutional investors.
Table 10 provides summary statistics for the two subsamples. All measures of performance and liquidity improved between 1983 and 1990, regardless of the firm category. However, non-parametric tests show that some of these ratios are statistically different between the two types of companies. First, measures of liquidity, retained earnings, and working capital are systematically higher for firms without bank ties. However, debt levels are equivalent across the two sections, with a larger interest coverage for the latter category. Second, although companies without bank links improved their investment, cash flow and output ratios at the same rate as firms with bank shareholders, their levels of liquid assets increased at a slower pace during the period 1988 – 1990. These statistics support the hypothesis that companies without bank ties gained better access to capital markets during the late 1980s, thereby decreasing their need to accumulate internal funds.
A Qmodel of investment is then augmented with sales, cash flow and working
capital variables. Table 11 provides separate regression results for the two firm
categories and the two time periods. The instruments used for this model are:Qat
Table 9
Comparison of ownership structures between 1983–85 and 1988–90
Firms without bank ties 60 firms Variable Firms with bank ties 49 firms
LagK(millions FRF)
509.1
Median 1988–1990 236.1
Bank ownership
Mean: 1983–1985 (%) 8 0
7 1
Mean: 1988–1990 (%) Institutional ownership
14
Mean: 1983–1985 (%) 2
Mean: 1988–1990 (%) 12 4
Nb.Institutional in6estors
Mean: 1983–1985 1.93 0.49
Mean: 1988–1990 1.44 0.70
Ownership by other firms 37
Mean: 1983–1985 (%) 38
36 44
Mean: 1988–1990 (%) Family and indi6iduals
Mean: 1983–1985 (%) 6 10
Table 10
Summary statistics by firm categories, 1983–85 versus 1988–90a
Firms with bank ties Firms without bank ties Variable Ret.earnings/LagK
0.91
aCash flow, operating income+depreciation; payout ratio, dividend/operating income; interest cover-age, interest/(interest+cash flow); liquidity, cash+ST securities+accounts receivable−accounts payable; working capital, liquidity+inventory; all ratios reported in this table are median values.
timet−2; cash flow ratio at timet−1 andt−2; investment ratio at timet−1 and
t−2; retained earnings ratio at time t−1 and t−2; liquidity ratio at time t−2;
working capital ratio at timet−2; and payout ratio at timet−1 andt−2. GMM
estimation of the coefficients leads to the rejection of the structural model for companies with bank links. This result validates the hypothesis that firms with bank ownership do not follow a neoclassical model of investment including stock market valuation. As mentioned before, this effect may be linked to the intervention of the French government in firms having significant links with banks and other
institu-tional investors. In contrast, the Qmodel including liquidity variables is accepted
working capital on their investment decisions is only significant for the period 1983 – 1985, before the liberalization of the French economy. This result is consis-tent with the hypothesis that the same firms may have faced stronger problems of information asymmetries in the years preceding the expansion of the Paris Bourse.
5. Euler equation approach
5.1. Sample construction
The goal of this section is to test the role of borrowing constraints on investment behavior with a structural form that does not include stock market valuation.
Results based on the Tobin’sQapproach may be biased, especially if firms do not
have access to the same stock exchange markets. For example, companies with bank ties are often linked to the government. For these firms, stock market valuation may not be an important component of their investment decisions. Also, smaller and younger companies may not have a well-established trading market. Consequently, the sample used to test the Euler equation model is slightly different from the one used in Section 4. First, since stock prices are not needed for this approach, a longer time period (from 1983 to 1989) can be included in this analysis. Firms are then divided in three sub-samples, using the same criteria as in Section 4.1. The first category consists of 34 groups having strong bank ties. The second category includes 70 groups that do not have bank links. The last sub-sam-ple contains 18 independent firms without significant bank ties. Table 12 compares the financial characteristics of these three classes of firms. As shown in the previous
Table 11
GMM estimation of theQmodel, 1983–85 versus 1988–90a QI,t
C WCi,t−1/Ki,t−2
Firm category Si,t−1/Ki,t−2 CFi,t/Ki,t−1 Firms without bank ties
0.019 0.092(**) Coefficient 83–85 0.287(**) −0.007 0.033
(0.028) (0.032)
(0.037)
s.e. (0.096) (0.013)
x72=7.940 Coefficient 88–90
0.013
−0.264(**)
−0.068 0.487(**)
s.e. 0.019
(0.142) (0.012) (0.059)
x72=10.280 (0.106) (0.016)
Other markets
Model Coefficient 83–85
s.e. Rejected
x72=15.885
Model Coefficient 88–90
s.e. Rejected
x72=16.985
Table 12
Summary statistics by firm categories, Euler equation 1983–1989a
Groups without Independent firms, Groups with bank
Variable
126 obs. ties, 238 obs. bank ties, 490 obs.
0.32
Interest coverage 0.22 0.19 0.22
0.08
Working cap./LagK 1.21
aCash flow, operating income+depreciation; payout ratio, dividend/operating income; interest cover-age, interest/(interest+cash flow); liquidity=cash+ST securities+accounts receivable−accounts payable; working capital, liquidity+inventory; all ratios reported in this table are median values. Table 13
Euler equation model, 1984–1989a
Groups without
Full sample Groups with Independent
firms
a(*) Indicates significance at the 1% level; standard errors are in parentheses; firm specific effects are removed by first-differencing the Euler equation; year dummies are included as regressors and instru-ments in all equations.
sections, stocks of liquidity, retained earnings and working capital are much larger for firms without bank ties, especially small and independent companies.
5.2. Model without a debt limit
The model used in this section is based on the Euler equation, but it does not include any constraint on the use of external finance. This standard neoclassical model is described in Hubbard et al. (1994). Empirical estimation is made using the Generalized Method of Moments. The estimating equation has to be first-differ-enced in order to remove firm-level fixed effects. Twice-lagged instruments are used in order to ensure that they are orthogonal to the moving average error term.
and independent companies. This result shows that the hypothesis of perfect capital markets does not hold for firms that are a priori more likely to face information problems. Capital market frictions create a wedge between the cost of internal and external finance, thereby forcing these companies to rely on their cash flow and liquid assets to finance their investment projects.
5.3. Euler equation with borrowing constraints
In this section, financial factors are added to the standard neoclassical model by including a limit on the use of debt. The Lagrange multiplier associated with this constraint is then parameterized as a function of the stock of liquid assets. This specification supports the hypothesis that small and independent firms rely more on internal funds to finance their investment projects. Therefore, one would expect increases in the stock of liquid assets to be a sign of stronger financing constraints. The model is described in Appendix A of this paper.
Regression results are presented in Table 14. First, the model with a debt limit is rejected for the category of group firms that do not have any bank ties. This finding is consistent with the fact that the baseline Euler equation without a debt limit was
accepted for this category. It also validates the evidence from the Q model
presented in Section 4 suggesting that these companies are financially uncon-strained. Second, the augmented model is accepted for the category of independent firms. Moreover, the sign of the two parameters linked to the debt constraint multiplier is positive. This result verifies the hypothesis that firms a-priori more likely to face adverse selection problems choose to accumulate liquid assets in response to their poor access to capital markets. Third, the model is also accepted
Table 14
Neoclassical model with borrowing constraint, 1984–1989a
Groups without Independent
Parameter a2 −0.003 0.252
(0.705) (1.603) (0.270) (0.543)
Upper tail area 0.000 0.973
for group firms with bank ties. However, the sign of the same two parameters is negative for this category of companies. This would indicate that an increase in the stock of liquid assets relaxes the constraint on external finance. Such result is consistent with the literature associating higher debt levels to poor financial health, but inconsistent with the fact that the same firms also accept the model without a credit limit.
6. The role of liquid assets as a measure of asymmetric information problems
6.1. Limitations of the cash flow 6ariable
While Qmodels provide a straightforward way of including finance constraints,
they also suffer from endogeneity problems. The coefficient of the cash flow variable may be biased because it also proxies for the profitability of investment. Gilchrist and Himmelberg (1995) try to eliminate this problem by constructing a
better proxy forQ. After controlling for future investment opportunities, they find
that cash flow still plays a significant role for companies with poor access to debt markets. However, Kaplan and Zingales (1997) question the use of investment-cash flow sensitivities as a monotonic measure of financing constraints. By reexamining the results of Fazzari et al. (1988), they argue that firms a priori classified as less financially constrained are in fact the ones exhibiting greater investment – cash flow sensitivity. The results presented in this paper also suggest that the use of cash flow does not reflect poor corporate access to external funds. French industrial groups trading on the largest stock exchange are also sensitive to flows of funds. Further, Euler equation models used in Section 5 do not respond to the use of cash flow as a measure of borrowing constraints.
6.2. Accumulation of liquid assets as a measure of financing constraints
Financially constrained firms can offset the impact of cash flow shocks on investment by adjusting their stock of liquid assets. Fazzari and Peteresen (1993) argue that firms try to smooth investment in the short run in order to avoid rising adjustment costs in the long run. Because investment in working capital is re-versible, it can be used as a source of internal funds instead of competing with fixed investment for the use of a limited pool of finance.
The results presented in this paper confirm that only a priori constrained firms base their investment decisions on the availability of working capital and other liquid assets. Problems of asymmetric information seem to be the main source of financing constraints for these firms. They do not have institutional shareholders to provide external capital. Further, they are traded on smaller and more recent stock
markets. In contrast, well-established industrial groups use Q and cash flow as
In their international study, Kadapakkam et al. (1998) confirm these findings by showing that large firms rely more on cash flow than small firms.
7. Conclusion
This paper provides strong empirical evidence that capital and ownership struc-ture have influenced the investment behavior of French companies in the late 1980s. Because of its institutional differences with the US and Japan, France is an interesting example of how bank ownership and growing stock markets may affect
corporate financing decisions. A Tobin’sQmodel and an Euler equation approach
were used to test the role of internal funds for different firm categories. The main objective of this study was to compare companies based on their ownership structure and access to public markets. The first criterion used to proxy for asymmetric information and agency problems isolated groups with institutional ties from privately owned groups and independent companies. The second criterion isolated well-established groups from younger companies. I showed that mature firms trading on the largest stock market did not need to rely on the accumulation of internal funds to finance their investment projects.
In contrast, small and independent firms maintain high levels of working capital in order to offset their poor access to external markets. Groups with bank ties were shown to have better access to debt, but they did not respond well to the investment models used in this study. This paper also suggests that accumulation of liquid assets seems to be a consistent response to the existence of information asymmetries between providers of external funds and constrained firms.
Acknowledgements
I am grateful to the center for International Business Education and the Chazen Institute of Columbia University for their financial support.
Appendix A
This section describes the Euler equation model used in Section 5 of this paper. It is based on the approach taken by Hubbard, Kashyap, and Whited. The corporate demand for investment begins with an expression for the value of the firm. The net, after-tax return to the owners consists of capital appreciation and current dividends. In equilibrium, owners will maintain their claim in the firm if this return equals their required after-tax return Ri,t:
(1−c)(Et(Vi,t−1−Si,t+1)−Vi,t)+(1−u)Etdi,t+1
Vi,t
where Si,t+1 denotes the value of new shares issued at time t+1; c is the capital
gains tax rate, u is the tax rate on dividends, and di,t+1 is the dividends at time
t+1.
The owners and managers are assumed to be risk neutral and they have rational expectations. Solving 1 forward gives the following expression for the firm’s market value at time 0:
The firm maximizes its value given by Eq. (2) subject to five constraints. The first constraint is the capital stock accounting identity:
Ki,t=Ii,t−1+(1−d)Ki,t−1 (3)
whereKi,tis the capital stock at the end of periodt;Ii,tis the investment at timet;
d is the constant rate of economic depreciation.
The second constraint defines the firm’s dividends as the difference between cash inflows and cash outflows:
di,t=(1−rt)[F(Ki,t−1,Ni,t)−vtNi,t−8(Ii,tKi,t−1)−it−1Bi,t−1]+Si,t+Bi,t
−(1−pt e)
Bi,t−1−pi,tIi,t (4)
where rt is the corporate income tax rate? Ni,t is a vector of variable factors of
production,vt, is a vector of real factor prices,F(Ki,t−1, Ni,t) is the firm’s revenue
function (FK\0, FKKB0), Bi,t is the real value of net debt outstanding, it is the
nominal interest rate, pt
eis the expected inflation rate at time t, p
i,t is the price of
capital goods relative to the price of output, 8(IK, K
i,t−1) is the real cost of
adjusting capital (8I\0,8II\0,8KB0,8IKB0).
The third constraint restricts dividends to be non-negative:
di,t]0 (5)
The fourth constraint limits share repurchases:
Si,t]S* (6)
The fifth constraint prevents the firm from borrowing an infinite amount to pay out as dividends:
The sixth constraint puts a limit on the use of debt finance by assuming that the outstanding debt, Bit, must be less than a debt ceiling Bi* :,t
Bit5B*it (8)
Let lit be the Lagrange multiplier associated with constraint (5) on dividends, and
vit the Lagrange multiplier associated with the constraint (8) on debt. Let m
represent the ratio (1−u)/(1−c). Substituting (4) into (2), the first order
Etbit[(m+li,t+1)/(m+li,t+1)
8(Iit,Ki,t−1) is parameterized so that adjustment costs will be linearly homogeneous
in investment and capital. In that case, marginal and average Qwill be equal:
8(Iit,Ki,t−1)=(a/2)[(Iit/Ki,t−1)−6]Iit
where 6is the bliss point of this adjustment cost function.
Let’s define zit=vit/(m+li,t+1) Therefore, bit is equal to:
Assuming rational expectations and an error term uncorrelated with any
informa-tion known at time t, Eq. (9) becomes:
The marginal product of capital is then defined as:
FK(Kit,Nit)=
Yi,t+1−mCi,t+1
Kit
(14)
where Y is output, m the price markup parameter over original cost, and C real
variable costs.
The last step parameterizes the multiplier associated with the constraint on debt
financing, so that it varies with the stock of liquid assets at time t−1, LIQ:
zit=a1+a2
The hypothesis is that financially constrained firms will have accumulated liquid assets in order to finance their investment projects.
ReplacingFK(Kit,Nit) andzitby their definitions, and including them in Eq. (13),
gives the estimating equation used in Section 5 of this paper.
References
Fazzari, S., Hubbard, G.R., Petersen, B., 1988. Finance constraints and corporate investment. Brook-ings Papers on Economic Activity 1, 141 – 195.
Fremont, C., Latapie, C., 1992, Les privatisations en France: 1986 – 1988. Analyse Financiere 4eme trimestre 1992.
Gilchrist, S., Himmelberg, C., 1995. Evidence on the role of cash flow for investment. Journal of Monetary Economics 36, 541 – 572.
Hoshi, T., Kashyap, A., Scharfstein, D., 1993. The choice between public and private debt: an analysis of post-deregulation corporate financing in Japan. NBER Working Papers Series.
Hoshi, T., Kashyap, A., Scharfstein, D., 1991. Corporate structure, liquidity and investment: evidence from Japanese industrial groups. Quarterly Journal of Economics 106, 33 – 60.
Hoshi, T., Kashyap, A., Scharfstein, D., 1990. Bank monitoring and investment: evidence from the changing structure of Japanese corporate banking relationships. In: Glenn Hubbard, R. (Ed.), Asymmetric Information, Corporate Finance, and Investment. University of Chicago Press, Chicago. Hubbard, R.G., Kashyap, A., Whited, T., 1994. Internal finance and firm investment. Journal of Money,
Credit, and Banking (in press).
Jensen, M., Meckling, W., 1976. Theory of the firm: managerial behavior, agency costs and ownership structure. Journal of Financial Economics 3, 305 – 360.
Jensen, M., 1986. Agency of free cash flow, corporate finance and takeover. American Economic Review 76, 323 – 329.
Kadapakkam, P., Kumar, P.C., Riddick, L.A., 1998. The impact of cash flows and firm size on investment: the international evidence. Journal of Banking and Finance 22, 292 – 320.
Kaplan, S., Zingales, L., 1997. Do investment-cash flow sensitivities provide useful measures of financing constraints? Quarterly Journal of Economics, 169 – 215.
Miller, M.H., Modigliani, F., 1958. The cost of capital, corporation finance, and the theory of investment. American Economic Review 48, 261 – 297.
Myers, S.C., Majluf, M., 1984. Corporate financing decisions when firms have investment information that investors do not have. Journal of Financial Economics 13, 187 – 220.
Oliner, S., Rudebusch, G., 1992. Sources of the financing hierarchy for business investment, Review of Economics and Statistics 74, 643 – 654.
OECD Statistics of Non-Financial Enterprises, 1994.
Petersen, M.A., Rajan, R., 1994. The benefits of lending relationships: evidence from small business data. Journal of Finance XLIX 1, 3 – 37.
Prowse, S.D., 1990. Institutional investment patterns and corporate financial behavior in the US and Japan. Journal of Financial Economics 27, 43 – 66.
Whited, T., 1992. Debt, liquidity constraints and corporate investment: evidence from panel data. Journal of Finance 47, 1425 – 1460.