Innovation dynamics in space: local actors and local
factors
Aki Kangasharju
a,*, Peter Nijkamp
ba
Pellervo Economic Research Institute, Eerikinkatu 28 A, 00180 Helsinki, Finland b
Department of Spatial Economics, Free University of Amsterdam, De Boelelaan 1105, 1081 HV Amsterdam, The Netherlands
Abstract
This paper addresses the issue of technogenesis and its geographical pattern. It aims to offer both a general framework and test on innovation data from several European cities. This framework is built mainly on the product life-cycle and the incubation approach. Further, it is argued that the phases of an industrial life-cycle have several firm-specific effects. First, these phases influence innovativeness and thus profit levels, output and employment of firms in a spatially distinct way. Second, the phases of the life-cycle mirror the importance of local factors for innovation, and third, they affect strategic decisions of firms, for instance by influencing the source of their competitive edge. This paper also aims to model effects of relevant local factors on innovativeness by means of logit analysis, subsequent to a qualitative impact approach based on the recently developed area of rough set analysis. Our empirical results from various European cities show that the successive phases of the industrial life-cycle tend to create spatially recognizable impacts on the innovativeness of firms. Accordingly, the importance of local factors for innovation is also found to reflect a distinct time path. Among more than 20 local factors, the firms interviewed appear to consider support measures for skills training particularly important for innovations. Accordingly, the results of our logit models reveal that skills training links with a local university significantly contribute to the propensity to innovate. # 2001 Elsevier Science Ltd. All rights reserved.
1. Introduction
The literature on technological innovation, technogenesis and its spatial dynamics is vast and covers a wide range of both theoretical and applied studies. For overviews, we refer here inter alia to [4], [7], [9], [13], [19] and [29]. An often observed phenomenon is that major scientific and/or industrial breakthroughs are discontinuous in nature. Once emerged, such radical transformations
*Corresponding author.
tend to produce a rise in new firms or even new industries (see e.g. [33]). In this context, Malecki [24] distinguishes four long-run waves in past centuries. In his view, the last technological revolution or wave commenced in the late 1940s; it is closely linked to a microelectronics cluster of innovative industries. Although major inventions in the microelectronics sector have also affected products of other industries, it may be argued that the effects on other industries are mainly of a process nature. For example, automation of production processes in the traditional metal industry may have increased productivity, but this does not, ipso facto, represent a major technological revolution in the sector itself. Consequently, it may be argued that the metal industry, which, according to Boschma [4], exhibited major breakthroughs in the early stages of the industrial revolution, is now living in a more mature and later phase of its life-cycle than is the microelectronics industry [25].
The present study analyzes the spatial-economic aspects of industrial age differences in spatial innovation dynamics. In so doing, we will focus on the life-cycle and the incubation approach. On the basis of these two paradigms, we design a conceptual model that will serve as an analytical framework for formulating a series of hypotheses. These may be subsequently tested in our empirical work on innovation generation and diffusion in European cities. As part of this work, special attention is paid to the role of local characteristics in innovative behavior.
The paper is organized as follows. It first offers a conceptual model for innovation dynamics in space, which will serve as an analysis framework to derive several testable hypotheses. Second, we aim to test these hypotheses in an exploratory way. Third, an explanatory analysis is carried out. The statistical models used are based on a logit approach and a rough set approach. The data used are derived from the so-called URBINNO network and cover cities from three European countries (Great Britain, Italy, and The Netherlands). Some concluding comments will close the paper.
2. A concise overview of the life-cycle and the incubation approach
life-cycles for technologies and industries1. When adjustments and innovations within existing systems become rare and marginal, new technological systems or regimes will eventually replace the old ones.
A swarming process along technological trajectories can be subdivided into three successive phases, which Davelaar [10] coins incubation, competition and stagnation. (See also Markusen [25]). These phases will now be briefly discussed. During the incubation phase, firms that are either new or incumbent produce numerous early (and often significant) innovations. These are mostly product innovations that are encouraged by the technological push of a basic scientific invention. Products are not yet standardized, which means that the uncertainty concerning market reactions is high. Innovations during this phase put specific demands on the surrounding business environment. Information concerning unstandardized products, market reactions and labor market skills in terms of producing and developing these new products are important conditions for a successful innovation.
During thecompetitionphase, new product innovations tend to become more marginal, while process innovations tend to become more widespread. Product innovations thus lose importance over time, as they cannot be created endlessly within one technological system. Process innovations then gradually take over, since, when further product innovations become increasingly difficult to create and products become more standardized, firms try to improve production processes to enhance their competitiveness. A continuous improvement in competitiveness is also needed as increasing numbers of firms enter a potentially promising market.
Finally, during thestagnationphase, products and services reach a state of market saturation. Consequently, because additional innovations (both product and, later, process innovations) become rare and markets tend to become saturated, price competition rises. This leads to a decrease in the number of firms, and, eventually, to oligopolistic competition.
It ought to be recognized that innovation is a spatial-dynamic process. Initial locations of new technological systems are often seemingly somewhat arbitrary (see Krugman [21]), although, according to Markusen [25], the initial stage of a technological trajectory is usually concentrated in but a few locations. Although not all new production sectors settle at the place of major inventions, in principle, firms tend to agglomerate near innovating firms mainly because of the need for skilled labor and information. Davelaar [10] argues that during the incubation phase, when major product innovations are made, the swarming process of firms is concentrated in central (usually urban) areas; this, because early innovations are more dependent on the urban ‘milieu’ than are subsequent innovations.
As argued above, possibilities to significantly improve existing products decrease during the competition phase: product innovations become more marginal and process innovations take over. These later innovations do not demand as much from the urban ‘production milieu’ as do innovations in earlier stages of a technological trajectory. This is the case since further improvements are concentrated on existing products (which have proven to be the most successful) as well as on the production processes of these goods. Therefore, the presence of a basic research institution is not of crucial importance during this phase. In the meantime, there
1
has been ample opportunity for non-central areas to develop adequate innovation infrastructure to meet new demands. Thus, the innovativeness of entrepreneurs in intermediate and peripheral areas will then tend to rise. Besides, markets in central areas are reaching saturation; hence, households and firms in other areas will take the lead in the adoption of new technologies. Some production plants may even leave the central area and concentrate on growing markets elsewhere. In other words, during the competition phase both supply and demand conditions contribute to a shift in innovation activity to non-central areas.
During the stagnation phase of innovative behavior, especially for standardized high tech products, peripheral (often rural) areas may even be in a favorable position. The relatively low number of innovations and standardization of products reduce the importance of local factors even further, while price competition as the source of competitiveness may then favor peripheral areas where factor prices are likely lower than in central areas.
The technology trajectory theory } in relation to various definitions and concepts of innovation } has also met some criticism (see, among others, [10], [19] and [32]). However, its essence offers a useful framework for the empirical investigation of the dynamics of industrial economic systems.
3. A test framework for space-time innovation patterns
3.1. Spatio-temporal patterns of innovations
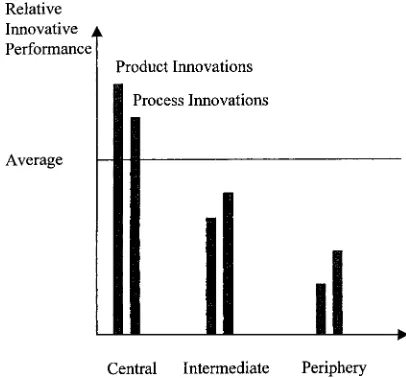
On the basis of previous reflections, we now develop a conceptual space-time analysis framework, which we feel lends itself to empirical testing. The basic feature of this conceptual model is that innovativeness of firms in each of the three distinct areas (central, intermediate and peripheral) is expressed relative to the average innovativeness in all areas. As a consequence, the proposed model differs from more conventional ones where innovativeness is expressed in absolute terms (for a critical analysis, see [1]).
A proper way of studying this conceptual model would be to analyze time series. However, time series analysis at the micro-level of the firm are rare (see e.g. [17], [34]). We therefore resort here to a simplified comparative static approach: we take one point in time and check whether or not our empirical results are in accordance with the space-time implications of our conceptual model.
The conceptual model sketched above has two major implications. The first concerns the link between the innovative performance of firms and their position in a space-time frame: (a) when the share of innovating firms decreases with increasing peripherality, the industry concerned is likely living in the incubation phase of the life-cycle; (b) similarly, if firms in intermediate areas are
Fig. 1. Relative innovative performance in the incubation phase.
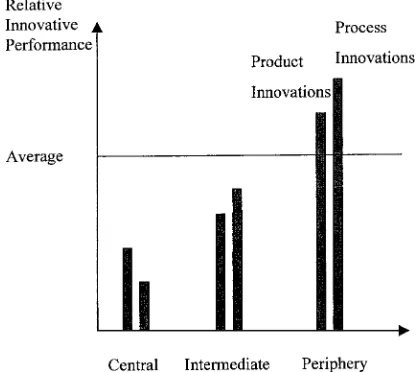
more innovative than firms in central and peripheral areas, then the industry at hand is most probably living in the competition phase; and finally, (c), if firms in peripheral areas have the highest innovation rate, then the industry concerned is likely living in the stagnation phase of its life-cycle.
A second implication concerns relative product and process innovativeness in the three types of areas: regardless of the life-cycle phase, central areas tend to perform better in terms of product than process innovations relative to other areas. Intermediate and peripheral areas tend to show a reverse pattern since process innovations are realized more frequently during later phases when innovative behavior is more concentrated in non-central areas.
Two relevant hypotheses, to be subsequently tested, are derived from the above reasoning. They are as follows:
H1: an industry produces more innovations in earlier phases of its life-cycle.
H2: the phase of the life-cycle of an industry can be identified on the basis of the relative
innovativeness of firms in distinct categories.
If an empirical investigation of a given industry were able to produce a pattern similar to the one depicted in Figs. 1–3, one might plausibly argue that the industry is living in one of the phases of its life-cycle. In addition, we may plausibly argue that the relevant phase of the life-cycle can also be identified on the basis of the competitive edge of firms in the industry. Such issues will be the subject of the next section.
3.2. The technological life-cycle and the competitive edge of firms
Innovation is not a gradual process that takes place in isolation. It may be influenced by strong competition in various stages of the life-cycle. The three above-mentioned phases of the
innovation life-cycle can also be termed state, market and hierarchy, respectively (see [16]). According to Gordon [16], the ‘‘framework of political relations’’ promoted the earliest innovation possibilities, for instance, in microelectronics in the postwar era. Gradually, the path of technical development in this sector became more market-oriented and hence more predictable. This decreased the importance of supportive political relationships, as market linkages were created. This then prompted an increase in the number of new firms. Finally, rising requirements for investment and an uncertain development of demand shifted the market-based innovation system towards vertical integration following the mid-1970s.
The studies of Bramanti and Senn [5] and Markusen [25] show various common elements to this line of thinking. According to Bramanti and Senn, firms face three stages of the strategic life-cycle. First, when a firm introduces a new product, it concentrates on the production space of its activities. Subsequently, when other firms producing the same product enter the market, the focus changes to the market space in addition to the production space. As competition becomes more fierce, additional attention is paid to the support space. During this phase, vertical (seller–buyer) and horizontal (between competitors and between complementary firms) integration and cooperation take place. In other words, it can be argued that the strategic competitive edge of firms within an area tends to exhibit a life-cycle. This cycle would start with product innovativeness as the competitive edge, followed by marketing, and ending with a strategic alliance type of behavior. In this vein, we may formulate another two hypotheses, both related to the firm’s competitive edge and the phases of the life-cycle.
A third hypothesis, which resembles H1 is:
H3: product innovations serve more commonly as a competitive edge in the (more innovative)
younger industries than in older ones.
The product life-cycle and strategic life-cycle approaches together yield a fourth, related hypothesis which resembles H2:
H4: the phase of the life-cycle of an industry can be identified on the basis of how broadly the product innovativeness serves as a competitive edge of firms in distinct area categories.
Before testing these hypotheses, we attend to specific local factors and propose three additional hypotheses that test the importance of the local ‘milieu’ for innovations.
3.3. Innovativeness as a local process
regions, but having identical innovative inputs, may have different innovative outputs. According to Camagni [8], the local ‘milieu’ may enhance innovativeness and thus the growth of firms, if it reduces the intrinsic uncertainty of the innovation process concerned.
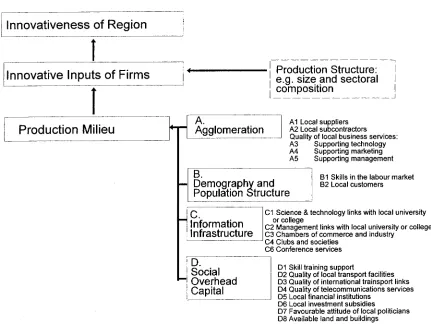
In his study, Davelaar [10] distinguishes four groups of local factors that affect local innovativeness: (i)agglomeration economies, which include location economies accruing from the presence of the same industry, and urban economies accruing from the presence of different industries; (ii) demography and population structure, which refers to local resources of human capital, local customers and size of the local market area; (iii) availability of specialized
information infrastructureincluding intensive communication networks and educational institutes; and (iv)social overhead capital, which responds faster to new demand for technological systems in central areas than in the periphery, and which requires various local institutions and physical infrastructure. (See also [11].)
This role of the so-called ‘production milieu’ can also be interpreted in a different way. Advocates of the ‘innovative milieu’ school argue that human capital, (mainly) informal linkages between firms in a region and synergy effects from a common cultural, psychological and political background, are extremely important [8]. The importance of local resources of human capital
results from the fact that they tend to stimulate local collective learning processes, since labor is more mobile within a region than between regions. Boschma [4] argues that local education and research facilities contribute to this local accumulation of skills and knowledge because producers gain when at least part of the costs of job training, as well as basic R&D, are carried out by such institutions. Camagni [8] emphasizes the importance of informal linkages both between firms and within various economic actors such as firms, employees and institutions. Local formal and informal networks between firms, which are essential in the acquisition of the latest technology, will likely lead to lower information gathering costs. Local institutions are important parts of local networks as they overcome market imperfections that inhibit innovative behavior. The development of collective knowledge as well as formal and informal linkages between suppliers of labor, capital and institutions, contribute to a regional identity and culture, which may result in a desire for cooperation. According to Camagni [8], common cultural roots are important in the formation of tacit knowledge in order to understand and use complex messages as well as in the formation of commonly accepted beliefs on new products and technologies.
It is clear that Davelaar [10] focuses more on static local factors, like infrastructure, which reduce transaction costs and produce external economies, whereas Camagni [8] addresses synergy effects, which promote a collective learning process and reduce dynamic uncertainty. (See also [15] and [17].) These various components of the ‘production milieu’ can be expected to be more favorable in central areas than in other areas, which means that in the incubation phase, when external factors are important for innovations, innovativeness is relatively high in central areas. (See also [28] and [36].)
The above reflections on the role of uncertainty in innovative behavior produces three other testable hypotheses. Our fifth hypothesis takes for granted the fact that local factors reduce the uncertainty inherent in any innovation. Because process innovations enhance the use of existing products, the uncertainty is lower here, and thus the role of local factors tends to be smaller. Therefore, a fifth hypothesis is:
H5: local factors are more important for product than for process innovations.
Our sixth hypothesis is, more than H5, related to the life-cycle approach:
H6: local factors are more important for a (more innovative) modern industry than for a (less innovative) older industry.
This hypothesis seems plausible, as a younger industry tends to produce more product innovations than does an older one.
It goes without saying that local factors are not equally valuable. We will thus also study that subset of local factors considered to be critical success conditions for entrepreneurial innovation. The reasons for different innovative performance may also be related to factors other than phase position in the life-cycle alone. As discussed above, regional innovativeness is determined by production structure and ‘production milieu’ components. In this regard, life-cycle phase affects regional innovativeness through the production structure component.
for a positive impact of urban ‘milieu’ on the innovativeness of firms. This may be further investigated and tested. Therefore, our seventh hypothesis is:
H7: the local‘production milieu’ has a positive impact on innovativeness of firms in an area.
The objective of the next sections is to evaluate whether or not our empirical data support the ideal-typical innovative performance of areas over time, as outlined above.
4. The data set on innovations
In the past decade, there has been an avalanche of innovation studies. Only a few such studies, however, deal with detailed disaggregate data at the firm level based on lengthy interviews using an extensive, systematically structured questionnaire. Cross-national comparative studies are particularly rare. The data set used in our empirical work stems from the so-called URBINNO2 study and has been compiled by extensively interviewing manufacturing companies in the United Kingdom (208 firms), the Netherlands (33) and Italy (32). Structured interviews based on a common survey questionnaire were held among responsible and qualified managers of firms in different manufacturing industries. The survey contained a very extensive list of detailed questions on the motives, types, and consequence of innovative behaviors of firms at the regional plant level. They were chosen so as to cover a broad spectrum of industrial innovations, while the regional categorization was made in such a way that the relative innovativeness of firms in different countries and cities was similar.
For practical reasons, the empirical investigation in our study is mainly concentrated on those industries that have a sufficient number of observations. These are: manufacturing of machinery and equipment (SIC 29); electrical machinery and apparatus (SIC 31); medical precision and optical instruments, watches and clocks (SIC 33); and motor vehicles, trailers and semi-trailers (SIC 34). This was done mainly to avoid biases because of a large industry mix. All industries included in the data set are presented in more detail in Appendix A.
Our empirical investigation also deals with two aggregate sectors in order to have a sufficient data base, viz. the textile, wearing, and leather industries (SIC 17, 18 and 19) and basic materials and metal industries (SIC 27 and 28). This seems a plausible approach as these industries are so close to one another that they will likely benefit from the same sources of technological development and, hence, likely to ‘‘live’’ on the same technological trajectory. The urban background of innovative behavior has been given due attention in the interviews. Clearly, it would have been possible to analyze the firms at a more refined digit level of industrial classification, but then we would have faced a problem of empty cells in our empirical analysis. The precise definition of innovation is always a source of concern. Following the Frascati Manual of the OECD (see [19]), our interviews attempt to identify innovations in a consistent and operational manner. We adopted the most straightforward measure of innovativeness (see [17]).
2
Innovativeness of industries in a city is thus measured by calculating the percentage of firms that has adopted a major (product or process) innovation during the past few years that was regarded as new for the firm. Although this is a rather crude measure of innovation, the questionnaire was designed in such a way that the international and inter-industrial differences were minimized and consistency was assured.
The cities in our sample were subdivided } in conversation with country experts } into central, intermediate and peripheral classes on the basis of their size (see Table 1). This implies that we expected spatial diffusion to emerge not only according to physical distance to central regions, but to their ability and willingness to adopt innovations (approximated here by the size of a city). Though the number and size classes of the cities in each of the three countries could have been better, they were selected in a representative way, thus allowing for a comparative analysis.
5. Exploratory analysis of the innovation data
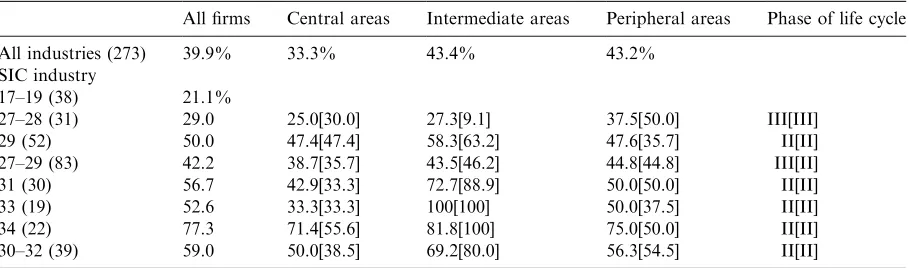
In this section, we will present exploratory results from a descriptive analysis of our data set. Table 2 indicates that 39.9% of the total of 273 firms mentioned an innovation in this context. At a two-digit level, industry 34 turned out to be the most innovative, as 77.3% of the firms in that
Table 1
Percentage of innovating firms by areas and industry classesa
All firms Central areas Intermediate areas Peripheral areas Phase of life cycle
All industries (273) 39.9% 33.3% 43.4% 43.2%
SIC industry
17–19 (38) 21.1%
27–28 (31) 29.0 25.0[30.0] 27.3[9.1] 37.5[50.0] III[III]
29 (52) 50.0 47.4[47.4] 58.3[63.2] 47.6[35.7] II[II]
27–29 (83) 42.2 38.7[35.7] 43.5[46.2] 44.8[44.8] III[II]
31 (30) 56.7 42.9[33.3] 72.7[88.9] 50.0[50.0] II[II]
33 (19) 52.6 33.3[33.3] 100[100] 50.0[37.5] II[II]
34 (22) 77.3 71.4[55.6] 81.8[100] 75.0[50.0] II[II]
30–32 (39) 59.0 50.0[38.5] 69.2[80.0] 56.3[54.5] II[II]
industry mentioned an innovation. In contrast, in industries 27–28 together, only 29.0% mentioned an innovation, while this figure was even lower (21.1%) for firms in industries 17–19. These exploratory results suggest that the spatial pattern of innovativeness should, according to our conceptual model, be as follows: for basic materials and fabricated metal product industries (SIC 27–28) and for textile, wearing, and leather industries (SIC 17–19), the most innovative areas should be found further in the periphery than for the motor vehicle industry (SIC 34).
5.1. Spatial results
The results presented in Table 2 appear to mirror this interesting spatial pattern. The manufacturing sector of basic materials and fabricated metal products (except machinery and equipment) (SIC 27 and 28) is thus likely living in the stagnation phase of its industrial life-cycle: the share of innovating firms here tends to rise with increasing peripherality. The manufacturing sector of motor vehicles, trailers and semi-trailers (SIC 34), on the other hand, is likely in the competition phase where the share of innovating firms is the highest in intermediate areas3. Sectors concerned with the manufacturing of machinery and equipment (29), electrical machinery (31) and medical precision (33) are also likely to be in the competition phase. Table 2 further suggests that overall innovativeness may be higher in intermediate and peripheral areas than in central areas. Thus, approximately 43% of firms in peripheral and intermediate areas mentioned an innovation, whereas approximately 33% of firms in the central areas did so.
By necessity, our city classification is somewhat arbitrary. We thus performed a sensitivity analysis by reassigning firms to a new city classification, provided that we had approximately an equal number of firms in each areal category. This was done because the industries were not spread equally across cities4. The above-described results tend to be rather similar after re-balancing the city classes (see numbers in square brackets in Table 2). These figures also show some evidence that firms manufacturing basic materials and fabricated metal products (except machinery and equipment), i.e. SIC-industries 27–28, are likely to be found in the stagnation phase of their industrial life-cycle while firms manufacturing machinery and equipment (SIC 29), as well as industries in the class SIC 30–39, are in the competition phase. The only change after the re-balancing procedure is that now industries 27–29 appear to live more in the competition phase. In other words, only industries 27–28 and 29 tended to have an impact on the overall outcome as a function of areal classification.
Our conceptual model } based on standard innovation theory } implies that, besides the innovative performance of firms, the source of competitiveness also follows a trajectory in space. The model implies that innovativeness should be the source of competitiveness, particularly in those areas where innovativeness is the highest. In a similar vein, in the more central areas, where relative innovativeness has already decreased, marketing and cooperation should serve as competitive edges. Clearly, the above argument deserves to be empirically investigated, as we
3
We were unable to present spatial results for industries 17–19 because of the low number of innovative firms in the sample.
4
know that central regions are not always the most innovative. We will now test our conceptual model by looking at the question of how many firms consider product innovativeness as their competitive edge over the near future.
5.2. Innovativeness as competitive edge
The results in Table 3, without spatial disaggregation, tend to confirm previous findings. Product innovativeness is thus more commonly seen as a competitive edge for firms that have already innovated than for those who have not. Interestingly, spatially distinct results are not evident to the same extent. Although results for industries 27–28 and 29 are in line with previous patterns, results for industries 30–32 together, and for 31 alone, are more ambiguous. Results for industry classes 34 and 17–19 are, however, different. These results suggest that the most innovative and least innovative industries in our sample are in the stagnation phase and the incubation of the life-cycle.5Results for the textile, wearing, and leather industries imply that new designs and innovations in these industries are made in central areas.
To summarize the results this far, we conclude that phase of the industrial life-cycle tends to have implications for the number of innovations in an industry (H1) as well as for the innovativeness of regions (H2). However, results concerning the competitive edge of firms are more ambiguous. Although product innovativeness is generally seen as a competitive edge for firms that have innovated (H3), a clear spatial pattern for all industries could not be found (H4).
5.3. Product versus process innovations
The next two hypotheses (H5 and H6) involving the importance of the local ‘milieu’ will be tested by means of exploratory background variables derived from a division into four local factors [10] (see Fig. 4). The lists of local factors under the four headings are examples of variables whose presence may contribute to the innovativeness of firms in a region. Further, they are the ones included in the previously mentioned URBINNO questionnaire.
Table 3
Percentage of firms without product innovations as a source of competitive edge
Industry All cities Central areas Intermediate areas Peripheral areas Phase of life cycle
All 35.4% 26.9% 42.6% 37.0% II
17–19 44.7% 100.0 36.4 46.2 I
27–28 12.9 0.0 18.2 25.0 III
29 34.6 31.6 50.0 28.6 II
27–29 26.5 19.4 34.8 27.6 II
31 53.3 57.1 45.5 58.3 (?)
33 47.7 33.3 66.7 20.0 II
34 54.5 42.9 54.5 75.0 III
30–32 48.7 50.0 46.2 50.0 (?)
5
Now, the importance of local factors for product and process innovations will be tested. Table 4 shows the results for all industries taken together. The table includes only those (11) factors that the respondents in our survey most often considered valuable in terms of either product or process innovations. The remaining factors, which were considered valuable factors less often, yielded more or less results similar to those obtained on the basis of the 11 preferred factors. In order to save space, results for these ‘‘other’’ factors are not reported here.
According to the firms surveyed, local factors are more important for product than for process innovations. There were only a few exceptions: ‘Management links with local universities or colleges’ and ‘Quality of local business services supporting technology’ were thus more important from the point of view of process vs product innovations. Hence, overall results indicated that the sampled firms behaved in accordance with our fifth hypothesis (H5).
The results also indicate that local skills in the labor market (B1), and local skills training support (D1) are the most important local factors. It appears that 45.9% of the firms considered skills in the labor market as of ‘some importance’ or of ‘major importance’ for product innovations, while 36.1% did so for process innovations. The respective numbers concerning training support were 41.4 and 36.1%. The quality of telecommunications services (D4), local suppliers (A1) and science and technology links with universities (C1), were the next most important factors.
The above results imply that firms are able to gain benefit by cooperation with a local university as such links can improve those local factors mentioned most commonly as important among the firms surveyed (see also [14]). For instance, the second most important local factor, ‘Training links (D1) with local university’, supports the most important local factor, ‘Skills in the labor market’ (B1); and, a nearly as important factor, viz. ‘Science and technology links with university’ (C1), enhances know-how. Both factors would be possible candidates to promote innovativeness of firms. The role of university links with firms for innovativeness will be further examined by rough set and logit analyses in subsections 6.1 and 6.2, respectively. Our results also show that infrastructure appears to be an important element inducing innovations in terms of ‘Skills training support’ and ‘Quality of telecommunication services’.
Table 4
Percentage of firms who consider a local factor as important for innovations
Local factors For product
innovations
For process innovations Science & technology links with local universities or colleges (C1) 29.7 26.3 Management links with local universities or colleges (C2) 20.7 21.1
Quality of local transport facilities (D2) 27.0 18.8
Quality of international transport links (D3) 27.0 18.8
Quality of telecommunications service (D4) 37.8 28.6
Quality of local business services supporting technology (A3) 26.1 26.3
Skills in the labor market (B1) 45.9 36.1
Skills training support (D1) 41.4 36.1
Local suppliers (A1) 32.4 23.3
Local subcontractors (A2) 28.8 19.5
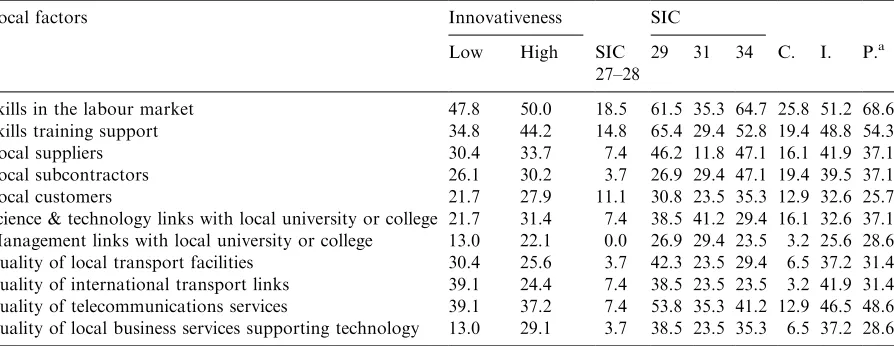
5.4. Young versus old industries innovations
We now focus on our sixth hypothesis. Table 5 presents the results for some selected industries and for firms in distinct areas. The first two columns present the outcomes for highly innovative and low innovative industries. (57% of firms in the former mentioned an innovation in contrast to only 18% of firms in the latter.) Local factors were clearly more often important for high vs low innovative industries. The next four columns present results for selected industries: SIC-industries 27–28, which were found to be in the stagnation phase, appear to consider local factors as less valuable than industries that were found to be in the competition phase (industries 29, 31 and 34). The results again show that local factors tend to be more important for themore innovative industries than for the less innovative industries. The last three columns show results for firms in the distinct area categories. The message here is that local factors were important for more firms in the peripheral and intermediate areas than for firms in central areas. In this regard, we recall that firms in peripheral and intermediate areas innovated more often than those in central areas (see Table 2). Such results indicate that, regardless of the classification used (high or low innovative industry, different industries, distinct areas), we find that the more firms innovate the more important are local factors. Clearly, these results support our sixth hypothesis (H6).
5.5. ‘Production milieu’ and innovativeness
Our final exploratory test concerns the seventh hypothesis (H7). The resulting correlation coefficient between the innovation dummy (whether or not a firm has innovated) and industrial classification (subdivides industries into more and less innovative industries), turns out to be 0.39, which is not very high. This means that the presence of highly innovative industries explains only part of urban innovativeness. Similarly, when firms in the high and low innovating industries were classified according to city categories, it appears that in the intermediate areas, where firms are
Table 5
Percentage of firms who consider a local factor as important for product innovations
Local factors Innovativeness SIC
Low High SIC 27–28
29 31 34 C. I. P.a
Skills in the labour market 47.8 50.0 18.5 61.5 35.3 64.7 25.8 51.2 68.6 Skills training support 34.8 44.2 14.8 65.4 29.4 52.8 19.4 48.8 54.3
Local suppliers 30.4 33.7 7.4 46.2 11.8 47.1 16.1 41.9 37.1
Local subcontractors 26.1 30.2 3.7 26.9 29.4 47.1 19.4 39.5 37.1
Local customers 21.7 27.9 11.1 30.8 23.5 35.3 12.9 32.6 25.7
Science & technology links with local university or college 21.7 31.4 7.4 38.5 41.2 29.4 16.1 32.6 37.1 Management links with local university or college 13.0 22.1 0.0 26.9 29.4 23.5 3.2 25.6 28.6 Quality of local transport facilities 30.4 25.6 3.7 42.3 23.5 29.4 6.5 37.2 31.4 Quality of international transport links 39.1 24.4 7.4 38.5 23.5 23.5 3.2 41.9 31.4 Quality of telecommunications services 39.1 37.2 7.4 53.8 35.3 41.2 12.9 46.5 48.6 Quality of local business services supporting technology 13.0 29.1 3.7 38.5 23.5 35.3 6.5 37.2 28.6
a
most innovative, (1) only 40.4% belong to highly innovating industries (i.e., less than half), and that (2) only 26% of firms of the highly innovating industries are located in intermediate areas (i.e., less than 33.3%). In addition, consider the three two-digit SIC-industries (29, 31 and 34), which have the most observations and have innovated most commonly. These firms distribute across the three city categories, with 35 in peripheral areas, 32 in central areas, and 26 in intermediate areas. In other words, the presence of highly innovating industries does not explain all differences in the innovativeness of areas. This leaves room for other explanatory factors that make firms in one industry more innovative in intermediate areas vs the central or peripheral areas. The production ‘milieu’ will thus likely have some effect on the innovativeness of firms, a result which supports our seventh hypothesis (H7). Following this exploratory research, we offer an explanatory analysis in the next two sections.
6. Explanatory analysis
6.1. Rough set analysis
We now seek some further evidence for the importance of the ‘production milieu’ in terms of innovativeness of firms (H7). We do this by applying rough set analysis, which is a fairly recent classification method of an ‘if–then’ nature (see e.g. [27] and [30])6. Such analysis places objects into equivalence classes using available attributes that act as equivalence relationships for the objects considered. Objects in the same equivalence class are indiscernible (indistinguishable). A class that contains only indispensable equivalence relationships (attributes) is called a core. An attribute isindispensableif the classification of the objects becomes less precise when that attribute is left out. The values of the attributes of all objects may be subdivided into condition
(background) and decision(response) attributes.
The objectives of a rough set analysis are usually, first, to classify decision attributes on the basis of condition attributes and, second, to form decision rules that are basically implication relationships between the condition and decision attributes. Decision rules can be seen as conditional statements of an ‘if–then’ nature. In this sense, rough set analysis may be interpreted as a qualitative conditional explanatory method. It basically evaluates the importance of attributes for a classification of objects, reduces all superfluous objects and attributes, discovers the most significant relationships between the condition attributes and objects’ assignments to decision classes, and then represents these relationships in the form of decision rules [31]. The reliability of the explanatory model used in a rough set context can be judged by means of the so-called quality of classification. For more details, we refer the reader to [6]. Although a conventional discriminant analysis is rather similar to rough set analysis, the former is more suitable for classification issues, while the latter is particularly appropriate for explanatory conditional statements in the case of qualitative or categorical multidimensional statements
6
obtained in interviews. We will therefore apply rough set analysis for our explanatory empirical work.
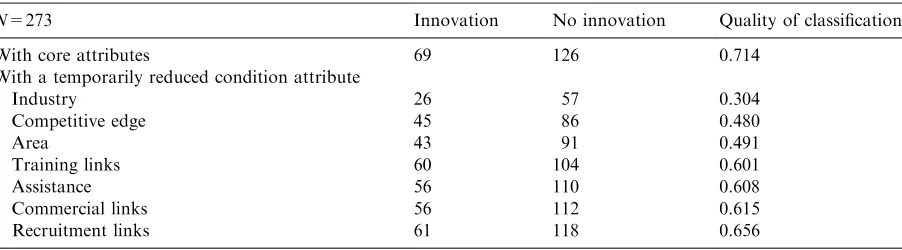
In our rough set analysis, a total of 273 firms appear to act as indiscernible objects. The decision attribute (dependent variable) is here whether or not a firm has innovated. Our investigation focuses on those condition attributes (local milieu factors) that, in the above exploration, turned out be the most important. The condition attributes (explanatory variables) are the following: (1) industry (SIC industries 17–19, 27–28, 29, 31, 33, 34, and the class ‘rest’); (2) area (central, intermediate, and periphery); (3) competitive edge (innovativeness; cost-effectiveness; and marketing, financing, or other); (4) training links (yes, no); (5) commercial links (yes, no); (6) recruitment links (yes, no) with a local university; and (7) assistance (investment, training, or other) given by a local or regional institution. ‘Production milieu’ variables (4–7) represent important local factors, i.e., various links of firms with local institutions (see Table 4).
As shown in the first row of Table 6, the condition attributes appear to allocate 69 firms to the class ‘innovation’ and 126 firms to the class ‘no innovation’ (lower approximations). This means that of the total 273 firms, 71.4% could be classified as either innovative or non-innovative. An interesting rough set result was that all condition attributes were assigned to the core. In other words, there were no redundant attributes, which means that an exclusion of one of these features would reduce the accuracy of classification. This result tends to show that both ‘production milieu’ and structure should be considered important attributes of innovativeness.
The relative importances of the attributes can be investigated by dropping one at a time from the core. The lower rows in Table 6 show the number of classifications and the quality (percentage) of classifications when each attribute is excluded in turn. The second row indicates that when the attribute ‘Industry’ is excluded, the quality of classification is the lowest; then, only 30.4% of the firms can be classified. The fact that areal condition is almost as important as industry supports our prior view on spatial variations of innovativeness (H2). Note that the quality of classification decreases the least when ‘Recruitment links’ is excluded. But, even then, 65.6% of the firms can still be classified.
Although link attributes (milieu variables), namely training, commercial, recruitment and assistance attributes, tended to be less important than the others for proper classification of firms in terms of innovativeness, they belong to the core and are necessary for a high quality
Table 6
Lower approximation for rough set classes
N=273 Innovation No innovation Quality of classification
classification. The rough set results thus clearly indicate that ‘production milieu’ tends to affect the innovativeness of firms in a region, a finding that supports our seventh hypothesis (H7).
6.2. Logit analysis
We now offer an explanatory analysis for the firm’s innovative behavior by applying a logit analysis. We thus model innovativeness by industrial, areal, and ‘production milieu’ variables in order to test our previous hypotheses (except H5). Logit analysis cannot be applied to the testing of hypothesis H5because our data set does not include separate measurable variables for product and process innovations.
In our data set on industrial attributes, only 0–1 dummy categorical variables are available. Variables that begin with IND. . .(e.g. IND1719DUM) are dummies for the six selected industries. CITYPERI and CITYINTE are the two areal dummies for firms in the peripheral and intermediate areas, respectively. EDGEDUM is the dummy for firms having product innovativeness as the competitive edge in the near future. UK and Italy are the two country dummies that account for differences in innovativeness in the countries considered. The ‘production milieu’ variables mainly represent those local factors found to be important among firms surveyed, viz. various links of firms with local institutions. A variable that begins with LINK. . .is one of three dummies for the industries having commercial (LINKCOMM), training (LINKTRAI), or recruitment (LINKRECR) links with a local university or college. The possible impact of commercial (consultancy, testing, subcontracting, joint ventures) and training links is more easily justified than that of recruitment links. This is because they correspond to two commonly and highly valued local factors, viz. ‘Skills training support’ and ‘Science and technology links’. Nevertheless, we do not wish to exclude the dummy for recruitment links a priori. Finally, ASSTRAIN is the dummy for firms that have received training assistance from a local (or regional) public sector institution or agency7. In sum, we have 15 dummy variables in our data set.
6.2.1. Effects of industry, location and local factors
We first model the propensity to innovate by using all 15 dummies reflecting industrial structure, location, or local factors. We use here Theil’s sequential elimination procedure by discarding one redundant variable at a time from the equation, beginning with the most insignificant [35]. This reduction procedure is continued until only statistically significant regressors are left in the explanatory model.
The above-described procedure led to the specification shown in Table 7. Results imply that the relatively more innovative industries significantly contribute to the propensity of a firm to innovate. Less innovative industries apparently do not contribute to innovation propensity. We recall here that SIC-industries 17–19 and 27–28 were found to be less innovative with 29, 31, 33, and 34 being more innovative. This outcome thus confirms results obtained in the descriptive analysis and supports the first hypothesis (H1).
7
Spatial or country dummies were found to be not significantly related to the innovation propensity of all firms, implying that firms in a given area are not necessarily more innovative than firms in other areas (see Table 7). Below we will test whether or not regionally discriminating differences can be found at the industry level, i.e. whether or not we can find results that support our second hypothesis. These differences would imply a specific locational pattern for the industries concerned.
An interesting result in Table 7 is that firms with innovativeness as their competitive edge in the near future have apparently not been significantly more innovative in the past than the others. A plausible reason for this result, which is different from that obtained by rough set analysis, is that, in the latter, the attribute ‘Competitive edge’ also included cost effectiveness, marketing and financing. In the logit analysis, the corresponding ‘Edge’ variable was a normal dummy representing only innovativeness as the competitive edge. This result suggests a need for further empirical investigation.
Training links were found to be positively related to innovativeness, but not so for commercial or recruitment links (see Table 7). This indicates that such factors as training links with a local university contributed to innovations in all three countries, a result that partially supports our seventh hypothesis (H7). This also complies with the above-obtained results that ‘milieu’ factors are not equally important. This result is also in line with the previous finding that firms more often regard skills training support as an important local factor inducing innovations vs science and technology links (commercial links) or managerial links with the local university. We also found that training support from other local or regional institutions was not a statistically significant regressor. This implies that skills training support offered by a university tends to be more important than that offered by other skills training institutions. A related question asks: to which industries does the most important factor, viz. training links, contribute to innovativeness. Also important is whether other links (commercial and recruitment) contribute to innovativeness in any industry. In this regard, we are interested in confirmation of H6 and further support for H7.
6.2.2. Locational pattern of innovativeness
We now test our second hypothesis (H2) by investigating whether or not the sampled industries have any specific locational pattern. We do so by splitting variables for the six selected industries
into central, intermediate and peripheral classes and adding separate dummies for industries in these areas. For instance, we added three separate variables for firms in industry 34. One is for firms in central areas, a second for firms in intermediate areas, and a third for firms in peripheral areas. Similarly, we added three dummies to represent firms in the distinct areas with a training link variable since the latter was a significant regressor in the Table 7 specification. The model reduction procedure used here is the same as above, with results of our logit model given in Table 8.
The results in Table 8 suggest that firms in industries 29, 31, and 34 tend to innovate more often when they are located in intermediate areas. This result is in accordance with previous findings from our descriptive analysis, while supporting the second hypothesis (H2). For the remaining ‘innovative’ industry (33), firms in all areas contributed to innovation propensity (see Table 7). The conceptual model and results of the descriptive analysis would also imply that firms in less innovative industries would innovate less often when they are located in central areas than otherwise. This plausible assumption does not, however, seem entirely valid. Centrally located firms in basic materials and fabricated metal product industries (firms in industries 27–28) are apparently not less innovative than firms in the same sector located elsewhere. On the contrary, the logit model seems to suggest that firms in the textile, wearing, and leather industries (SIC industries 17–19) would innovate less often when they are located in peripheral areas. This, however, contradicts the second hypothesis but is in accordance with findings from the exploratory analysis. We suggest this since, apparently, the technogenesis of new design and innovations in the textile and wearing industries are not taking place in the periphery.
6.2.3. Innovativeness and links with universities
We now deal with our sixth (H6) and seventh hypotheses (H7). These hypotheses can be tested by separating the firms within each industry into two classes, viz. those with a link (LINKTRAIN, LINKCOMME and LINKRECR) and those without a link (LINKTRNO, LINKCONO and LINKRECNO). This subdivision was made for all three links, namely training, commercial and recruitment. Following the model reduction procedure, we derived the estimation results of Table 9. This table prompts us to make the following comments.
The firms in industries 29 and 33 with training links appeared to innovate more often than firms in other industries with such links or firms in the same industries without training links. This implies that training links are more important for relatively more innovative than for less innovative industries, offering partial support to our sixth hypotheses. The firms in industry 31 with commercial links tended to innovate more often than firms in other industries or those in the same industries without commercial links. In this regard, firms in industry 34 with commercial links appeared to be more innovative than did firms in other industries with commercial links or firms in the same industry without commercial links. However, a conflicting findings was made: firms in industry 34 without commercial links were found to be more innovative. This suggests that commercial links do not play a decisive role in the car manufacturing industry (34), but are likely relevant in the electronics industry (31). Further, commercial links may be more important for more innovative than for less innovative industries, which also renders partial support to the sixth hypothesis. H7 is also partly supported by these results, since they indicate that such local factors as training and commercial links with a local university influence the innovativeness of firms.
Table 9 also shows that firms in industry 29 with recruitment links tended to innovate less often than did firms in other industries with such links or firms in the same industry without recruitment links. This did not seem to be the case for other industries. Indeed, for one of the younger industrial sectors, recruitment links may even have a negative effect on innovativeness, a finding that implies a low importance for recruitment links in terms of innovativeness8.
Table 9
6.2.4. Innovations and competitive edge
We now test our third (H3) and fourth (H4) hypotheses. To do so, we must first change our dependent variable, which becomes ‘innovativeness as competitive edge’, a 0–1 dummy. Table 10 shows the results following the model reduction procedure (initially, all six industry dummies were included in the model). Note that firms in the less innovative basic materials and fabricated metal manufacturing sectors (SIC 27–28) appear to have a lower propensity for innovativeness as competitive edge than do firms in other industries. Moreover, Table 10 shows how firms in the more innovative electronics and car manufacturing industries (SIC 31 and 34) have a higher tendency for innovativeness as their competitive edge than do firms in other industries. These findings support our third hypothesis.
Finally, Table 11 was obtained after splitting all six industries into central, intermediate, and peripheral classes and carrying out the reduction procedure. Results here are not as robust as above. We found that firms in a more innovative (young) industry (SIC 34) tended to use innovativeness as a vehicle for competitive edge when they are located in intermediate areas than otherwise. This is in accordance with our fourth hypothesis. We also found an inconclusive result: that firms in another young industry (SIC 31) regarded innovativeness as their competitive edge more often when located in the periphery. This contradicts H4 and thus calls for additional research.
7. Concluding comments
Innovation research is a fruitful undertaking as the interface of industrial economics and economic geography. The present study dealt with an ideal–typical model of spatial innovation processes, based on product life-cycle and incubation approaches. Our cross-sectional results tend
Table 10
Dependent variable: innovation as competitive edge -2 Log Likelihood: 378.1616 (restricted model) -2 Log Likelihood: 352.068 (full model)
Variable B SE
IND2728DUM ÿ0.9929 0.4354
IND31DUM 0.9318 0.4555
IND34DUM 0.1567 0.5715
Constant ÿ0.0632 0.6634
Table 11
Dependent variable: innovation as competitive edge -2 Log Likelihood: 378.1616 (restricted model) -2 Log Likelihood: 359.760 (full model)
Variable B SE
CITYPERI*IND31DUM 2.4799 1.0521
CITYINTE*IND34DUM 2.3826 1.0564
to show that spatial innovation behavior is largely in accordance with patterns implied by the phases of the industrial life-cycle (H1and H2). On the basis of spatial innovativeness, we may thus conclude that the two-digit industries 27–28 tend to live in the stagnation phase of their technological life-cycle, while industry categories 29, 31, 33, and 34 tend to live in the competition phase. Intuitively, this is an appealing result, since firms manufacturing basic materials and fabricated metal products
} except machinery and equipment (27–28)} likely belong to more mature industries than firms manufacturing electrical machinery and apparatus (31). These results were obtained by both our exploratory and logit analyses (see Table 12 for a general survey of our study).
Our conceptual model and the empirical findings have implications for regional economic development. We may thus argue that at the beginning of the industrial life-cycle, innovativeness should be greatest in central areas. This implies that centralizing forces are in effect during this phase. However, when the industrial life-cycle reaches its later phases, then decentralizing forces take over, as implied by a higher innovativeness of firms away from the center. A great deal of empirical evidence has been found elsewhere for this so-called convergence hypothesis within industrialized countries and regions within a given country. (See, e.g., [3,18].)
Our empirical results for competitive edge were less satisfactory (H3and H4in Table 12). We found that more innovative (younger) industries regard innovativeness more often as the competitive edge than do less innovative (older) industries, a result that supports our third hypothesis (H3). However, spatial results did not unambiguously support our conceptual model. In this context, it was difficult to identify a clear regional pattern, especially in the case of the more innovative industries (H4). It is clear, therefore, that further research is needed to shed light on the spatio-temporal dynamics of firms’ strategic behavior.
Finally, empirical results for the importance of local factors supported the hypotheses derived from our conceptual model (H5, H6 and H7). The exploratory analysis thus produced some evidence that local factors are considered more important for product than for process innovations while they are more important for more innovative, younger industries than for less
Table 12
Summary of the resultsa
Hypotheses Exploratory Logit Rough set
H1:an industry produces more innovations in earlier phases of its life-cycle + + 0 H2:the phase of the life-cycle of an industry can be identified on the basis
of the relative innovativeness of firms in distinct categories
+ + 0
H3:product innovations serve more commonly as a competitive edge in younger industries than in older ones
+ + 0
H4:the phase of the life-cycle of an industry can be identified on the basis of how broadly the product innovativeness serves as a competitive edge of firms in distinct categories
ÿ ÿ 0
H5:local factors are more important for product than for process innovations + 0 0 H6:local factors are more important for a modern industry than for an
older industry
+ + 0
H7:the local‘production milieu’has a positive impact on innovativeness from firms in an area
+ + +
aNote: ‘+’ denotes confirmatory findings, ‘
ÿ’ denotes contradictory findings, and ‘0’ denotes situations where a
innovative, older industries. We also saw that possible cooperation of firms with a university may incorporate factors most commonly mentioned as important, viz. skills of the labor force by training links, and science and technology links. The logit analysis revealed that, among links with universities, training links tend to be more important for innovativeness than do commercial or recruitment links. This suggests future policy consider increased schooling and training expenditures. All rough set, logit and exploratory correlation analyses also produced some evidence that the production structure of regions would not entirely govern their innovativeness. Thus, various local factors may affect innovativeness of firms, implying the importance of production ‘milieu’. It would therefore be wise regional development policy if firms in peripheral (rural) areas would attempt to compensate for their peripherality (lack of agglomeration economies, etc.) through active cooperation with area universities. Similarly, this calls for action by local and regional governments to improve the local business environment, by, for example, attracting new firms. Given these results, it seems plausible that a stimulation of skills in local labor markets (based on existing academic knowledge) is an effective strategy for encouraging innovation.
Acknowledgements
This study was part of a research project funded by the Academy of Finland. The authors wish to thank Marina van Geenhuizen, Tomaso Pompili and Peter Townroe for their assistance in collecting the data.
Appendix A
Industries in the Questionnaire
SIC codes Name
15–19 Food and beverage (15), tobacco (16), textiles (17), wearing apparel, dressing and dyeing of fur (18), tanning and dressing of leather: luggage, handbags, saddlery, harness and footwear (19).
20–29 wood, wood products, cork, except furniture: articles of straw and plaiting materials (20), paper and paper products (21), publishing, printing and reproduction of recorded media (22), chemicals and chemical products (24), rubber and plastics products (25), basic materials (27), fabricated metal products, except machinery and equipment (28), machinery and equipment (29).
30–39 electrical machinery and apparatus (31), radio, TV and communication equipment and apparatus (32), medical precision and optical instruments, watches and clocks (33) motor vehicles, trailers and semi-trailers (34), other transport equipment (35), furniture and manufacturing (36), recycling (37).
References
[1] Abernathy W, Utterback JM. Dynamic model of process and product innovation. Omega 1975;3:639–656. [2] Baaijens S, Nijkamp P, van Montfort K. Explanatory meta-analysis for the comparison and transfer of regional
tourist income multipliers. Regional Studies 1998;32(9):839–851.
[3] Barro R, Sala-i-Martin X. Economic Growth. New York: McGraw-Hill, 1995.
[4] Boschma RA. Looking Through a Window of Locational Opportunity: A long-term spatial analysis of techno-industrial upheavals in Great Britain and Belgium. Amsterdam: Thesis, 1994.
[5] Bramanti A, Senn L. Innovation, Firms and Milieu: a Dynamic and Cyclic Approach. In: Camagni R, editor. Innovation Networks: Spatial Perspectives. London: Belhaven Press, 1991. p. 105–120.
[6] Bergh van den JCJM, Button K, Nijkamp P, Pepping G. Meta-Analysis for Environmental Economics. Dordrecht: Kluwer, 1997.
[7] Bertuglia CS, Lombardo S, Nijkamp P, editors. Innovative Behaviour in Space & Time. Berlin: Springer, 1997. [8] Camagni R. Local ‘milieu’, uncertainty and innovation networks: towards a new dynamic theory of economic
space. In: Camagni R, editor. Innovation Networks: Spatial Perspectives. London: Belhaven Press, 1991. p. 121– 144.
[9] Cappellin R, Nijkamp P. The Spatial Context of Technological Development. Aldershot, UK: Avebury, 1989.
[10] Davelaar EJ. Regional Economic Analysis of Innovation and Incubation. Aldershot, UK: Avebury, 1991. [11] Davelaar EJ, Nijkamp P. Spatial dispersion of technological innovation: a review. In: Bertuglia CS, Lombardo S,
Nijkamp P, editors. Innovative Behaviour in Space & Time. Berlin: Springer, 1997.
[12] Dosi G. The nature of the innovative process. In: Dosi G et al., editors. Technical Change and Economic Theory. London: Printer, 1988.
[13] Freeman C, Perez C. Innovation, diffusion and new techno-economic paradigms. In: Arcangeli F, David P, Dosi G, editors. The Diffusion of New Technologies, vol. 1. Oxford: Oxford University Press, 1986.
[14] Geenhuizen M, Nijkamp P. Technology transfer: how to remove obstacles in advancing employment growth. In: Kuklinski A, editor. Production of Knowledge and the Dignity of Science. Warsaw: Euroreg, 1995.
[15] Gertler MS. ‘‘Being there’’: proximity, organization, and culture in the development and adoption of advanced manufacturing technologies. Economic Geography 1995;71(1):1–26.
[16] Gordon R. Innovation, industrial networks and high-technology regions. In: Camagni R, editor. Innovation Networks: Spatial Perspectives. London: Belhaven Press, 1991. p. 174–195.
[17] Harrison B, Kelley MR, Gant J. Innovative firm behavior and local milieu: exploring the intersection of agglomeration, firm effects, and technological change. Economic Geography 1996;72(3):233–258.
[18] Kangasharju A. b Convergence in Finland: regional differences in speed of convergence. Applied Economics 1998;30:679–687.
[19] Kleinknecht A. Innovation Patterns in Crisis and Prosperity. London: Macmillan, 1987.
[20] Kline SJ, Rosenberg N. An overview of innovation. In: Landau R et al., editors. The Positive Sum Strategy. Washington, DC: National Academy Press, 1987.
[21] Krugman P. Geography and Trade. Leuven: Leuven University Press, 1991.
[22] Love JH, Achcroft B, Dunlop S. External ownership, corporate structure and product innovation. In: Paper presented at 36th Congress of the European Regional Science Association, 26–30 August, 1996.
[23] Maillat D. SMEs, innovation and territorial development. In: Cappellin R, Nijkamp P, editors. The Spatial Context of Technological Development. Aldershot, UK: Avebury, 1990.
[24] Malecki EJ. Technology and Economic Development: The Dynamics of Local, Regional and National Change. London: Longman, 1991.
[25] Markusen AR. Profit Cycles, Oligopoly and Regional Development. Cambridge, Mass: The MIT Press, 1987. [26] Ormrod RO. Local context and innovation diffusion in a well-connected world. Economic Geography
1990;66(2):109–122.
[27] Pawlak Z. Rough Sets: Theoretical Aspects of Reasoning about Data. Dordrecht: Kluwer, 1991.
[29] Ratti R. Small and medium-size enterprises, local synergies and spatial cycles of innovation. In: Camagni R, editor. Innovation Networks: Spatial Perspectives. London: Belhaven Press, 1991. p. 71–88.
[30] Slowinski R, editor. Intelligent Decision Support: Handbook of Applications and Advances of the Rough Sets Theory. Dordrecht: Kluwer, 1993.
[31] Slowinski R, Stefanowski J. ‘Roughdas’ and ‘roughclass’ software implementations of the rough sets approach. In: Slowinski R, editor. Intelligent Decision Support: Handbook of Applications and Advances of Rough Sets Theory. Dordrecht: Kluwer, 1993.
[32] Storper M. Technology and new regional growth complexes: the economics of discontinuous spatial development. In: Symposium on Technological Change, Employment and Spatial Dynamics, Zandvoort, Netherlands, 1–3 April, 1985.
[33] Suarez-Villa L. The Evolution of Regional Economies: Entrepreneurship and Macroeconomic Change. New York: Praeger, 1989.
[34] Tervo H, Niittykangas H. Developments in the growth, location and turbulence of business services in Finland. Papers in Regional Science 1994;73(1):73–95.
[35] Theil H. Principles of Econometrics. New York: Wiley, 1971.
[36] Thwaites A, Alderman N. The location of industrial R&D. In: Cappellin R, Nijkamp P, editors. The Spatial Context of Technological Development. Aldershot, UK: Avebury, 1990.