Livestock Production Science 63 (2000) 27–38
www.elsevier.com / locate / livprodsci
Effect of reducing nitrogen fertilizer on grassland on grass
intake, digestibility and milk production of dairy cows
*
H. Valk , I.E. Leusink-Kappers, A.M. van Vuuren
DLO-Institute for Animal Science and Health(ID-DLO), Department of Ruminant Nutrition, P.O. Box 65, 8200 AB Lelystad,
The Netherlands
Received 25 November 1998; received in revised form 7 May 1999; accepted 24 May 1999
Abstract
To quantify the effect of a reduction in nitrogen fertilizer on grass intake and animal performance, four zero-grazing experiments were carried out, two in spring / early summer and two in late summer. Grass was fertilized at three levels of N fertilizer, 450, 300 and 150 kg / ha per year and harvested daily at dry matter yields between 1500 and 2000 kg / ha. Grass was fed ad libitum to three groups of 12 dairy cows in mid lactation. Reducing fertilizer N decreased crude protein content and in-vitro digestibility, but increased sugar content in grass. Overall, in the spring experiments, a reduction in N fertilization from 450 to 150 kg / ha per year did not affect grass intake. In one of the experiments carried out in spring, net energy intake of cows offered 150N grass was lower, resulting in lower milk yields. In late summer, cows consumed less 150N grass and produced less yields of milk, fat and protein compared to the other treatments. Except for milk production differences in S , a reduction of N fertilizer from 450 to 300 kg / ha per year did not affect intake or milk production.92
2000 Elsevier Science B.V. All rights reserved.
Keywords: Grass; N-fertilization; Intake; Digestibility; Milk production
1. Introduction grass (Minson, 1990). However, the disadvantages of using high levels of N fertilizer to the environment
In intensive grassland management systems, high become more and more apparent. Under grazing
nitrogen (N) application increases grass growth and conditions, grass is usually vegetative containing
as a consequence grass can be harvested, either by high amounts of rapidly rumen degradable N which
grazing or by cutting, in earlier stages of maturity is poorly utilized. This may result in high N-losses to
(vegetative, pre- and early bloom) giving high nutri- the environment, hence causing ammonia
volatilisa-tive values and maximum voluntary intake (VI) of tion and nitrate leaching (Tamminga, 1992).
There-fore, the use of less N fertilizer on grassland becomes possibly more attractive.
The effects on grass production, chemical
com-*Corresponding author. Tel.: 131-320-238-238; fax: 1
31-position and nutritive value of using lower amounts
320-237-320.
E-mail address: [email protected] (H. Valk) of N fertilizer are well documented and reviewed by
28 H. Valk et al. / Livestock Production Science 63 (2000) 27 –38
Minson (1990). However, little is known about the and in August–September (late summer) of 1992
effects of reduced amounts of N fertilizer on VI and (A ) and 1993 (A ). Before the start of each92 93
animal performance of dairy cows during the grow- experiment 36 multiparous Holstein–Friesian
ing season. Most experiments in literature were crossbred dairy cows in mid lactation were allocated
carried out with sheep offering very mature grass. It to 12 blocks of three cows on the basis of calving
is uncertain whether the results of those experiments date, milk yield and milk composition. Means of the
can be extrapolated to dairy cows grazing grass in stage of lactation and milk production data of the 12
earlier stages. When grass is harvested on the same cows per treatment at the start of the experiments,
day after regrowth, N fertilizer has no consistent are given in Table 1. Cows were housed in tie stalls
effect on VI, indicating that the effect of N on VI is on rubber mats and had free access to water. Within
strongly related to stage of maturity (Minson, 1990). each block cows were allotted at random to one of
Therefore, more information is needed about the the three treatments. Treatments were three rations
effects of reducing N fertilizer on VI and milk containing fresh grass harvested daily and fertilized
performance of dairy cows offered grass cut at with either 450 (N450), or 300 (N300), or 150 (N150)
similar dry matter (DM) yields. kg N / ha per year. Cows received daily 1 kg in the
The objective of our experiments was to quantify early and 2 kg compound feed in the late summer
the effects on VI and milk performance of dairy cows experiments which amount was offered in two equal
fed indoors with grass grown at three different portions during milking. This compound feed
con-annual levels of N application (450, 300 and 150 tained sugar beet pulp (20%), citrus pulp (20%),
kg / ha) during two different periods (spring / early maize gluten feed (22.5%), palm kernel expeller
summer and late summer). In order to minimize the (15%), soybean hulls (8%) and other ingredients.
effect of stage of maturity on VI and to connect with Faecal output was estimated by marker technique.
the practical grazing situation, VI of grass is tried to Therefore, 4 g Cr 0 per kg was added to another2 3
compare at DM yields between 1500 and 2000 kg / ha compound feed (Cr compound) containing sugar
for the three N treatments. beet pulp (15%), maize gluten feed (20%), palm
kernel expeller (17.5%), soybean hulls (14%), lin-seed expeller (8%), coconut expeller (8%), wheat
2. Materials and methods (7.5%) and other ingredients. Cows received 1 kg of Cr compound per day in two equal portions after
2.1. Cows and treatments milking. Chemical composition and nutritive value
of the commercial and Cr compound feeds did not
Experiments were carried out in May–July differ between years. They contained per kg DM: 93
(spring / early summer) of 1991 (S ) and 1992 (S )91 92 and 101 g ash, 178 and 163 g CP, 50 and 46 g CF, 21
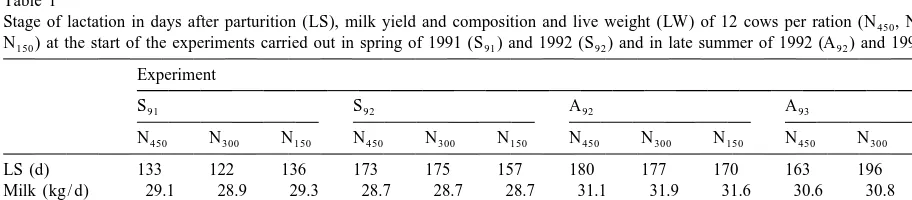
Table 1
Stage of lactation in days after parturition (LS), milk yield and composition and live weight (LW) of 12 cows per ration (N450, N300and N150) at the start of the experiments carried out in spring of 1991 (S ) and 1992 (S ) and in late summer of 1992 (A ) and 1993 (A )91 92 92 93
Experiment
S91 S92 A92 A93
N450 N300 N150 N450 N300 N150 N450 N300 N150 N450 N300 N150
LS (d) 133 122 136 173 175 157 180 177 170 163 196 222
Milk (kg / d) 29.1 28.9 29.3 28.7 28.7 28.7 31.1 31.9 31.6 30.6 30.8 30.6 Fat (g / kg) 46.5 47.1 46.4 45.7 45.7 45.6 40.0 40.2 39.8 40.7 40.6 40.3 Protein (g / kg) 35.4 35.6 35.5 36.6 35.8 35.8 32.5 32.2 32.5 34.1 34.4 34.3
H. Valk et al. / Livestock Production Science 63 (2000) 27 –38 29
and 103 g starch, 347 and 383 g NDF, 97 and 70 g the third harvest of 150N plots was fertilized with an
DVE (Tamminga et al., 1994) and 1061 and 1032 extra supply of 40 kg / ha.
VEM (Van Es, 1978) for the commercial and Cr compound, respectively. The experiments carried out
2.3. Sampling and measurements
in spring / early summer started on 13 May in S91and
on 18 May in S92 and lasted for 10 weeks. The
Grass was harvested daily with a cyclo mower
experiments in late summer started on 27 July in A92
starting at 09.00h, analyzed for DM content by a
and on 2 August in A93 and lasted for eight weeks.
rapid method described by Meijs (1981) and For all experiments an adaptation period of two
weighed in 13 / 14 portions of 1.4 kg DM grass for weeks is included.
each cow. After milking in the afternoon about eight grass portions were offered during the time between 2.2. Meteorological and agronomy aspects
16.00h and 21.00h. The remainder portions were stored at 38C and offered after the morning milking Rainfall was measured daily using a Lambrecht
between 07.00h and 16.00h. After the adaptation rain gauge. Temperature was measured every 10 min
period, intake was measured individually on four with thermometers consisting of platinum electrodes.
consecutive days in each week by weighing grass Grass was grown on clay soils and contained 70%
refusals once daily directly before milking in the
Lolium perenne, 20% Poa trivialis and 5% Poa
afternoon. On these days, grass samples were taken
annua. About 30 ha was divided into 26, 22 and 20
which were oven dried at 708C and analyzed for
numbered plots (300 m312 m per plot) each
DM, ash, Kjeldahl N, crude fibre, sugar and neutral receiving an annual application of 150, 300 and 450
detergent fibre (NDF) according to methods de-kg N / ha, respectively. In early spring these plots
scribed by Van Vuuren et al. (1993). In-vitro organic received respectively 20, 50 and 65 kg N / ha prior to
matter digestibility (in-vitro d ) was estimated
the first cut. Each day from mid-April onwards, three OM
according the method of Tilley and Terry as modi-grass plots (starting with plot number 1 of each N
fied by Van der Meer (1986). Samples of grass treatment) were mown and directly harvested after
refusals were collected daily per N treatment, which which each plot received an application of 30, 60
were analyzed for DM and ash content. At the start, and 90 kg / ha for the second cut. Plots were mown at
middle and end of the experiments, samples of the target yields between 1500 and 2000 kg DM / ha. The
compound feeds were taken and analyzed for the spring experiments started when the first plot of the
same components as grass. In addition, crude fat and 150N regime (second cut) had reached that target
starch were analyzed in the compound feeds accord-DM yield. Fertilization and mowing activities were
ing the methods described in Van Vuuren et al. recorded on a grassland calendar. Third and fourth
(1993). Samples of the Cr compound were taken cuts received the same amount of N as the second
every week and analyzed for DM, ash and Cr (see cut. The remaining harvest received 20, 40 and 60 kg
determination method by Van Vuuren et al. 1993). N / ha for the three N treatments, respectively. Grass
The energy value of the feed stuffs was calculated as growth was based on weekly grass DM yields
net energy for lactation and expressed in VEM units obtained from nine plots (3 per N level) using an
according to Van Es (1978). Protein value was Agria motor scythe (Meijs, 1981). Due to the
calculated as true protein digested in the small difference in cutting height between the Agria motor
intestine (DVE) and the degraded protein balance in scythe and the cyclo mower (3 versus 6 cm cutting
the rumen as OEB (Tamminga et al., 1994) based on height), the nine plots were also cut with the Agria
CP content and day of harvesting. just before and after the harvest of the whole plot by
To estimate total apparent digestibility, faecal the cyclo mower. Data of grass growth were used to
samples were taken individually from nine cows per perform the strategy of harvesting the swards at DM
N treatment during six weeks in the spring / early yields between 1500 and 2000 kg / ha.
summer and five weeks in the late summer
experi-During a drought in 1992 (A ), all plots were92
30 H. Valk et al. / Livestock Production Science 63 (2000) 27 –38
dung patch excreted between 06.30h to 15.00h was above. Statistical analysis was carried out using
sampled and pooled to one sample per cow per Genstat (Genstat 5 Committee, 1993). Treatment
week. Samples were dried at 708C and analyzed for means were compared by Student’s t-test. In
experi-DM, ash, NDF and Cr content and Kjeldahl N was ment A93 one cow was infected by a severe form of
analyzed in a fresh subsample. The fixed amount of mastitis and was assigned as a missing value in the
Cr ingested each day and the Cr content in the faeces statistical analysis of the data. The effect of N
assuming a Cr recovery of 94%, were used to fertilizer on chemical composition and nutritive
estimate daily faecal output per cow per week (faecal value of grass was tested for significance using a
output5ingested Cr / faecal Cr content). linear regression model with N treatment as the only
Cows were milked twice daily with milk yields variable.
being recorded at each milking. Milk samples were taken during six consecutive milkings per week for
fat and protein analyses, which were determined by 3. Results
infrared analysis (Melkcontrolestation
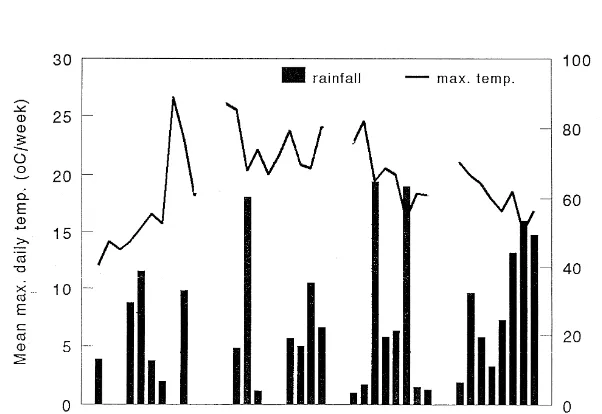
Noord-Neder-land, Leeuwarden). 3.1. Weather conditions during the experiments
2.4. Statistical analyses For the spring experiments, in 1991 (S ) weather91
was relatively cold and wet, whereas in 1992 (S )92
Intake, digestibility of nutrients and milk per- temperature was high and the experimental period
formance data were analyzed in a completely ran- was characterised by drought with occasional rain
domised block design and were subjected to analysis showers (Fig. 1). Also the late summer experiment
of variance, using per experiment the model: Yij5 of 1992 (A ) was carried out in hot weather92
m 1 a 1 b 1 ei j ij, where m 5mean, a 5i effect of conditions with drought, whereas in 1993 (A ),93
block i, b 5j effect of treatment j, ande 5ij variation weather was cold with high amounts of rainfall
within a block. Data from the experiments carried especially at the end of the experiment.
out in the same season were pooled and analyzed by Due to the drought in 1992, crown rust was
including the effect of year in the model described observed, notably at the 150N plots. During
H. Valk et al. / Livestock Production Science 63 (2000) 27 –38 31
ing, the infected plots were avoided as much as N150 versus 77.7% and 76.3% for N450 and N300
possible. grass, respectively).
3.2. Grass growth
3.4. Feed intake and digestibility of nutrients
The mean age of grass in S91 was five days lower Both compound feeds were consumed according
than in S92 (Table 2), which reflected the better the amounts offered daily (1.8 and 2.7 kg DM / cow
growing conditions in spring of 1991 as compared
in spring and late summer, respectively). When year
with 1992. Grass growth in A93 was not limited by effect is accounted for, no distinct effect of N
drought which resulted in a higher growth rate in
fertilizer on VI was observed in spring whereas in
contrast to A92 especially at the highest level of N late summer, but VI was reduced significantly on
fertilizer. However, except for N150 in A , days of92 N compared with the other treatments (15.3
150
regrowth differed not markedly between the late
versus 16.2 kg DM). When compared within each
summer experiments which means that in A92 DM experiment, a systematic reduction in VI with
de-yield of grass was lower than in A .93 creasing N fertilization was only obvious in A
93
Within the spring experiments, the reduction of N
(Table 3). If grass intake was expressed per kg
fertilizer resulted in a systematic increase of up to 0.75
metabolic weight (W ), treatment effects were
2.5 growing days to achieve 1500–2000 kg DM / ha.
significant only in S92 and A . In A , the extra N93 92
In the late summer experiments, grass was harvested
on the 150N plots resulted in an increase in VI at similar days after regrowth for the three
treat-during the last two weeks of this experiment.
Fur-ments, except for N150in A92which was retarded by ther, VI of cows fed 450N grass in A was
unexpec-92
seven days.
tedly low in two of the six weeks thereby reducing
the mean VI. Nevertheless, grass VI of cows fed N450
3.3. Chemical composition and nutritive value
was markedly higher than of cows fed 150N grass
during A .92
Chemical composition and nutritive value of grass
Differences in NDF intake reflected the differ-samples are shown in Table 2. Because of dry
ences in DM intake. Differences in kVEM, DVE and
weather conditions, DM content of grass cut in S92 OEB intakes were a result of differences in VEM,
was higher than in the other experiments (194 versus
DVE and OEB contents and differences in DM
145 g DM content). In A92sugar content and in-vitro intake. In general, the intake of VEM, DVE and
dOM of grass were relatively low as compared to the OEB decreased with a reduction in N fertilizer
other experiments.
especially from 300 to 150 kg N / ha per year. In all
Grass DM, sugar and crude fibre (except in S )91 experiments the apparent in-vivo digestibility of OM
content increased significantly (P,0.05) with
de-(dOM), N (d ) and NDF (dN NDF) was significantly
creasing N application. Ash content was not affected
(P,0.05) lower on diet N150 compared with diet
by fertilizer N. The CP content decreased
signifi-N450. For these response variables, the results of
cantly (P,0.05) with about 80 to 90 g / kg DM in
N300 varied between the other two treatments and
spring and 60 to 70 g / kg DM in late summer when
differed more significantly from N150 than from
N application decreased from 450 to 150 kg / ha per
N450. The in-vitro dOM calculated for the total ration
year. The content of NDF was not affected by N
was not different between N treatments following the
fertilizer except in A92 where NDF increased sig- in-vitro d differences of grass shown in Table 2.
OM
nificantly (P,0.05) with decreasing N application.
In all experiments VEM, DVE and especially OEB
declined significantly (P,0.05) by using lower 3.5. Yield, composition of milk and liveweight
amounts of N fertilizer with no seasonal effect.
Except in S , in-vitro d91 OM of 150N grass was From the overall analysis with allowance for year
significantly lower than of 450N and 300N grass effect, daily milk yield per cow did not differ
32
Mean days after regrowth and mean content of dry matter (DM), crude protein (CP), neutral detergent fibre (NDF), sugar, DVE , OEB , VEM and in-vitro digestibility (in-vitro
dOM) of grass, fertilized with different amounts of N (450, 300 and 150 kg / ha / year), and offered to dairy cows in four zero-grazing experiments (S , S , A91 92 92 and A )93
Experiment
Crude fibre 214 222 219 2.5 216 222 228 4.0 225 237 244 2.2 203 213 210 2.2
a b c
a, b, c: Means in the same row and experiment with different superscripts differ significantly (P,0.05).
1
DVE5True protein digested in small intestine (Tamminga et al., 1994).
2
OEB5Degraded protein balance in the rumen (Tamminga et al., 1994).
3
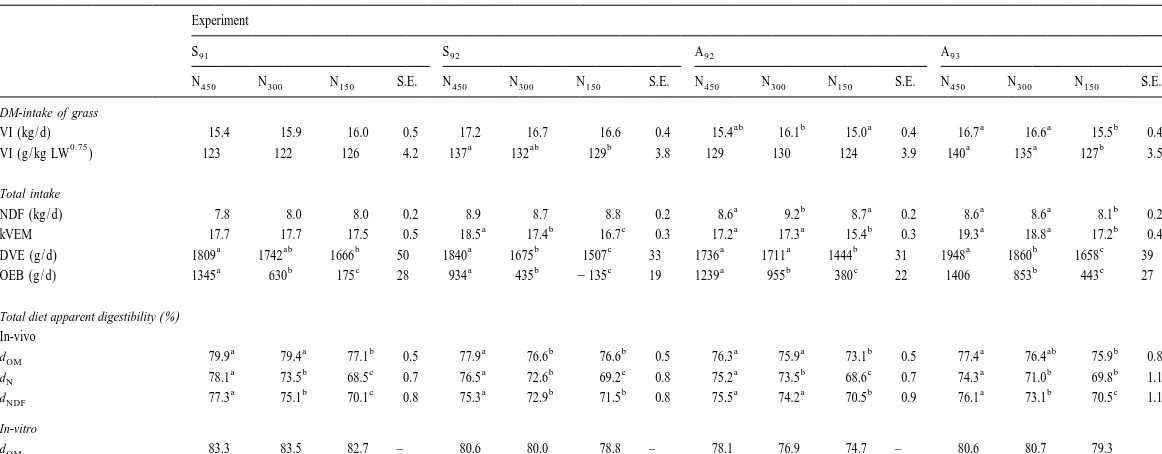
H
The effect of lowering N fertilizer on voluntary grass intake (VI in kg DM / d and g DM / kg LW ) and total intake (grass1compound) of NDF, net-energy (VEM) and protein (DVE) and on the apparent digestibilities of OM, N and NDF
Experiment
DVE (g / d) 1809 1742 1666 50 1840 1675 1507 33 1736 1711 1444 31 1948 1860 1658 39
a b c a b c a b c b c
34
H
.
V
alk
et
al
.
/
Livestock
Production
Science
63
(2000
)
27
–
38
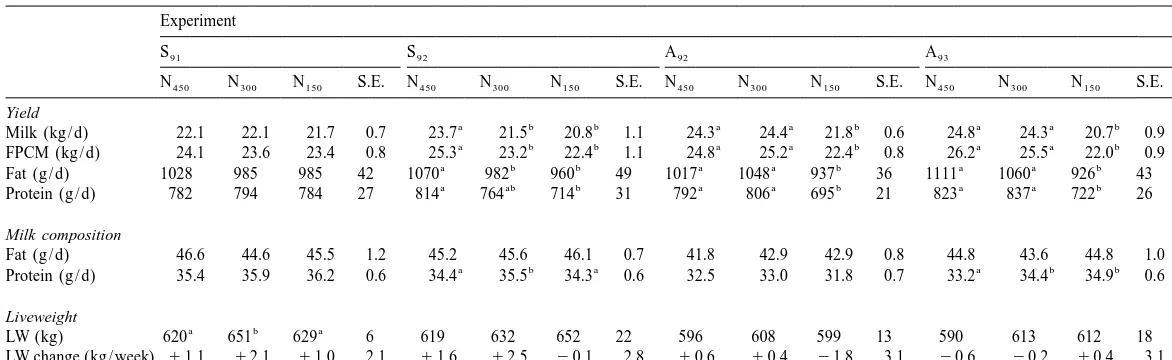
Table 4
Mean milk yield and composition, liveweight (LW) and liveweight change during the experiments of cows offered different rations (N450, N300and N150) in four experiments (S , S , A91 92 92 and A )93
Experiment
S91 S92 A92 A93
N450 N300 N150 S.E. N450 N300 N150 S.E. N450 N300 N150 S.E. N450 N300 N150 S.E.
Yield
a b b a a b a a b
Milk (kg / d) 22.1 22.1 21.7 0.7 23.7 21.5 20.8 1.1 24.3 24.4 21.8 0.6 24.8 24.3 20.7 0.9
a b b a a b a a b
FPCM (kg / d) 24.1 23.6 23.4 0.8 25.3 23.2 22.4 1.1 24.8 25.2 22.4 0.8 26.2 25.5 22.0 0.9
a b b a a b a a b
Fat (g / d) 1028 985 985 42 1070 982 960 49 1017 1048 937 36 1111 1060 926 43
a ab b a a b a a b
Protein (g / d) 782 794 784 27 814 764 714 31 792 806 695 21 823 837 722 26
Milk composition
Fat (g / d) 46.6 44.6 45.5 1.2 45.2 45.6 46.1 0.7 41.8 42.9 42.9 0.8 44.8 43.6 44.8 1.0
a b a a b b
Protein (g / d) 35.4 35.9 36.2 0.6 34.4 35.5 34.3 0.6 32.5 33.0 31.8 0.7 33.2 34.4 34.9 0.6
Liveweight
a b a
LW (kg) 620 651 629 6 619 632 652 22 596 608 599 13 590 613 612 18
H. Valk et al. / Livestock Production Science 63 (2000) 27 –38 35
late summer cows on N150 produced significantly were smaller. One of the factors that influence the
less milk than the cows in the other treatments (21.2 magnitude of the effects is stage of maturity. This is
on N150 versus 24.6 and 24.4 kg milk on N450 and emphasised in A92 where the differences in chemical
N300, respectively). When compared within each composition and nutritive value were much larger
experiment, milk yield on treatment N150 was sig- caused by a substantial difference in growing days
nificantly (P,0.05) lower than on N450 (Table 4), for 150N grass (Table 2). Also Salette (1982) and
except in S . In S91 92 cows on N300 produced Peyraud and Astigarraga (1998) stated that NDF
significantly less milk than cows on N450 (21.5 content and dOM value of grass are more influenced
versus 23.7 kg milk). In late summer, cows on N300 by stage of maturity than by N fertilization.
produced significantly more milk than cows on N150, Nutritive value decreased with decreasing levels of
but no difference between N300 and N450 was N application. The reduction of DVE and OEB with
observed. Yields of FPCM, fat and protein followed decreasing N fertilizer reflected the decrease in CP
the differences in milk yield. Except in S92 and A93 content. The reduction in DVE ranged between 11
where milk protein content between treatments was and 18 g / kg DM and was much smaller than the
significantly affected in a non-consistent way, no reduction in OEB, which decreased between 54
differences in milk constituents between treatments (A ) and 75 (S ) g / kg DM. This agrees with93 91
were observed. Mean liveweight (LW) of cows in estimates based on nylon bag studies (Valk et al.,
S91 fed N300was significantly higher than of those in 1996; Van Vuuren et al. 1991). The reduction in VEM
the other groups. In spring, live weight changes were content with decreasing N fertilizer was mainly
positive in contrast to experiment A93 where live caused by the reduction in digestible CP which is an
weight changes were tended to be negative. arithmetical component in the VEM equation (Van
Es, 1978). In A , also the reduction in OM di-92
gestibility attributed to the decrease in calculated
4. Discussion VEM content.
4.1. Effect of N fertilizer on chemical composition 4.2. Effect of N fertilizer on grass intake and
and nutritive value of grass digestibility
The consequences of the use of older grass in S92 Voluntary intake is a result of many interactions
compared with S91 was that contents of grass CP, between the feed, the animal and its environment
DVE, OEB, VEM and dOM were lower and contents (e.g., Minson, 1990; Ketelaars and Tolkamp, 1992).
of grass NDF and sugar were higher in S . The92 In our experiments, VI of cows fed grass fertilized
differences in chemical composition and nutritive with different N levels was compared at the same
value between A92 and A93 were more related to time and place. So, within each experiment, VI was
differences in growing conditions due to drought, in influenced by differences in the chemical and
nutri-agreement with the research of Deinum (1966). tive value of grass due to differences in level of N
Differences in chemical composition and nutritive fertilizer. Between experiments, VI could also be
value between grass harvested in spring and late affected by animal, climatic or seasonal factors.
summer are usually caused by blooming of grass in In spring, level of N fertilizer had no marked
spring / early summer, which does not occur in late effect on VI of cows fed grass, harvested at nearly
summer in temperate regions (Minson, 1990). In our similar stages of maturity. This is in agreement with
experiments, no large differences between spring and the literature reviewed by Minson (1990) and
late summer grass were observed probably caused by Peyraud and Astigarraga (1998). Although, dOM
our strategy of grassland management with a high differed significantly between treatments in a range
frequency of defoliation at a relatively young stage. between 76.6% to 79.9% (Table 3), VI was not
The observed effects of a reduction in N fertilizer affected. This agrees with Conrad et al. (1964) who
on chemical composition and dOMwere in agreement found no relationship between dOM and VI at dOM
with the results of Deinum (1966) and Wilman and levels higher than 70%.
36 H. Valk et al. / Livestock Production Science 63 (2000) 27 –38
450 and 300 to 150 kg N / ha per year decreased VI. sufficient, even though the OEB intake was negative.
This was observed both when grass was harvested at A negative OEB suggest a deficiency of
undegrad-different stage of maturity (A ) and when grass was92 able protein in the rumen for optimum microbial
harvested at more or less similar stage of maturity synthesis which could reduce rate of OM degradation
(A ). Similarly to the spring experiments, these93 and consequently VI (Forbes, 1995). However, this
differences in VI could not be explained by the negative OEB intake had no effect on VI probably
observed differences in dOMand dNDF. Forbes (1995) because DVE intake exceeded the requirement by
states that the rate of degradation of NDF is a better 20% resulting in high N recycling from the blood
predictor for intake than digestibility. During our urea pool to the NH -N pool in the rumen (Tamm-3
experiments subsamples of grass were incubated in- inga et al., 1994).
situ (Valk et al., 1996). From these results it is
concluded that a reduction in N fertilizer decreased 4.3. Effect of N fertilizer on milk production
the rate of NDF degradation in both spring and late
summer. We can not explain why the positive Most of the variation in FPCM between treatments
relationship between VI and rate of NDF degradation within each experiment could be related to variation
observed in late summer was not observed in the in grass kVEM intake which was calculated by
spring experiments. It can only be speculated if in multiplying grass DM intake with VEM content of
spring a possible negative influence on VI attributed grass. Due to the large number of experiments and
to the decrease in the rate of degradation, was the variation within each experiment, it can be
compensated by the markedly increase in sugar demonstrated how FPCM reacts on differences in
content of 150N improving palatability (Peyraud and kVEM intake caused by differences in DM intake
Astigarraga, 1998). This phenomenon was probably and / or VEM content of grass. Therefore, the relative
not observed in late summer due to the fact that contribution of DM intake (intake effect) and grass
sugar content was only slightly increased compared VEM content (quality effect) to the difference in
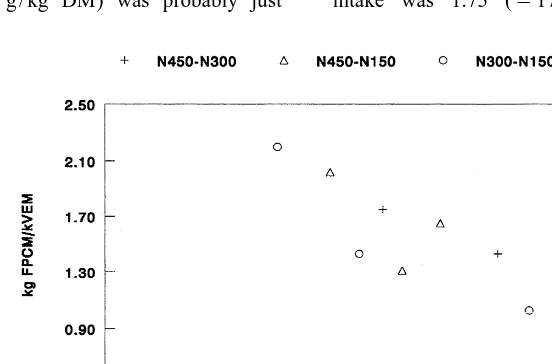
to the increase in spring. kVEM intake from high to low N treatment was
Based on the critical level of 140 g CP/ kg DM in calculated. For example, if DM intake decreased
grass for dairy cows to maintain VI (Peyraud and from 17 to 16 kg / d and grass VEM content
de-Astigarraga, 1998), the low CP content of 150N creased from 950 to 900, the difference in kVEM
grass in S92 (131 g / kg DM) was probably just intake was 1.75 (51730.9521630.90). The
H. Valk et al. / Livestock Production Science 63 (2000) 27 –38 37
relative contribution of DM intake was 51% Acknowledgements
[5(17216)30.900 / 1.753100] and the
contribu-tion of VEM content was 49% (5100251). The authors acknowledge the assistance of a large
In spring, the reductions in kVEM intake from number of students who participated in the
experi-high to low N treatment were mainly due to a ments, the farm staff for taking care of the animals,
reduction in VEM content (Table 2), whereas in late and the laboratory staff who performed a large
summer these differences were mainly caused by a numbers of chemical analyses. The experiments were
reduction in DM intake (Table 3). The relative financed by the Ministry of Agricultural, Nature
contributions of VEM content to the reductions in Management and Fisheries and by Dutch Fund for
kVEM intake between treatments were related to the Manure and Ammonia Research (FOMA).
observed difference in FPCM production expressed as kg FPCM per kVEM difference (Fig. 2). This figure clearly demonstrates a decrease in the
re-References
sponse on FPCM when the relative contribution of VEM content to the difference in kVEM intake
Conrad, H.R., Pratt, A.D., Hibbs, J.W., 1964. Regulation of feed
increases. So, the calculated difference in VEM intake in dairy cows. 1. Change in importance of physical and
content of high and low fertilized grass must be physiological factors with increasing digestibility. J. Dairy Sci.
smaller based on the observed response in FPCM 47, 54–62.
Deinum, B., 1966. Climate, nitrogen and grass. I. Research into
production.
the influence of light intensity, temperature, water supply and
Within each experiment DVE intake increased at
nitrogen on the production and chemical composition of grass.
higher levels of N fertilizer. However, for all treat- Meded, L.H. (Ed.), Wageningen, pp. 1–91, 66–11.
ments in all experiments, DVE intake was always Forbes, J.W., 1995. Voluntary Food Intake and Diet Selection in
more than 20% above DVE requirement (Tamminga Farm Animals, CAB International, Wallingford.
Genstat 5 Committee, 1993. Genstat 5 Release 3 Reference
et al., 1994). So, it cannot be expected that
differ-Manual, Oxford University Press, Oxford.
ences in DVE intake influenced milk yield or milk
Ketelaars, J.J.M.H., Tolkamp, B.J., 1992. Toward a new theory of
composition. It seems also unlikely that the negative feed intake regulation in ruminants. 1. Causes of differences in
OEB of 150N grass in S92 influenced milk per- voluntary feed intake – critique of current views. Livestock
formance because also for this treatment DVE was Prod. Sci. 30, 269–296.
Meijs, J.A.C., 1981. Herbage intake by grazing dairy cows. In:
fed above requirement and DM intake was
main-Agric. Res. Rep. (Vers. Landbouwk. Onderz), Pudoc,
Wagen-tained.
ingen, p. 909.
Minson, D.J., 1990. Forage in ruminant nutrition. Academic Press, San Diego, CA, 483 pp.
5. Conclusions Peyraud, J.L., Astigarraga, L., 1998. Review of the effect of nitrogen fertilization on the chemical composition, intake, digestion and nutritive value of fresh herbage: consequences on
In late summer, reducing the amount of N
fertil-animal nutrition and N balance. Anim. Feed Sci. Technol. 72,
izer on grassland from 450 to 150 kg / ha per year 235–259.
decreased grass intake and milk yield of dairy cows, Salette, J., 1982. The role of fertilizers in improving herbage
even when grass was harvested in an early stage of quality and optimization of its utilization. In: Proceedings of
the 12th IPI Congress, Optimizing Yields – The Role of
maturity at DM yields between 1500 and 2000 kg /
Fertilizers, Worblaufen Int. Potash Institute, pp. 117–144.
ha. In spring, no effect of N fertilizer on grass intake
Tamminga, S., 1992. Nutrition management of dairy cows as a
was observed. Despite this, in one experiment kVEM contribution to pollution control. J. Dairy Sci. 75, 345–357.
intake of cows fed 150N grass was reduced sig- Tamminga, S., Van Straalen, W.M., Subnel, A.P.J., Meijer, R.G.M.,
nificantly, resulting in lower milk yields. Except in Steg, A., Wever, C.J.G., Blok, M.C., 1994. The Dutch protein
evaluation system: the DVE / OEB-system. Livestock Prod. Sci.
one experiment, the reduction in N fertilizer from
40, 139–155.
450 to 300 kg / ha per year did not affect intake and
Valk, H., Kappers, I.E., Tamminga, S., 1996. In sacco degradation
animal performance. The lowest digestibilities and characteristics of organic matter, neutral detergent fibre and
DM intakes were obtained when a reduction in N crude protein of fresh grass fertilized with different amounts of
38 H. Valk et al. / Livestock Production Science 63 (2000) 27 –38
Van der Meer, J.M., 1986. In: Optimal Prediction of In Vivo (Lolium perenne) in the rumen of grazing dairy cows. J. Agric. Organic Matter Digestibility For Ruminants By In Vitro Sci. Cambridge 116, 429–436.
Methods, Report No. 177, Research Institute of Livestock Van Vuuren, A.M., Van Der Koelen, C.J., Valk, H., De Visser, H., Feeding and Nutrition, Lelystad. 1993. Effects of partial replacement of ryegrass by low protein Van Es, A.J.H., 1978. Feed evaluation for ruminants. 1. The feeds on rumen fermentation and nitrogen loss by dairy cows.
system in use from 1977 onwards in the Netherlands. Livestock J. Dairy Sci. 76, 2982–2993.
Prod. Sci. 5, 331–345. Wilman, D., Wright, P.T., 1983. Some aspects of applied nitrogen Van Vuuren, A.M., Tamminga, S., Ketelaar, R.S., 1991. In-sacco on the growth and chemical composition of temperate grasses.