THIS REPORT CONTAINS ASSESSMENTS OF COMMODITY AND TRADE ISSUES MADE BY USDA STAFF AND NOT NECESSARILY STATEMENTS OF OFFICIAL U.S. GOVERNMENT POLICY
-
Date: GAIN Report Number:
Post:
Report Categories:
Approved By:
Prepared By:
Report Highlights:
Post estimates that South African pork imports will increase marginally by about 2.5 percent annually, reaching about 32,000 tons cwe in 2017 and 33,000 tons cwe in 2018. The recovery of the local pork production from drought is expected to increase local pork production hence suppressing the growth of imports. Post estimates that South African pork exports will stay constant at about 14,000 tons cwe in 2017 and 2018 as local pork demand is expected to grow due to an increase in the prices of beef and lamb.
Worship Mugido Kyle Bonsu
Livestock and Products
The South African pork market
Pretoria
South Africa - Republic of
9/5/2017 Public
Executive Summary:
South African pork production increased at an average growth rate of about 3.5 percent per annum for the past 10 years driven mainly by increased consumer demand. However, the number of pigs
slaughtered increased by an annual average rate of only 2.2 percent for the past 10 years, implying that South Africa is slaughtering heavier pigs. Post estimates that pork production in South Africa will follow the trend line in 2017 and 2018, and increase by about three percent per year, reaching about 250,000 tons in 2017 and about 258,000 tons in 2018 (Table 1). This growth in production will be driven by the local bumper corn harvest obtained this season (about 16 million tons), which will lead to a decrease in the price of feed hence improvement in the profitability of pork production. The local demand for pork is also expected to grow due to an increase in the prices of beef and lamb.
Post estimates that South African pork imports will increase marginally by about 2.5 percent annually, reaching about 32,000 tons cwe in 2017 and 33,000 tons cwe in 2018. Post estimates that South African pork exports will stay constant at about 14,000 tons cwe in 2017 and 2018. South African pork exports represent about six percent of the local pork production.
Production
According to the South African Department of Agriculture, Forestry and Fisheries (DAFF) there are about 400 commercial pig farmers and 19 stud breeders in South Africa. With slaughterings of less than three million pigs per year, South Africa accounts for about 0.2 percent of total world pork production and is regarded as a small pork producer in global terms.
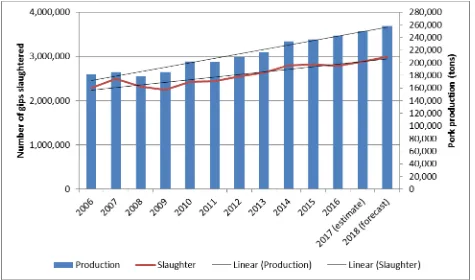
South African pork production increased at an average growth rate of about 3.5 percent per annum for the past 10 years driven mainly by increased consumer demand. However, the number of pigs
slaughtered increased by an annual average rate of only 2.2 percent for the past 10 years, implying that South Africa is slaughtering heavier pigs (see Figure 1).
Figure 1: South African pig production
Source: South African Pork Producers’ Organisation (SAPPO); DAFF
In South Africa, small and lean porkers are normally sold in the fresh meat market. The porkers normally weigh up to 70 kg (55 kg carcass weight). On the other hand, heavy pigs are supplied to the processing market, where they are used in the production of products such as bacon, sausages and ham. The baconers weigh between 75kg and 95 kg live mass or 56kg to 72kg carcass weight.
production, despite the drought, could be attributed to improved production practices and accessibility of top genetic material.
Table 1: South African pork production
2014 2015 2016 2017* 2018*
Number of slaughters
1 000’
2,795 2,814 2,788 2,890 2,990 Production (tons cwe) 234 237 243 250 258 Sources: DAFF, SAPPO
*Estimates
Feed cost
The cost of feed contributes significantly to the total cost of pig production and can account for as much as 70 percent of the total cost of pig production. Corn is a major component of the feed for the pigs, hence any change in the price of corn will have an impact on the profitability of pig production. In fact, on average the pig feed rations consist of about 50 to 70 percent corn, 20 percent soybean and the remaining balance consists of additional supplements. South Africa experienced severe droughts for the past two seasons and the pig industry was under financial pressure due to the increase in the prices of corn and soybean. In mid-January 2016, the prices of yellow and white corn reached historical levels of R5,280/ton (US$391) and R4,130/ton (US$306), respectively, leading to significant increases in the price of feed. However, many parts of South Africa have since received good rains and a record corn harvest of about 16 million tons is expected for the 2016/2017 season, which is more than 105 percent higher than last season’s harvest (see The supply and demand for corn in South Africa).
Consumption
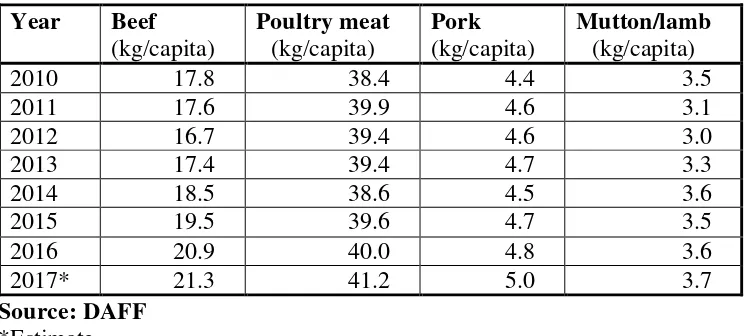
In global terms, pork is the most consumed meat, accounting for about 40 percent of the total global meat consumption. Comparatively, poultry and beef are the most consumed meats in South Africa, with pork accounting for about seven percent of the total South African meat consumption in 2016 (Table 2). This is not surprising given that cultural and religious beliefs influence pork consumption in South Africa. Nonetheless, pork consumption in South Africa increased steadily over the past six years, growing faster than mutton/lamb consumption. In the marketplace, approximately 45 percent of pork meat is sold fresh, while 55 percent of the meat is processed.
In South Africa, per capita income, population, dietary diversity and urbanization are some of the predominant factors affecting pork consumption per capita. Demand and consumption of pork is also affected by the prices of alternative protein such as chicken and beef. Chicken is the biggest competitor to pork consumption since chicken has been the most affordable meat in South Africa for the past decade. Pork, however, provides an alternative to beef and lamb. The current relatively high lamb and beef prices in South Africa are due to the herd rebuilding phase after the drought. These prices are supporting the consumption of more affordable meat like pork. Even though the consumers are under pressure due to a sluggish South African economy, Post estimates the consumption of pork to increase by almost three percent annually, reaching about 268,000 tons in 2017 and 277,000 in 2018. The increase in pork consumption will be mainly driven by relatively high beef and lamb prices.
Year Beef
Post estimates that South African pork imports will increase marginally by about 2.5 percent annually, reaching about 32,000 tons cwe in 2017 and 33,000 tons cwe in 2018. Local pork production is expected to recover and suppress the growth of imports; therefore, the share of imports in domestic consumption is expected to stay relatively flat. In 2016, South Africa imported 31,226 tons cwe,
accounting for about 0.4 percent of the total world imports. Although South Africa has already imported almost 20,000 tons cwe of pork in the first six months of 2017, the rate of imports is expected to
decrease in the second half of 2017 due to the improvement in local pork production.
Table 3: South African pork imports Trading partner 2014
tons cwe
January 2017 to June 2017
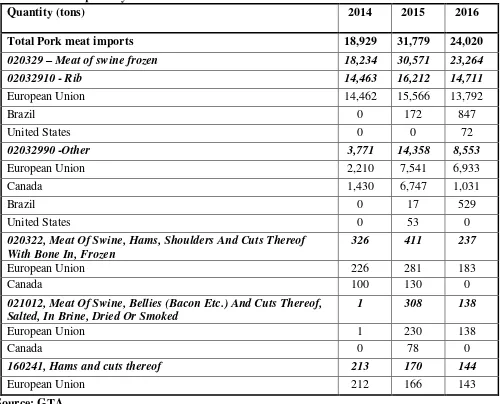
South Africa’s pork meat imports are primarily rib cuts (about 50 to 60 percent of pork imports) from Europe, mainly from Germany (Table 4). Interestingly, the quantity of rib imports into South Africa has remained fairly consistent since 2014. On the other hand, the imports of other pork cuts (HS code: 02032990) increased substantially from 3,771 tons in 2014 to 8,553 tons in 2016. Therefore, the increase in the quantity of the imports of other pork cuts (HS code: 02032990) resulted in the declining of rib imports as a percentage of total South African pork imports from 76 percent in 2014 to 61 percent in 2016. South African pork producers do not produce enough pork ribs to meet the local demand hence the shortfall is filled by imports.
US$214,013, to South Africa in 2016. This represents only 0.3 percent of total pork meat imports by South Africa in 2016.
Table 4: Pork imports by South Africa
Quantity (tons) 2014 2015 2016
Total Pork meat imports 18,929 31,779 24,020
020329 – Meat of swine frozen 18,234 30,571 23,264
02032910 - Rib 14,463 16,212 14,711
European Union 14,462 15,566 13,792
Brazil 0 172 847
United States 0 0 72
02032990 -Other 3,771 14,358 8,553
European Union 2,210 7,541 6,933
Canada 1,430 6,747 1,031
Brazil 0 17 529
United States 0 53 0
020322, Meat Of Swine, Hams, Shoulders And Cuts Thereof With Bone In, Frozen
326 411 237
European Union 226 281 183
Canada 100 130 0
021012, Meat Of Swine, Bellies (Bacon Etc.) And Cuts Thereof, Salted, In Brine, Dried Or Smoked
1 308 138
European Union 1 230 138
Canada 0 78 0
160241, Hams and cuts thereof 213 170 144
European Union 212 166 143
Source: GTA
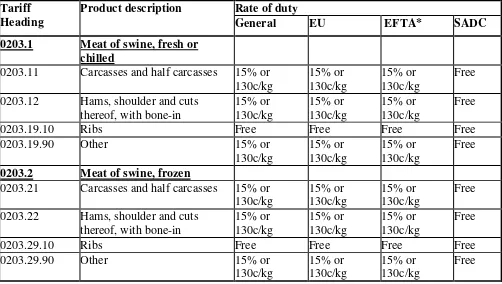
Table 5 presents South Africa’s import tariffs for pork meat. Pork ribs enter South Africa tariff free; an import duty of 15 percent or 130c/kg is imposed on all other cuts. However, all pork products from the Southern African Development Community (SADC) countries enter South Africa tariff free.
Tariff Heading
Product description Rate of duty
General EU EFTA* SADC
0203.1 Meat of swine, fresh or chilled
0203.11 Carcasses and half carcasses 15% or 130c/kg
0203.12 Hams, shoulder and cuts thereof, with bone-in
0203.21 Carcasses and half carcasses 15% or 130c/kg
0203.22 Hams, shoulder and cuts thereof, with bone-in
Source: South African Revenue Service *European Free Trade Association
Exports
Post estimates that South African pork exports will stay constant at about 14,000 tons cwe in 2017 and 2018 as local pork demand is expected to grow due to an increase in the prices of beef and lamb. South African pork exports increased marginally from 13,179 tons cwe in 2014 to 14,343 tons cwe in 2016, with South Africa’s neighboring countries being the main markets of pork products from South Africa (Table 6). Namibia, Mozambique, Lesotho, Swaziland and Botswana had a combined share of more than 80 percent of the total South African pork exports since 2014. South African pork exports represent about six percent of the local pork production.
Table 6: South African pork exports Partner country 2014
Other countries 840 619 502 193
Total 13,179 16,988 14,343 7,199
Source: GTA *
January 2017 to June 2017
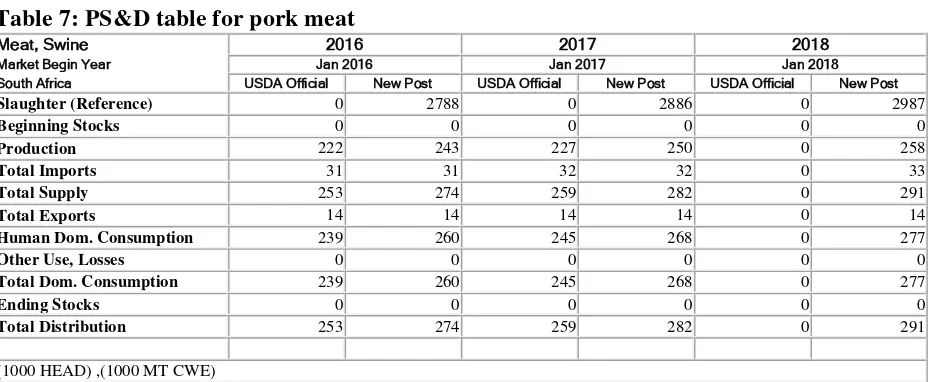
Table 7: PS&D table for pork meat
Meat, Swine 2016 2017 2018
Market Begin Year Jan 2016 Jan 2017 Jan 2018
South Africa USDA Official New Post USDA Official New Post USDA Official New Post
Slaughter (Reference) 0 2788 0 2886 0 2987
Beginning Stocks 0 0 0 0 0 0
Production 222 243 227 250 0 258
Total Imports 31 31 32 32 0 33
Total Supply 253 274 259 282 0 291
Total Exports 14 14 14 14 0 14
Human Dom. Consumption 239 260 245 268 0 277
Other Use, Losses 0 0 0 0 0 0
Total Dom. Consumption 239 260 245 268 0 277
Ending Stocks 0 0 0 0 0 0
Total Distribution 253 274 259 282 0 291
(1000 HEAD) ,(1000 MT CWE)
Note: Not official USDA data