PROBABILISTIC FEATURE MATCHING APPLIED TO PRIMITIVE BASED
REGISTRATION OF TLS DATA
Jean-Franc¸ois Hulloa b∗
, Guillaume Thibaulta c, Pierre Grussenmeyerb, Tania Landesband Daniel Bennequind a
SINETICSI2C, EDF R&D, 92140 Clamart, France
bThe Image Sciences, Computer Sciences and Remote Sensing Laboratory, LSIIT-TRIO UMR 7005, INSA Strasbourg, France c
Laboratoire de Physiologie de la Perception et de l’Action, Coll`ege de France, UMR 7152, CNRS, Paris, France d ´
Equipe G´eom´etrie et Dynamique, Institut de Math´ematiques de Jussieu, UMR 7586, Paris, France [email protected]
Commission III/4
KEY WORDS:TLS, 3D lines, matching, transformation, probability, industrial installations, indoor geolocation
ABSTRACT:
Many industrial applications require dense point clouds of the installations. Acquisition of the rooms, filled with many objects, of an industrial scene leads to many Terrestrial Laser Scanner (TLS) stations. A precise registration of all the per-station point clouds is crucial for the required accuracy of 1-2 cm of final data. Targets and tachometry, current best practice for registration, slows down the survey and limits the number of campaigns. Indoor geolocation system are faster but do not reach the final required accuracy. Otherwise, 3D primitives can be automatically extracted from the dense point clouds and possibly used for registration. In a four step primitive-based registration, Acquisition - Reconstruction - Matching - Solving, the matching is crucial. This article presents a probabilistic test for 3D lines matching usinga prioridistributions of approximated transformations. The stochastic model of approximated transformations and resulting uncertain lines is introduced. A test is performed on a real dataset of an industrial scene and the results are analysed. Improvements of the presented test and matching framework are also discussed.
1 INTRODUCTION
Maintenance and revamping of large industrial installations com-monly require 3D As-Built models of their geometries. The 3D reconstruction of these complex scenes can be achieved from an accurate and dense point cloud. Current laser scanners can de-liver a high quality point cloud for each station. The correct reg-istration of this Terrestrial Laser Scanning (TLS) data is crucial for the accuracy of the global point cloud. Accurate tachometric measurements based on widely distributed targets can provide the required accuracy of 1-2 cm. This protocol is now the bottleneck of wide survey campaign (over 1000 stations).
An alternative approach exploits geometric primitives as “natural targets”, which are already present in the scene (points, lines and planes respectively stemmed from spheres, cylinders and walls). These primitives are automatically, or semi-automatically, recon-structed from per-station point clouds. The framework presented in (Hullo et al., 2011) is divided in 4 steps: Acquisition - Recon-struction - Matching - Solving. It shows a complete process of registration with the use of these primitives to reach the required accuracy under specific conditions. One of these conditions con-cerns the exactness of primitives matching, directly related to the constraints used to solve the registration problem.
In (Rabbani et al., 2007), the search for corresponding objects is done by filtering the possible correspondences using constraints and thresholds. In such an approach, taking the uncertainties of initial approximate transformations into account is not straight-forward. Moreover, no information on the probability of a false positive in the established correspondences is delivered; this is the key problem that can ruin the whole process.
Our contributions in this paper are the following:
∗
Corresponding author: Jean-Franc¸ois Hullo
• the definition of an uncertain 4-parameter transformation of 3D lines, and their representation, corresponding to levelled stations of TLS, cf. Section 3;
• the description of a probabilistic matching test, using propa-gation of probability density function resulting of an uncer-tain transformation, cf. Section 4;
• a test based on a real dataset of an industrial scene: its de-scription, results and a discussion, cf. Section 5.
2 A STATE OF THE ART
TLS data provides 3D features (points, lines, planes) through au-tomatic primitive reconstruction (spheres, cylinders, patches) that can be used for registration: (Rabbani and van den Heuvel, 2005), (Hullo et al., 2011). The matching of 2D features for registration is an active field of research in photogrammetry and computer vi-sion, known as pose estimation problem. Algorithms based on feature points correspondences might be used with precaution in the case of non Euclidean features, such as frames, lines or planes (Pennec, 1999). This assumption is all the more justified when dealing with uncertain primitives, and uncertain transformations of the primitives (F¨orstner, 2010), (Pennec, 1999).
Complete, unique and minimal representation of 3D lines does not exist. The advances in projective geometry led to a convenient representation of lines, including lines at infinity, the Pl¨ucker co-ordinates. (F¨orstner, 2010) presents an approach for dealing with uncertain 3D lines and rigid 6-parameters transformations. (Mei-dow et al., 2009) details the importance of propagation of un-certainties of 2D lines through the entire reasoning chain, from extraction to decision. The application to 3D lines is though not straightforward.
total stations. Since a 3D line only has 4 degrees of freedom, we can search for a proper representation to deal with uncer-tain transformations. Minimal representations used in (Roberts, 1988), (Schenk, 2004) and (Bartoli and Sturm, 2005) inspired the representation proposed in 3.2.
For registration, weighted least square resolution can be carried out (Rabbani et al., 2007). Another approach uses probability for solving pose (Chaperon et al., 2011). This approach better taking into account a priori information (uncertainty and coherence). For matching too, probabilistic frameworks have been developed in the past few years, for example (Tal and Spetsakis, 2010) and (Van Wyk et al., 2004). They pave the way for a better integration of approximated geolocation systems and their uncertainties.
3 3D LINES, TRANSFORMATIONS AND UNCERTAINTY
3.1 Levelled TLS and 4-parameters transformations
We introduce the stationsSti with associated Cartesian coordi-nate systemRisuch asi∈I. The originOicorresponds to the virtual centre of the laser scanner. R0 is the global, orworld,
coordinate system.
Considering a levelled TLS, the only directional degree of free-dom of the Euclidean transformationτij=τRi→Rj from frame
Rito frameRjis the rotation around thez-axis, with valueκij.
tij is the 3-vector with coordinates[txtytz]ij representing the translation bringingOitoOj. For the frame transformation from RitoR0, we use the following notation:κi0=κiandti0=ti.
Using this formulation, the frame coordinate transformation of a pointPfromRitoR0is :P0=MκiPi+tiwhereMκiis the
rotation matrix aroundz-axis with valueκi.
We use different probability distributions to quantify the uncer-tainty of these 4 parameterstx,ty,tz andκ. Lett = [txtytz] be a random vector (the translation vector). We introduce a 3-dimensional multivariate normal distribution. It can be defined using two parameters(µ,Σ), respectively the mean 3-vector and the3×3covariance matrix. The probability density function is given by:
Letκ, the orientation of a station, be a random variable. We intro-duce a von Mises distribution, or circular normal distribution. It can be defined using two parameters(χ, λ), respectively describ-ing the location and the concentration of the random variableκ. The valueλparameter (λ ∈ [0;∞]) is 0 when the distribution is uniform, and increases as the distribution concentrates about the angleχ. The probability density function ofκis given in (Mardia, 1972) by:
gχ,λ(κ) = 1
2πI0(λ)
eλcos(κ−χ)
(2)
whereI0is the modified Bessel function of order 0. For an order
j, this function is given, using the Gamma function (Abramowitz
and Stegun, 1964), by:
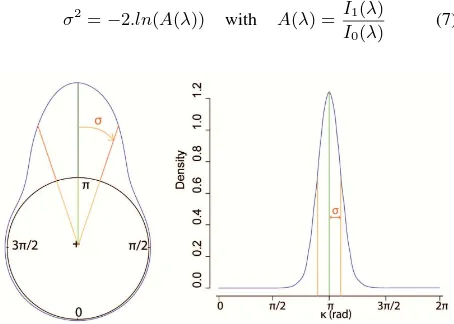
We can now introduceA(λ)that allows us to express the usual linear varianceσ2ofκ:
σ2=−2.ln(A(λ)) with A(λ) = I1(λ) I0(λ)
(7)
Figure 1: Circular and linear representation of the probability density function of a von Mises random variable with parame-ters(χ = π, λ = 10). σ = p
−2.ln(A(λ)) = 0.325rad is represented in orange.
For indoor scenes, several geolocation systems can approximate the 4 parametersκ,tx,tyandtz, such as INS or odometer. The parameters of thea prioridistribution of the approximated val-ues are known through hardware specification or calibration of the geolocation system. The uncertainty of the approximated po-sitions and orientation of the stations of our dataset are given in 5.1.
3.2 3D lines: representation and transformation
Several representations exist for 3D lines. Some of them are com-plete (2 points), unique (Pl¨ucker) or minimal (two planes inter-section, Denavit-Hartenberg). In the case of incomplete represen-tations, we use several represenrepresen-tations, calledcharts, that overlap in order to handle all existing lines. We callatlasa set ofcharts.
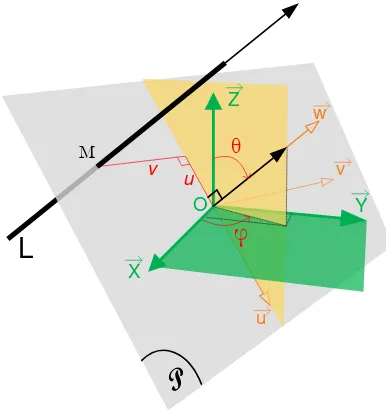
The use of one of these representations depends on the compu-tations and analysis carried out on the lines. In our case, we are interested in the uncertainty of the line coordinates through an uncertain transformation. Statistical analysis requires a minimal representation, as complete as possible. Since we are not deal-ing with projective geometry, we do not need to take into account lines at infinity. We thus introduce a representation inspired by (Roberts, 1988), illustrated in Figure 2. Frame transformation relationsτij=τRi→Rj of the coordinates of a line are also
pre-sented. The following parameters are used in our representation:
• Tilt: 0 ≤ θ ≤ π
2 is the angle between thez-axis of the
frame and the direction vector of the line
• Position:(u, v)∈R2are the coordinates of the intersection of the line to its perpendicular plane passing through the origin into the local frame(~u, ~v, ~w). This intersection point is also the closest point to origin. The local frame is obtained from the concatenated rotation of the main frame(X, ~~ Y , ~Z)
of az-axis rotation of valueϕand ay′
-axis rotation of value −θ.
u M
v
X
Y
v
u
φ
θ
P
Ow
Z
L
Figure 2: A representation for 3D lines. M is the closest point of the lineLto the origin O of the frame.
The frame coordinates transformation fromRi toRj, with pa-rameters(κ, tx, ty, tz)is given by:
θj=θi
ϕj=ϕi+κ
uj=ui+txcosθicosϕj+tycosθisinϕj−tzsinθi
vj=vi−txsinϕj+tycosϕj (8)
One can note that almost vertical lines (θ≈0) are a special case in this representation sinceϕis note defined. Since many lines are vertical in industrial scenes, we need to complete theatlas
using the followingchart for quasi-vertical lines. θ andϕare identical to horizontalchart. For defining the position of a quasi-vertical line, we use(x, y)as the intersection of the line and the
O ~X ~Y plane of the frame.
For the horizontal lines, the sign ofu0 is undefined since ϕis
only determined moduloπ. Practically, for matching tests, this case can easily be handled.
There are two main advantages to use thisatlas:
1. influences of the rotation and translation transformation pa-rameters are isolated
2. the “singularities” reflect in some way the information that the type of lines delivers for registration:
• Quasi-Vertical lines: ϕis ill-determined. A matched pair of quasi-vertical lines do not provide confident information on theκor thetz
• Oblique line: a pair of oblique lines provides informa-tion for both orientainforma-tion and posiinforma-tion parameters,
• Quasi-Horizontal line: a pair of horizontal lines pro-vides confident information onκ, (±π/2)and ontz, though it exists an infinity oftxandtysolutions.
3.3 Propagation of lines through uncertain approximated transformations
Our dataset is composed of a setEi of reconstructed linesLiα for each stationStiand approximations of the transformations parameters from each station coordinate systemRito the global coordinate systemR0. The coordinates of linesLiαare consid-ered as certain in the frameRiof their original stationSti, cf. (5.1).
To be able to compare a lineL1
A reconstructed inSt1 to
an-other line L2
B reconstructed inSt2, we have to express them
into a common coordinate system. Let assume that we express the coordinates of L1A = (θA1, ϕA1, uA1, vA1) intoR2, with L2
A = (θA2, ϕA2, uA2, vA2), using transformationτ12fromR1
to R2. This transformation is composed of two approximated
transformationsτ˜10andτ˜02 = ˜τ
−1
20. ThenL˜2A = ˜τ12(L1A) =
˜
τ02(˜τ10(L1A)). Sinceτ˜10and˜τ20are uncertain and followa pri-oridistributions, the resulting lineL˜2Awill have uncertain coordi-nates, followinga posterioridistribution. The parameters of the
a posterioridistributions of the lines coordinates resulting of an uncertain transformation are presented below. Notations of para-graph 3.1 are used for the distributions parameters.
TiltθA2: as described in (3.2),θis invariant to the 4-parameters
transformation. ThenθA1=θA2.
Directionϕ˜A2of non vertical lines: follows a von Mises
distri-bution with parameters(χ2, λ2). For the mean direction, we
have:χ2 =ϕA2=ϕA1+κ12=ϕA1+κ1−κ2. Theλ2
parameter is given by the equation:
A(λκ12) =A(λκ10).A(λκ20) (9)
where A is the ratio of the modified Bessel functions, (cf.3.1).
λκ2is estimated using an approximationA
invof the inverse of theAfunction, given in (Fisher, 1993). Consequently:
λ2=Ainv(A(λκ12)) (10)
Position(uA2, vA1)or(xA2, yA2): the distribution of the
result-ing 2D-random variable corresponds to a Gaussian random variable rotated by a von Mises random variable. For both
chartswe use as approximation a bi-variate normal distri-bution with parameters(µ2,Σ2). This approximation is
as-sumed as valid for small variances. The algebraic compu-tation of these parameters can be done developing the two first moments of the resulting random variable. However, in this first implementation, we currently used a Monte-Carlo estimation of these parameters. Probability density function of the bi-variate gaussian is given by:
hµ2,Σ2(x) = 1 (2π)|Σ|1/2e
(−1
2(x−µ2)TΣ− 1
2 (x−µ2)) (11)
4 PROBABILISTIC MATCHING OF 3D LINES WITH APPROXIMATED STATIONS
4.1 A priori probability density functions as matching score
A possible approach for computing a matching score between the linesL1
AandL2Bis to compute the density of probability ofL2B using thea posterioridistributions ofL2A. We can reformulate this idea by the following question:”Knowing the uncertainty of the transformationτ12, what is the probability for the line L2B reconstructed inSt2to be identical toL1Areconstructed inSt1?”.
We can also express this idea by using the following formulation:
d(L2
B = ˜L2A) :=d(L2B = ˜τ12(L1A)), wheredis the probability density value of the transformed coordinates ofLA.
One of the advantage of the introduced representation is to sep-arate the influences of the orientation and translation parameters of the transformationτ˜12. Using the formulas and the notations
for lines, detailed in 3, we express the probability score for both direction and position of the lines as follows:
- Non-vertical lines:
d(ϕA2=ϕB2) =gχ2,λ2(ϕB2) (12) d((uA2, uA2) = (uB2, uB2)) =hµ2,Σ2(uB2, vB2) (13)
- Vertical lines:
d((xA2, yA2) = (xB2, yB2)) =hµ2,Σ2(xB2, yB2) (14)
wheregandfare respectively the von Mises and bi-variate nor-mala posterioriprobability density functions ofL1
A. The higher these values are, the more probable is the match betweenLAand
LB.
4.2 Steps of the probabilistic 3D lines matching test
Using the previously described uncertainty propagation and den-sity values, the authors proposed a matching test for two 3D lines. They might represent the axes of reconstructed cylinders from two distinct stations of levelled TLS. The steps of this test are illustrated in Algorithm 1.
Algorithm 1Probabilistic 3D lines matching test if |rA−rB|< ρrand|θA−θB|< ρθthen
˜
s1 =gχ2,λ2(ϕB2) ˜
s2 =fµ2,Σ2(uB2, vB2)ORs˜2 =fµ2,Σ2(xB2, yB2) ˜
s= ˜s1∗˜s2
end if
Two preliminary tests concerns the invariants: radiusrand tiltθ. The radius of the cylinders are invariant to any rigid transforma-tion of a cylinder. The tilt is invariant to the 4-parameters trans-formation defined above. TLS point clouds are currently dense and reconstruction algorithms improved. We can reasonably con-sidered the radius as certain enough to use a threshold, depend-ing on the algorithm and the data set used. If more information is provided on the reconstruction step, one can use a threshold function.
The orientation test is performed onϕB2using thea posteriori
probability density function ofϕA1. The returns˜1 is a density
value.
The second test evaluates the position of the two lines. For the non-vertical ones, the two tested lines are first made parallel, to compare values of(u, v). This comparison is carried out using the probability density functions mentioned above. The return˜s2
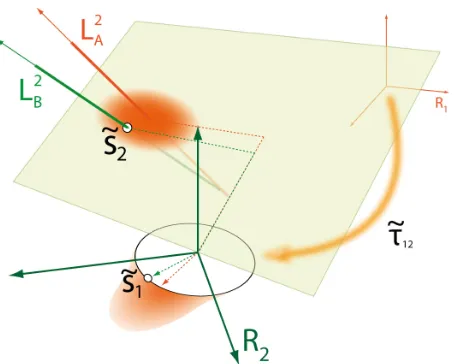
is a density value.˜sis the probabilistic matching score of the two
Figure 3: Probabilistic scores for matching computed witha pos-terioridistributions of lines coordinates.
tested lines.
One can note that any matching algorithm can produce: (a) cor-rect matches, (b) false positive (wrong match) and (c) false nega-tive (missed match). Some registration algorithms will better deal with wrong matches than other but all need as correct matches as possible. Error ratios of our implementation tested on a real dataset will be used to assess the presented approach.
4.3 Application to a multi-station scene
Let a scene be composed ofi ∈ I stationsStiwithαi recon-structed cylinders for each station. In each station, the cylinders are unique, such as any cylinderAireconstructed inStican only be matched with a unique cylinderBjreconstructed inStj. This leads to choose a best matching candidateBJforAi, using prob-abilistic score computed, wheres˜J = max(˜sj). A threshold based on confidence interval of the distributions reject weak max-ima.
A first remark may be made regarding the multi-station compu-tation of a probabilistic matching score. For any line, the match can: not exist in the dataset (cylinder only reconstructed in one station), be simple (cylinder reconstructed in two stations) or mul-tiple (cylinder reconstructed in more than two stations). it can be assumed that the more stations the cylinder is seen from, the more confident the match should be. This confidence should im-pact the value of the matching score. Probabilistic scores give access Bayesian theorem and Shannon-Gibbs entropy maximisa-tion, a powerful tool for decision making, cf. (Pennec, 1999) and (Mardia, 1972).
5 STUDIES AND ANALYSIS
5.1 The tested scene
al., 2011). Each per-station point cloud is composed of 25 mil-lions of points. Cylinders have been reconstructed using a region growing algorithm. This algorithm returns the following fitting errors: mean error<0.002 m , maximum absolute error<0.01 m. In every stations, we reconstructed 9 up to 16 cylinders, for a total of 53 cylinders (cf. Figure 4).
Figure 4: Dataset used in our tests. aCylinders reconstructed from 1 over 4 stations bAxes of cylinders in a common frame using approximate transformations cGround-truth transforma-tions (total station traverse) are used as reference.
“Real” positions and orientations of the TLS stations have been acquired with a total station. The approximations of the posi-tions and orientaposi-tions of the staposi-tions in a global coordinate sys-tem have been randomly generated using known expected errors of current indoor geolocation system (Hullo et al., 2011). Since industrial installations have horizontal grounds and that the in-strument heights are measurable, the approximation of thetzwill not overcome 10 cm. Fortxandtyvalues, geolocation system provides maximum errors of 15 cm to 50 cm in our study case. The maximum expected error of orientationκranges from 2◦
to 10◦
.
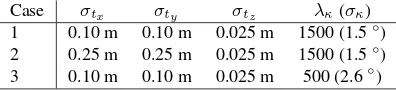
Given these error intervals, we carried out 3 tests using parame-ters of thea prioridistributions of the approximated transforma-tions, presented in Table 1.
Case σtx σty σtz λκ(σκ)
1 0.10 m 0.10 m 0.025 m 1500 (1.5◦ ) 2 0.25 m 0.25 m 0.025 m 1500 (1.5◦
) 3 0.10 m 0.10 m 0.025 m 500 (2.6◦
)
Table 1: A priori distribution parameters of the estimated 4-parameters transformation used.σis the square root of the linear variance.
As mentioned in 3.3, our implementation currently uses Monte Carlo samples to estimate thea posterioribi-variate normal dis-tributions. We also used the Monte Carlo method to confirm that the bi-variate normal approximation of the resulting random vari-able was valid. Once matching test is performed on every possi-ble match, our implementation searches for a maximal matching score for each line. In our dataset, we have 1031 score to compute for a maximum of 65 theoretically possible matches.
All the tests have been implemented using R, (R Development Core Team, 2011).
5.2 Results
Reference matches have been created by using “real” positions and orientations of the stations. 34 matches exists in the scene, 27 non vertical and 7 vertical. A visual inspection of each one as also been carried out. Results of our algorithm are given in Table 2.
Case number Correct False negative False positive
1 32 2 3
V=5 Hz=27 V=2 Hz=0 V=2 Hz=1
2 28 5 7
V=3 Hz=25 V=4 Hz=1 V=4 Hz=3
3 31 3 6
V=4 Hz=27 V=3 Hz=1 V=4 Hz=2
Table 2: Comparison of the results for the 3 tests performed and the ground truth. For each number, vertical (V) and non ver-tical (Hz) lines are specified. False negative values indicates missed matches. False positive values indicates wrongly detected matches.
These first results shows that our implementation, with our dataset and confidence intervals, correctly detect most of the matches. However, vertical lines are not as correctly handled as horizontal ones. More tests using other dataset will be performed to evalu-ate this trend. As expected, small variances return more correct matches than larger.
5.3 Discussion
The existence of false positive and false negative is mainly due to the decision step, currently implemented as a simple maximal score detection. With our dataset, even a small change of the po-sition and orientation of the stations heavily impact the relative distance between lines. In this situation, to properly handle the matching task, one need to take into account the whole structure of the scenes using Bayesian theorem. As mentioned in 4.3, the probabilistic score presented in this article offers such possible process. However, the detected matches and corresponding prob-abilistic scores computed using the current algorithm could be used as the input for a refinement stage.
The representation of the lines, presented in 2, is close enough to the representation of 4-parameters transformation to allow the distinct analysis of an uncertain one. Regarding the handling of vertical lines, the representation used shows the singularities of these lines when using 4-parameters transformations. The more they approach verticality, the more sensitive they are to a recon-struction error. The Fisher-Snedecor distribution conveys the in-fluence of the value of tiltθon the determination ofϕand could be used for quasi-vertical lines, instead of the von Mises distribu-tion.
Otherwise, one of the advantage of the presented probabilistic score is to take into account anya prioriknowledge of the uncer-tainty of the transformation parameters. Then, this score might not be use only witha prioriuncertainty of geolocation systems, but can be used during an iterative registration process to check the existing matches.
5.4 Considered improvements
Regarding the current implementation, some improvements have been mentioned:
• the use of a F-distribution for quasi-vertical lines might help to handle the direction sensitivity whenθis close to 0,
• probabilistic description of the contextual information , for example the probability of intervisibilities using a priori
CAD models and integration in a global score,
• Bayesian approach, witha prioridistributions, for better in-tegration the global structure of the scene by maximising the coherency of the network.
6 CONCLUSIONS AND FURTHER WORK
In this article, we have presented a probabilistic matching test using propagation ofa prioridistributions. This test has been ap-plied to 4-parameters uncertain transformation of 3D lines. This configuration corresponds to the matching of the axes of cylin-ders reconstructed from levelled TLS data, witha priori distribu-tion of transformadistribu-tion parameters provided by indoor geolocadistribu-tion systems.
We introduced a representation of the 3D lines allowing statistical analysis of the influence of an uncertain transformation. Direc-tional and Euclidean statistics were used to model the uncertainty of the transformation parameters and line coordinates. An algo-rithm using this matching test as been carried out on a real indus-trial dataset. Experimental parameters of thea prioridistributions were chosen to reflect levels of uncertainty of current geolocation systems. First results indicates the validity of the method.
Algebra computations will be carried out to complete the stochas-tic model. The use of a specific distribution, known as Fisher-Snedecor, is one of the lead considered by the authors is to handle the tilt of the lines and its influence. Information theory and prob-abilistic graphs are studied for the implementation of a structure-awareness algorithm.
Once the presented probabilistic approach is completed, we plan to compare it to other approaches used to match primitives, such as (Rabbani and van den Heuvel, 2005).
Further work is to integrate this matching algorithm in a prob-abilistic registration solver. The idea is to use the probabilities returned by the matching step to guide the registration and vice-versa. Longer-term objective is to shorten on-site time of acqui-sition by keeping at the same time the required accuracy of 1-2 cm of the final point cloud.
REFERENCES
Abramowitz, M. and Stegun, I. A., 1964. Handbook of Mathe-matical Functions with Formulas, Graphs, and MatheMathe-matical Ta-bles. ninth dover printing, tenth gpo printing edn, Dover, New York. ISBN 0486612724.
Bartoli, A. and Sturm, P., 2005. Structure-from-motion us-ing lines: Representation, triangulation, and bundle adjustment. Computer Vision and Image Understanding 100(3), pp. 416–441.
Chaperon, T., Droulez, J. and Thibault, G., 2011. Reliable cam-era pose and calibration from a small set of point and line cor-respondences: A probabilistic approach. Computer Vision and Image Understanding 115(5), pp. 576 – 585. Special issue on 3D Imaging and Modelling.
Fisher, N. I., 1993. Statistical Analysis of Circular Data. Cam-bridge, New York. ISBN 0521568900.
F¨orstner, W., 2010. Minimal representations for uncertainty and estimation in projective spaces. In: Proc. of Asian Conference on Computer Vision, Springer, pp. 619–632.
Hullo, J.-F., Grussenmeyer, P., Landes, T. and Thibault, G., 2011. Georeferencing of tls data for industrial indoor complex scenes: beyond current solutions. In: ISPRS Workshop Laser scanning 2011, Calgary, Canada, Vol. 38.
Mardia, K. V., 1972. Statistics of directional data. Academic Press, New York. pp. 41-45 of 357, ISBN 0124711502.
Meidow, J., Beder, C. and F¨orstner, W., 2009. Reasoning with uncertain points, straight lines, and straight line segments in 2d. ISPRS Journal of Photogrammetry and Remote Sensing 64(2), pp. 125–139.
Pennec, X., 1999. Probabilities and statistics on riemannian man-ifolds: Basic tools for geometric measurements. In: Proceedings of the IEEE-EURASIP Workshop on Non-Linear Signal and Im-age Processing (NSIP99), Vol. 4, Citeseer, pp. 194–198.
R Development Core Team, 2011. R: A Language and Envi-ronment for Statistical Computing. R Foundation for Statisti-cal Computing, Vienna, Austria. ISBN 3-900051-07-0.http: //www.R-project.org.
Rabbani, T. and van den Heuvel, F., 2005. Automatic point cloud registration using constrained search for corresponding objects. In: H. Kahmen and A. Gruen (eds), Proceedings of 7th Confer-ence on Optical, Vol. 1, Vienna, Austria, pp. 3–5.
Rabbani, T., Dijkman, S. T., Van Den Heuvel, F. and Vosselman, G., 2007. An integrated approach for modelling and global reg-istration of point clouds. ISPRS Journal of Photogrammetry and Remote Sensing 61(6), pp. 355–370.
Roberts, K. S., 1988. A new representation for a line. In: IEEE Proceedings of Computer Vision and Pattern Recognition, Ann Arbor, MI, pp. 635–640.
Schenk, T., 2004. From point-based to feature-based aerial trian-gulation. ISPRS Journal of Photogrammetry and Remote Sensing 58(5-6), pp. 315–329.
Tal, R. and Spetsakis, M. E., 2010. Probabilistic framework for feature-point matching. In: Proceedings of the 2010 Cana-dian Conference on Computer and Robot Vision, CRV ’10, IEEE Computer Society, Washington, DC, USA, pp. 1–8.