*
, Il'lt
!
sr:.f; .:+e, .!,: et.l:
'.--:r:::: :: r*:t ::i
{:.. -
-: :1,1
l,i€J1'at
:
,..QS.{R
Smi'0r
L{\TH0\T
D[Rtl,{Ttlr$
A5.{\-il
PL.{ S\ IODI.{I .{GE\-I Sr,,*-.r,....-. i-,, i.," t1 .,.t1,. ., r'](-.i i, r-.",.
.{BS]R{CT
.'ise;w ad;..:s iq:.;::.* i;,* ir* "iy*':*i:: xii;i:r .el.:l::;':, l;r:l* :e:: .i iir.x**alr,**pr:a irp::..:r:i.gr:,gh:tr:*::,.*.r;,:'i::.i.r::ee*e*-, j--:.r:3::r:i
::lr:rr */:*.r;rsr,r: ,rz+* n';"i;::r'r m:l.:d ra ;pri{, * :;' *la}i*i jlti a:&i t}r J; l:*Ar/i *ri. f,l: tk !r.r i: r,:r ,'r:::.' i i; ;":r::' :"-j ;, J: : i - '
'-' ;::is g.,-g:;r:
illt a;:!'i rs.e ;*fx !;, ;0"n, 9rr,::*:. .3.1/-: r, r.r .'::c;.. c yi .i:j;::r Ar ,;:ri: :!*z*ii,*t*':c:r*,rc*-:n{'js!.;;c i:3l.'-.' =I -.:.t,';.j'- -i --. ;i,,
-.j j.i,:,j ?i ;: - l i-.: ir =.;.'lii.i' j ll;j,:.
FLlL
iE\I
-,_- ::.,1 :::
l.-- ": :.:.: :,: ,'i;, r-i:i
:-.y. f-. .=. -_1aa
.l --.. , -. ,-
-l=:r '-: r:: !::::
l:-:' : l:=:;:
:-r---::r==:: a:.:i-I:::='.: r,:l -:s .
i, .: :!.:',= ;r:::i
\
3
c
is
L^
-&^rA by
!
cofiuf
H..tt/.l-X
:
3
@-q
FT,'
\*4o*.
sio*
)aorvrat
=q
C[nn,*^
t+z
QSAE
sfu
dy
of
xanthone
derivatives
as
Anti plasmodial
t-
r CorespondenlErna[;am?nade amadr,ahgo.'com -.' HP.{62sf,rT/r.mt
t*
uaeaY
agents."
@-q
z/
tt
/tr
SuPttn'o
ISSN
ONLINE
kontak
kami >
Nomor
ISSN Yang
telah
diterbitkan
:"
Kata kunci :l-
tahun permohonanpisahkan kata kunci dengan spasi. untuk melihat daftar ISSN lengkap, klik tombol CARI tanpa menuliskan kata kunci apapun...
Tanggal permohonan :
Nama
terbitan
::
Frehilensi terbitan
r URL pendek : hftp ://u. Iipi. qo.id/l 43271 65Bo
r kirim ke teman
r versi cetak
r berbagi melalui Fac€book
r beruagi melalui Twitter
> markah halaman ini
PDII dAN TGJ LIPI
1432796586
Kamis, 28 Mei20'15
lndonesian Journal of Chemistry (e-Joumal)
lndonesian Joumal of Chemistry adalah jumal ilmiah internasional empat
Out"nrn (terbit Maret, Juli dan ilovember) yang menerbitkan artikel ilmiah
oin"rursilisub-bidang kimia, pendidikan kimia dan teknik kimia sejak 2o01' Jurnal ini tetah terakrelitasi nasional oleh DIKTI sejak 2014 dan terindeks di Scopus sejak 2012.
ISSN cetak: 1411-9420.
Jurusan Kimia FMIPA UGM
> http://pd m-mi pa. u gm. ac. id/ojs/i ndex' ph p/ijc/
Prof. Dr.rer.nat. Nuryono, MS
Jurusan Kimia FMIPA UGM
Sekip Utara, YogYakarta 55281
>
tei
/fax
0274545188/
0274545188Lingkar Graphic, Jl. Nangka 1 No. 154 D, Sanggrahan RT 009/Rw 014' Karangnongko, Maguwoharjo, Sleman
> hllp'.111432796586
4 bulanan
2460-1 57 8 (media online)
Indo. J. Chem., 2010, 10 (3), 357 - 362
Amanatie et al.
357
QSAR STUDY OF XANTHONE DERIVATIVES AS ANTI PLASMODIAL AGENTS
Amanatie1,*, Jumina2, Mustofa3, M. Hanafi4, and Ria Armunanto2
1
Student of Doctoral Program, Department of Chemistry, Faculty of Mathematics and Natural Sciences, Universitas Gadjah Mada, Yogyakarta, Indonesia
2
Department of Chemistry, Faculty of Mathematics and Natural Sciences, Universitas Gadjah Mada, Yogyakarta, Indonesia 3
Faculty of Medicine, Universitas Gadjah Mada, Yogyakarta, Indonesia 4
Center for Chemical Research, Indonesian Institute of Science (LIPI), Serpong Tangerang, Indonesia
Received April 1, 2010; Accepted September 8, 2010
ABSTRACT
Xanthones and their derivatives have been reported to exhibit inhibitory activities towards Plasmodium falciparum. To provide deep insight into the correlation between inhibitory activities and structures of xanthones, linear regression method was employed to establish QSAR models for 16 xanthone derivatives that have diverse structures. The accuracy and predictive power of the proposed QSAR model were verified by semi empirical PM3 method, optimation, and validation. The result showed that the best model is model 3 i.e. Log 1/IC50 =
Σ (-1.446)qO(7)+ (-8.775)q.C(12) + (-10.592)qC(13) + 1,979; Y = PRESS = 1.124192.
Keywords: QSAR, xanthone, Anti plasmodial agents
* Corresponding author. Tel/Fax : +62-8179444737 Email address : [email protected]
O O R1
R2
R3
R4
R6
R8
R7
R5
INTRODUCTION
The spreading of malaria is so quickly and very widespread expanding, because of its resistant parasites, especially Plasmodium falciparum to chloroquine. Such a thing has pushed the researchers to find new malarial drugs which are more potential. Several approaches had been conducted to find new antimalarial drugs, for examples through modification of chemical structure toward antimalarial compounds having higher antiplasmodium activity and exploration of natural products, especially to traditional drugs that have been applied for malaria treatment [1]
Based on that description and considering some factors which have been mentioned by some researchers, hence we have conducted a QSAR analysis toward 16 compounds of xanthone derivatives as listed in table (1) (compounds 1-16), which have been reported by Likhitwitayawuid [2]. The QSAR analysis in this research is different from QSAR analysis which has been conducted by Tahir and Mustofa [3] which only used atomic net-charge as descriptor and semi empiric AM1 method. This research used atomic net-charge, dipole moment, log P as well as polarizability as descriptors in semi empiric PM3 method. The calculation using those descriptors was carried out to obtain the best new model equation. The equation was then used to predict and get information about antimalarial activity of xanthone derivatives. The xanthone derivatives have been well known as potential antimalarial activity against Plasmodium falciparum.
This research, besides using atomic net-charge, this is also uses other descriptors i.e. dipole moment, log P and polarizability procedure by semi empiric PM3 method. Those considerations were carried out to obtain the best new equation model. In this study, the QSAR analysis of 16 xanthone derivates is conducted using atomic net charge calculated by semi empiric PM3 method as main descriptors to obtain model equation for predicting antimalarial activity and to get information about activity antimalarial of xanthone compounds. Derivatives of xanthone compounds have been known as potential antimalarial activity against Plasmodium falciparum.
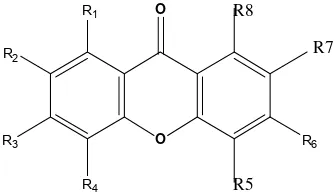
The xanthone structure compounds were illustrated in Fig. 1, while chemical structure derivatives of xanthone as well as their xanthone activities are presented in Table 1.
The use of the electronic structure of the molecule based on semi empirical calculation, such as PM3 as descriptors in QSAR study, has been shown in some
[image:4.595.357.524.634.730.2]Indo. J. Chem., 2010, 10 (3), 357 - 362
[image:5.595.99.513.126.315.2]358
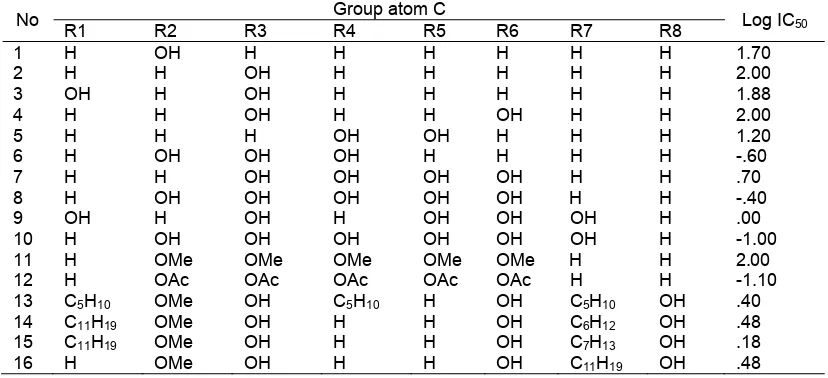
Table 1. Series 16 xanthone derivatives and antiplasmodial activity
No Group atom C Log IC50
R1 R2 R3 R4 R5 R6 R7 R8
1 H OH H H H H H H 1.70
2 H H OH H H H H H 2.00
3 OH H OH H H H H H 1.88
4 H H OH H H OH H H 2.00
5 H H H OH OH H H H 1.20
6 H OH OH OH H H H H -.60
7 H H OH OH OH OH H H .70
8 H OH OH OH OH OH H H -.40
9 OH H OH H OH OH OH H .00
10 H OH OH OH OH OH OH H -1.00
11 H OMe OMe OMe OMe OMe H H 2.00
12 H OAc OAc OAc OAc OAc H H -1.10
13 C5H10 OMe OH C5H10 H OH C5H10 OH .40
14 C11H19 OMe OH H H OH C6H12 OH .48
15 C11H19 OMe OH H H OH C7H13 OH .18
16 H OMe OH H H OH C11H19 OH .48
reports. This can lead to useful model equations for the prediction of antimalarial activity from the calculated atomic net charges [4].
EXPERIMENTAL SECTION
Materials
This research is a theoretical study that uses PM3 semi empirical method in QSAR models of xanthone derivatives. The structure of xanthone compound is illustrated in Fig. 1, while the structures of xanthone derivatives as well as their xanthone activities are presented in Table 1. All xanthone derivatives are used in computational chemistry calculation to produce predictors. 16 xanthone derivatives as antimalarial agents are applied to statistical calculation as dependent variable for antiplasmodial activities. Data are obtained from the journal have been reported to show antimalarial activities by Likhitwitayawuid [2].
Instrumentation
Computational chemistry calculations are conducted at Yogyakarta State University, Yogyakarta, Indonesia and Organic Chemistry Laboratory of Mathematics and Natural Science, Yogyakarta State University, Yogyakarta, Indonesia, and Organic Chemistry Laboratory, Faculty of Mathematics and Natural Science Universitas Gadjah Mada, Yogyakarta, Indonesia. Calculations were performed on, Intel (R) Pentium IV with 2.66 GHz processor, 2.77GB of RAM, and 40 GB Harddisk Drive, The software’s used are Hyperchem ver. 7.0 (for electronic calculation and predictor) and SPSS ver. 15.0 (for statistical analysis).
Procedure
Semi-Empirical PM3 Method Selection
Each compound is drawn into a three dimensional (3D) model of compound. Then calculations of parameters are set up for each model. The semi-empirical PM3 method was chosen in this study. This method was successively to develop and to refine of the previous methods such as AM1 semi-empirical. The 16 series consists of xanthone derivatives, group atom C and the value of antiplasmodial activity (Log IC50).
Electronic Parameters Calculation Results
The Computational chemistry calculations were performed using semi-empirical method PM3. This method was improved from the previous methods such as MNDO [5] which can predict the compounds with an oxidation number of lots. One result of the calculation by using computational chemistry programs can provide output data in the form of the atomic net charge. In Table 2 presents data on the atomic net charge for the carbon atoms of the 16 compounds, which used for QSAR analysis.
Data in Table 2 contains the IC50 values for 16
xanthone derivatives having antimalarial activity [6], so we get the results of the relationship between log IC50
with atomic net charge of 16 compounds that were analyzed as presented in Table 2.
The value of the atomic net charge, dipole moment, log P, and polarisability from xanthone derivatives. Table 2 shows that there is influence of group substituent. Substitution of an atom on C2
instance will result in the reduction of the C2 negative
charge relative to the load from the C2 atom cluster
compounds without substituent. The existence of this cluster resulted in partial reduction of the charge induction.
Indo. J. Chem., 2010, 10 (3), 357 - 362 359
Table 2. Value atomic net charges, dipole moment, log P and polarizability of xanthone derivatives used in the models
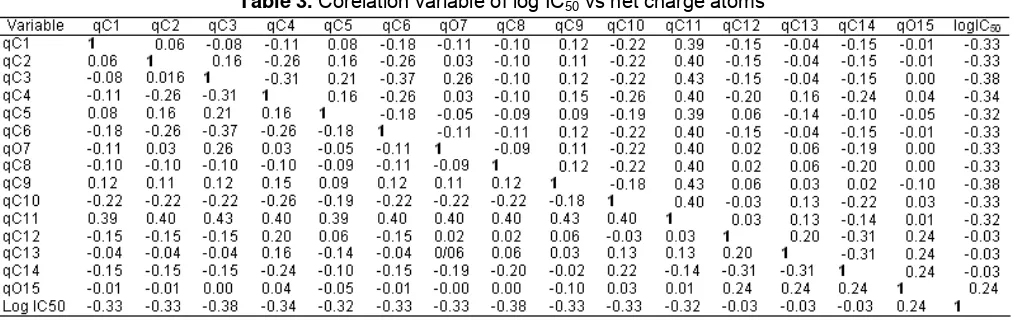
Table 3. Corelation variable of log IC50 vs net charge atoms
The C originally bounded by H atoms. The atomic charge on C was quite negative, but after the H atom is replaced with a cluster, the atomic charge at C will decrease to the negative value. This indicated that the position of H in more distant groups resulted in large differences in atomic charge on an atom with clusters substituent different. The groups substituent -CH3
and-OCH3, a reduction of the negative value will be greater
with substituent -OCH3-CH3 compared with, this is
because the position of the atoms H-OCH3 on farther
than the-CH3. Substitution at an atom effect also on the increase or decrease the negative value of the atomic charge on the atoms in the next position. It will induce the atoms on the next position.
The induction process can be explained as follows. The existence of substitutions in a single atom, would lead to the induction pattern of the partial charge of each atom, from C1 to C15 reduction which will occur or
negative value addition in alternating intervals. E.g. to substitutions at the C2 atom charge will decrease the
negative values, as well as for the C3 and C5 are the
atoms C1, C3 and C5 would increase the negative value.
For substitution in the sequence e.g. C atoms C3 and C4
will induce the atoms in other positions of C1, C2, C12
and C13 that is becoming increasingly negative values.
This can be presented in Table 3.
Results Analysis of QSAR
Regression analysis was used to determine the variable-free variables selected in model building QSAR equation. The statistical parameters used in the regression analysis as a factor in decision-making is R determination, SD and F. Independent variables can be reduced and supplemented. For a good analysis, then for n independent variables at least 2n +1 data sample used for analysis. In this study, 16 samples derivatives compounds xanthone means for good statistical analysis, used at least nine independent variable. They can be obtained from the main structure of the atomic net charge that is on the ring in xanthone compounds that includes C1, C2, C3, C4, C5, C6, O7, C8, C9, C10, C11,
C12, C13, C14, and C15.
The study was based on the position of substitution, which occur relatively influence on the antimalarial activity of xanthone derivatives. Based on relatively small sample size, get a good equation, so in
[image:6.595.55.562.309.469.2]Indo. J. Chem., 2010, 10 (3), 357 - 362
360
Amanatie et al.
Table 4. QSAR Model, R value, Fcount, Fcount/Ftable
Model R Fcount Fcount /Ftab
I 0.97 18.871 0.001
II 0.635 1.183 0.396
III 0.843 4.315 0.045
IV 0.711 1.224 0.400
V 0.786 1.346 0.381
VI 0.757 1.122 0.460
VII 0.854 2.248 0.196
VIII 0.911 2.627 0.136
IX 0.635 1.8 0.225
X 0.812 2.318 0.168
XI 0.921 4.689 0.056
XII 0.834 2.746 0.126
Table 5. Standard Deviation (SD) model 1 and model 3 No Model Standard Deviation (SD) 1 Model 1 SD = 1.15600
2 Model 3 SD = 1.13768
this study used 15 independent variables that qC1, qC2,
qC3, qC4, qC5 , qC6, qO7, qC8, qC9, qC10, qC11, qC12,
qC13, qC14, qO15 to be involved in statistical analysis.
The data are presented in Table 2.The moment dipole, log P and polarizabilities of the ring are not involved in the QSAR test. Without a factor that should be used in the design of new antimalarial drugs.
Log IC50 correlation with the atomic net charge
To see the distant relationship between the variables and performed correlations among variables involved. It is done mainly by looking at the level of influence of each of the atomic net charge against the log IC50 value. The value of the correlation between
variables was calculated by statistical analysis. The values of the correlation between variables are presented in Table 3. Correlation is stronger for the data which approximates the value of R = 1 or R = -1. Table 4 shows that the independent variable is relatively strong influence on the value of antimalarial activity. log IC50 is
the value of activities of plasmodium falciparum. This figure is quite close to one. Therefore, if there is a substitution group allegedly positioned anywhere on the ring in xanthone due to the changes in the value of the net charge of atoms C1 and C2 would result in a change
in the activity of xanthone derivatives. Furthermore, if observed further shows that there are significant differences or the influence of independent variables qC1, qC2, qC3, qC4, qC5, qC6, qO7, qC8, qC9, qC10, qC11,
qC12, qC13, qC14, qO15, and qC16 against not free variable
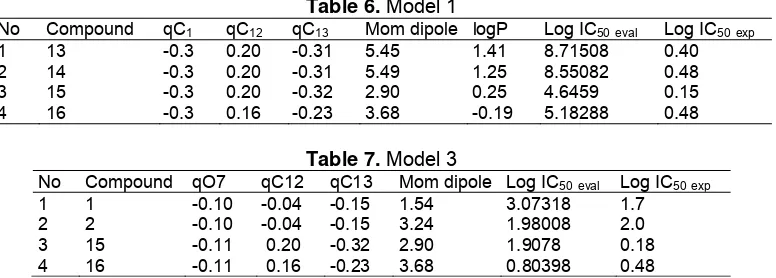
log IC50 is different. The Table 6 shows that qC12, qC13,
qC14 and qC15 for model 1 are dominant. Table 7 showed
that qC1, qC2, qO15 and qC16 for model 3 are dominant.
Therefore we need further analysis to determine the best equation model with the most significant data. Equation of these relations is [8]:
50 (7) (7) (12) (12) (13) (13)
Log 1 IC =
∑
P q + P q + P q + D (1)(
)
2n
50 50
PRESS =
∑
log IC experiment - logIC prediction (2)RESULT AND DISCUSSION
The calculated PM3 atomic net charges, dipole moment, log P and polarizability of xanthone derivatives used in models are listed in Table (2) in searching for appropriate models according to eq.(1). This allows the exclusion of less relevant atoms and provides opportunity for a gradual evaluation of y the atoms influencing significantly of the anti malarial activity of molecules.
Multilinear regression analysis
Statistical analysis is used to process data on the determination of the best QSAR equation model using multilinear regression analysis. From the data correlation is known that qC1, qC2, qC3, qC4, qC5, qC6,
qO7, qC8, qC9, qC10, qC11, qC12, qC13, qC14, qO15 are
dependent variable against log IC50 is relatively the
same. It is difficult to determine exactly where the most dominant variable. Therefore it is performed a variety of independent variables to obtain the best QSAR equation model. Using variation of 12 combinations of four variables obtained QSAR equation model was chosen worthy to be studied, the R value, F value and Feval/Ftable presented in Table 5. This equation was
chosen based on the value of R, F value, Feval/Ftable.
The equation was chosen to have relatively high R value close to 1 or -1 which means the equation quite linier (linearity test). The more linear means the better expected evaluation. In statistical analysis, commonly used R for R is greater accuracy compared to r. Selected equations is presented in Table 5. The equations which have a relatively high R is firstly performed. The highest R value for 0.970 is a model 1 involving the independent variable, while the lowest R value for 0.635 is the model of 2 and 9 involving the free variable. The range of values for R is 0-1. For R values equal to zero means no relationship at all among the independent variables and the atomic net charge dependent variable log IC50. If the value of R
Indo. J. Chem., 2010, 10 (3), 357 - 362 361
Table 6. Model 1
No Compound qC1 qC12 qC13 Mom dipole logP Log IC50eval Log IC50exp
1 13 -0.3 0.20 -0.31 5.45 1.41 8.71508 0.40
2 14 -0.3 0.20 -0.31 5.49 1.25 8.55082 0.48
3 15 -0.3 0.20 -0.32 2.90 0.25 4.6459 0.15
[image:8.595.56.293.183.422.2]4 16 -0.3 0.16 -0.23 3.68 -0.19 5.18288 0.48
Table 7. Model 3
No Compound qO7 qC12 qC13 Mom dipole Log IC50eval Log IC50exp
1 1 -0.10 -0.04 -0.15 1.54 3.07318 1.7
2 2 -0.10 -0.04 -0.15 3.24 1.98008 2.0
3 15 -0.11 0.20 -0.32 2.90 1.9078 0.18
4 16 -0.11 0.16 -0.23 3.68 0.80398 0.48
Table 8. Log IC50hit and log IC50exp of Model 1
No Log IC50 hit Log IC50 exp log IC50 exp -
log IC50 hit Δ 2
1 0.7073 0.40 -0.3073 0.094433
2 -0.967921 0.48 -1.447921 0.209647
3 0.755808 0.15 -0.605808 0.367003
4 1.726755 0.48 -1.246755 0.0155439
Table 9. Log IC50eval and log IC50exp of Model 3
No Log IC50eval Log IC50 exp log IC50 exp -
log IC50 hit (Δ) Δ 2
1 -4.65515 1.7 6.35515 40.38793
2 -0.779654 2.0 2.779654 7.7266476
3 -1.68471 0.18 1.86471 3.477143
4 -1.85655 0.48 2.33655 5.459465
Significance of data is then performed by observing the standard Deviation (SD). The smaller the standard deviation (SD), are the more significant data. SD parameters in this study provide useful information because the value is spreading of on 1.13768, and then subsequently used to test the parameters of F. The greater F value, the more significant data. If the observed value of F, then the highest F value was to model one. Amounted to 18.871. Medium for the lowest F value is model 6 with a value of 1,122 and then by using the F table for comparison. F value is calculated relative to Ftable. Calculate the Fratio/Ftable is presented.
Data will be significantly calculate if the Fratio/Ftable > 1 or
F calculated > F table of Table 5 shows that Feval/Ftable is
smaller than one is to model 3 with a value of 0.045. Table 6 and 7 shows model 1 and model 3.
The model 3 involved three independent variables qC1, qC2, qC3, qC4, qC5, qC6, qO7, qC8, qC9, qC10, qC11,
qC12, qC13, qC14, qO15, although very high R value of
0.970 shows that the ratio value of Feval/Ftable = 0.045 is
less smaller than one Feval of means that F is much
smaller than the Ftable. This regression equation was
statistically acceptable. It means that the three models can be selected as the best QSAR equation models of the 12 selected QSAR equations. Having obtained the best equation model, conducted a review between the
variables involved to see the relationship between variables.
Determination of the best QSAR equation model
Based on the calculation of regression statistics obtained a strong correlation between changes in molecular structure represented by the electronic parameters derivatives compounds and antimalarial activity xanthone substituted. Of the 12 equations obtained by a model equation was chosen the best three models presented in Table 5.
The selection model of equation 3 as the best of the 16 models are based on the selection equation: 1). A small price for the level of trust 0.001 means passing the borderline level of significance is p-0.05 or the data is quite significant. 2). Price R and SD (standard deviation, of R= 0.843 and SD = 1.1703. 3). Price F i.e. if the value of F exceeds the value of F table or a ratio value of Feval/Ftable is smaller than one. Feval/Ftable for
model 3 = 0.045.
Thus the equation is significant enough to be the model best QSAR equations from a series of compounds derived antimalarial xanthone. SD value that represents the value of standard deviation which has a relatively small amount of 1.13708 R value of 0.843 means that about 84.3% variations of log IC50
values caused by the variation of the atomic net charge free variable. In other words we can say that changes in the antimalarial activity of compounds derived xanthone on a series of compounds derived xanthone around 84.3%. It is caused by changes in electron density in the selected atoms. R value is close to 1 means that the correlation between independent variables and no free near-perfect, the influence of independent variables in this case the atomic net charge against the log IC50 quite perfect (ideal). F value
is a measure of the level of significance of differences in the regression equation model. F value is 4.815 with F value ratio/F table value of 0.045 is received so the regression model 3 can be accepted as the best QSAR equation model.
Indo. J. Chem., 2010, 10 (3), 357 - 362
362
[image:9.595.89.255.113.158.2]Amanatie et al.
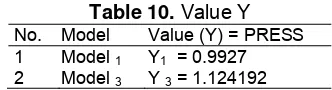
Table 10. Value Y No. Model Value (Y) = PRESS 1 Model 1 Y1 = 0.9927
2 Model 3 Y 3 = 1.124192
Parameter values and SD for three models are presented in the Table 10.
Further validation of the best model may be evaluated by comparing PRESS (predictive residual sum of square) value of the model 1 in Table 5 and the model 3 in Table 6. This parameter is defined as sum of square of difference between observed activity and predicted activity calculated by the corresponding model. The model with the smallest value of PRESS is the best model because it implies that the difference between the observed and the predict activities is minimal. Results of PRESS calculation for each model as listed in Table 5 again confirms that model 3 is the most reliable model because in induces the smallest PRESS value.
The best QSAR regression equation based on equation 1, and the parameters in the Table it is Hansch analysis:
50 (7) (7) (12) (12) (13) (13)
Log 1 IC =
∑
P q + P q + P q + D50 (7) (12) (13)
Log 1 IC = -1.446 q O + -8.775 q C + -10.592 q C
+ 1,979
∑
Y = PRESS = 1.124192
n = 16, R = 0,843, SD = 1.13768, Feval/Ftable = 0.045
CONCLUSION
We have used a semi empirical molecular orbital calculation PM-3 to study the correlation between atomic net charge and the antimalarial activity of a series antiplasmodium against wild type of the xanthone derivatives. The best QSAR regression equation is:
50 (7) (12) (13)
Log 1 IC = -1.446 q O + -8.775 q C + -10.592 q C
+ 1,979
∑
Y = PRESS = 1.124192
n = 16, R = 0,843, SD = 1.13768, Feval/Ftable = 0.045
ACKNOWLEDGEMENT
The author would like to thanks “Menristek’ with contract:No.013/RT/D.PSIPTN/Insentif/PPK/I/2009/Janu
ary 20, 2009, and Doctorate programme with contract: LPPM-UGM/1175/2009/April 3, 2009.
REFERENCES
1. Mustofa, 2000, In- vitro and in-vivo activity of the divers of natural and synthetic antimalarial: effect of potentialisator and the possibility of mechanism of actions, Dissertation, University of Montpellier I, France.
2. Likhitwitayawuid, K., Chanmahasathien, W., Ruangrungsi, N., and Krungkrai, J., 1998, Planta Med., 64, 3, 281–282.
3. Tahir, I., Mudasir, Yulistia, I., and Mustofa, 2005, Indo. J. Chem., 5, 3, 255–260.
4. Mudasir, Herawati, Ethica, S.N., and Wijaya, K., 2003, QSAR analysis of antimalaria primaquine and mefloquine analog based on quantum chemical parameters, The 39th ”IUPAC Congress and 86” Conference of Canadian Society for Chemistry, Ottawa, Canada, August 10-15, 2003, 295.
5. Leach, A.R., 1996, Molecular Modeling Principles
and Aplications, Addison Wishley, Longman,
Southampton University, London, 90.
6. Likhitwitayawuid, K., Phadungcharosen, T., and Krungkrai, J., 1998, Planta Med., 64, 1, 70–72.
7. Santoso, S., 2000, Process statistical professionally, Elex Media Komputindo, Jakarta, 75.
8. Hansch, C., and Leo, A., 1995, Exploring QSAR, Fundamentals and applications in Chemistry and
Biology, ACS Professional Reference Book,
American Chemical Society: Washington, DC, 19. 9. Karelson, M., and Lebanov, V.S., 1996, J. Chem.
Rev. 96, 1027–1043.
10. Kimura, T., Miyashita, Y., Funatsu, K., and Sasaki, S, 1996, J. Chem. Inf. Comput. Sci., 36, 185–189. 11. Mudasir, 2003, Quantitative Structure Activity
Relationship Analysis (QSAR) of Antimalarial
Vineadifformine Analogues Compounds,
Proceeding of 8th Scandinavian Symposium on Chemometric, 1–12.