Lipid Profile in Type 2-Diabetic Women with Central Obesity and
Non-central Obesity
Scholastica Diana Nurvitasari,1 Nanny Natalia MS,2 Yovi Yoanita3
1Faculty of Medicine Universitas Padjadjaran, 2Department of Internal Medicine Faculty of
Medicine, Universitas Padjadjaran/Dr. Hasan Sadikin General Hospital Bandung, 3Department of Clinical Nutrition Faculty of Medicine Universitas Padjadjaran
Abstract
Background: Type 2 Diabetes Mellitus and central obesity are associated with higher risk of cardiovascular
diseases especially in women. Lipid profile may reflect dyslipidemia which includes hypertriglyceridemia,
increased level of LDL-C, total cholesterol, and reduced HDL-C level in the blood. Patients with central obesity tend to have dyslipidemia compared to those without central obesity counterpart. The study aimed
at comparing lipid profile in central-obese diabetic women and non–central-obese diabetic women.
Methods: This study was an analytical study with cross–sectional approach conducted in Dr. Hasan Sadikin
General Hospital, Bandung, Indonesia in 2013. A total of 160 data contained of waist circumference (WC) and the level of total cholesterol, triglyceride, HDL-C and LDL-C were obtained from medical record of
Diabetic patients within the period of January 2010–January 2012. Women patients whose WC of ≥80 cm were classified as central obesity while WC of <80 cm were classified as non-central obesity. The t-test was used to compare means of different variables, p<0.05 was considered as statistically significant.
Results: Central obese diabetic women when compared to non-central obese diabetic women showed
statistically significant increase in the level of total cholesterol serum, triglyceride serum and decrease in HDL-C serum level (p<0.05). The LDL-C serum level did not show statistical significant difference in the two
groups (p>0.05).
Conclusions: Diabetic patients with central obesity tend to have higher level of total cholesterol and triglyceride and lower level of HDL-C compared to diabetic patients without central obesity.
[AMJ.2016;3(4):570–6]
Keywords: Central obesity, diabetic women, lipid profile
Correspondence: Scholastica Diana Nurvitasari, Faculty of Medicine, Universitas Padjadjaran, Jalan Raya
Bandung-Sumedang Km.21, Jatinangor, Bandung-Sumedang, Indonesia, Phone: +628989807909 Email: scholasticadiana@gmail.com
Introduction
Diabetes Mellitus (DM) is a common metabolic disorder in the world which is associated with risk of cardiovascular disease especially in women.1 Based on International Diabetes Federation (IDF), there were approximately 366 million DM patients in 2011 and the number was predicted to increase years by years.2 Increasing number of type 2 DM is directly consistent with the increasing number of obesity. Obesity can be defined based on body mass index (BMI) and waist circumference (WC). Women patient with excessive WC (≥80 cm) can be classified as central obesity.3 Data from Indonesian Basic Health Research (Riset Kesehatan Dasar, RISKESDAS) 2007, reported that women had higher number of suffering central obesity
compared to men.4 Central obesity reflects higher risk of cardiovascular disease than BMI.5 There is a significant correlation between the accumulation adipocyte tissue with numerous abnormality of metabolism and lipid profile.5
study.
Methods
This study was an analytical study with cross-sectional design conducted in Dr. Hasan Sadikin General Hospital, Bandung Indonesia in 2013. Before its implementation, the aim and the way this study would be conducted had been approved by Health Research Ethics Committee Dr. Hasan Sadikin General Hospital, Bandung Indonesia (LB.02.01/ C02/9529/IX/2013). Data were obtained by consecutive sampling from medical records of Diabetic patients within the period of January 2010–January 2012. A total of 160 medical records consisting of eighty data of diabetic type-2 women patients were associated with central obesity and eighty data of non-central obese diabetic women were taken to assess their lipid profile. Plasma level of total cholesterol, triglyceride, High Density Lipoprotein–Cholesterol (HDL-C), and Low Density Lipoprotein–Cholesterol (LDL-C) were analyzed. It was decided that the inclusion criteria was newly diagnosed type 2 diabetic women patients with complete medical records consisting of the variables needed for this study.
The independent variable was waist circumference (WC) which can be measured from the midpoint between the lower tip of lowest ribs and highest part of iliac crest.5 These data also obtained from medical record. Patients who had WC of ≥80 cm were classified as central obesity and patients who had WC of <80 cm were classified as
non-central obesity.5 Exclusion criteria included pregnancy, receiving insulin treatment, heart failure, renal failure, and cirrhosis. This study used Asian cut–off of BMI value calculated as kilograms per meter square. The reference of serum lipid level was National Cholesterol Education Program (NCEP) Adult Treatment III (ATP III) guidelines. The population of the study was normal distribution based on Kolmogorov-Smirnov test. The t-test was used to compare means of variables. Due to certain consideration, p<0.05 was considered as statistically significant..
Results
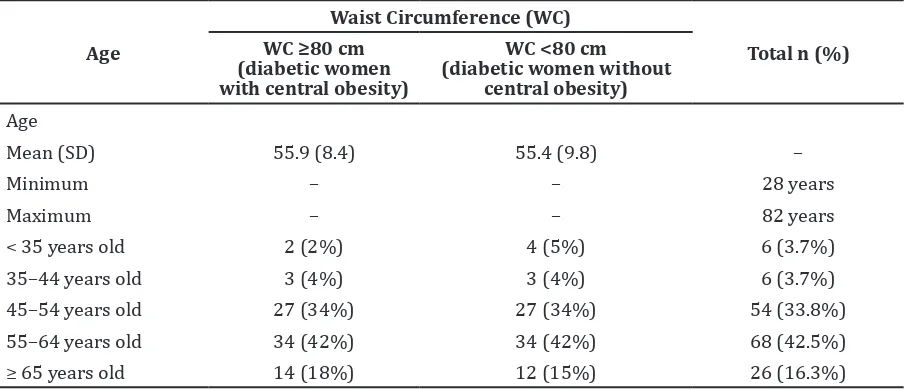
The most age group of being confirmed diabetes mellitus in both groups was 55–64 years group. It can be found that the highest proportion of central obese in central obese– diabetic women was also in the same level of age group. Results from this study showed that patient with central obesity tended to have higher BMI score than the patients without central obesity group (Table 1).
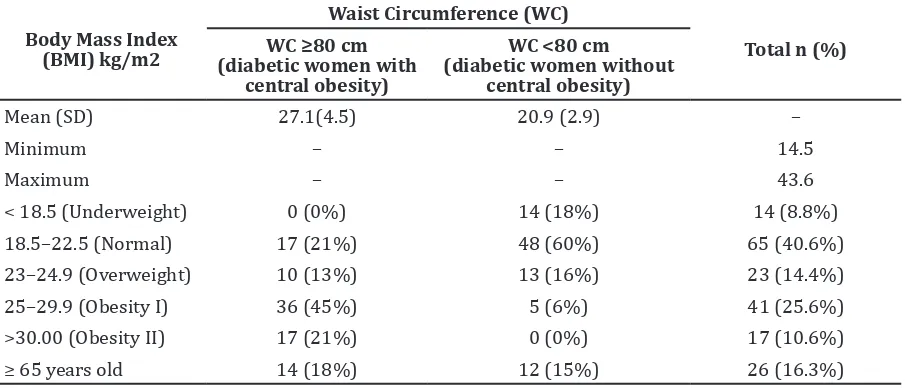
Frequency of obesity I in central obese patients was forty (50%) whereas obesity II was sixteen (20%) patients. In non-central obese diabetic group, it was found that more than 50% of them had normal BMI score. Only eighteen (22.5%) respondents of non-central obese diabetic who confirmed as overweight and obese I (Table 2).
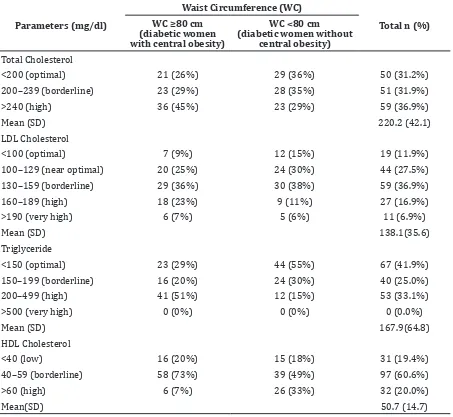
Results of this study showed that the mean of total cholesterol of the study subject was 220.2. This value could be classified as hypercholesteronemia (>200 mg/dl).
Table 1 Characteristic of Type 2 Diabetic Women Patients as the Study Subject
Age (diabetic women without
Frequency of high level of total cholesterol in diabetic with central obesity group was thirty-six (45%) patients while in diabetic without central obesity were only twenty-three (29%) patients. The mean of LDL-Cholesterol level of the study subject was in borderline level (138.1 mg/dl). Highest proportion of LDL-C level in both groups was in borderline level.
The mean of Triglyceride level of study subject was in borderline level (167.9 mg/dl). This value could be classified as hypertriglyceridemia (>150 mg/dl). Highest proportion of triglyceride level in diabetic with central obesity group was in high level meanwhile in diabetic without central obesity group was in optimal group. The HDL cholesterol of most respondents remained within normal value. There was only 19% of the study subject who had lower HDL-C level (Table 3).
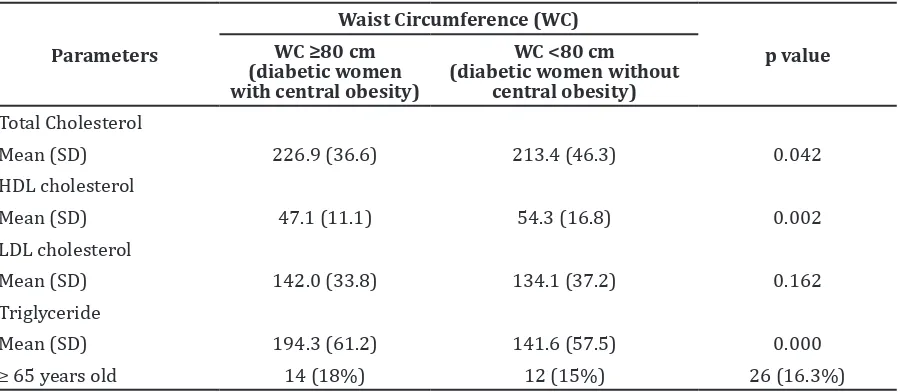
Diabetes mellitus type 2 with central obese patients when compared to type 2-diabetic without central obese subjects showed statistically significant increase in the levels of total cholesterol serum (p = 0.042) and triglyceride serum (p=0.000), while HDL-C serum showed significant increase in non-central obese type 2 diabetic patients (p=0.002). Serum LDL-C level did not show statistically significant difference in the two group (p=0.l62) (Table 4). A comparison of lipid profile of central-obese type 2 diabetic patients and non-central obese type 2 diabetic patients is represented in Figure 1.
Discussions
Based on the table of age distribution of
respondents, it can be found that the highest proportion of patient who had been confirmed DM was 55–64 years group. In central obesity group, the highest proportion also came from 55–64 years group. This result was relatively similar to the study by Hillier et al.9 that reported the greater frequency of being diagnosed type 2 DM were respondents within 56–65 years group (29%) compared to the respondents within 46–55 years group (27%). It’s likely because women within 55–64 years group were already in their menopause period. Estrogen deficiency in menopause women was associated with an increase in abdominal fat.10 Elevated fat accumulation in abdomen, especially visceral fat could lead to peripheral insulin resistant and further lead to DM.11 This finding was in contrast with the results from Basic Health Research/Riset Kesehatan Dasar (RISKESDAS) in 2007 that stated the highest proportion of patients who were classified as central obesity was patients in 45–54 years group.4
Most of the respondents who suffered DM were non-obese patients based on BMI classification. There were 102 (64%) study subjects whose BMI score were under 25. The study by Son et al.12 in Vietnam, and Yoon et al.13 in Korea also stated that most of the patients with type 2 DM in their country were not obese. Recent pathogenesis of type 2 DM found that abnormal insulin secretions might be because of changes in nature morphology of β-cells and β-cell loss in these diabetic patients are more prominent than insulin resistance.13 The DM had strong association with impaired of metabolism that caused abnormality of lipid and lipoprotein serum.14 Diabetic patients had
Table 2 Body Mass Index of Type 2 Diabetic Women Patients
Body Mass Index (BMI) kg/m2
Waist Circumference (WC)
Total n (%) WC ≥80 cm
(diabetic women with central obesity)
WC <80 cm (diabetic women without
central obesity)
Mean (SD) 27.1(4.5) 20.9 (2.9) –
Minimum – – 14.5
Maximum – – 43.6
< 18.5 (Underweight) 0 (0%) 14 (18%) 14 (8.8%)
18.5–22.5 (Normal) 17 (21%) 48 (60%) 65 (40.6%)
23–24.9 (Overweight) 10 (13%) 13 (16%) 23 (14.4%)
25–29.9 (Obesity I) 36 (45%) 5 (6%) 41 (25.6%)
>30.00 (Obesity II) 17 (21%) 0 (0%) 17 (10.6%)
higher risk of cardiovascular disease because of dyslipidemia than people without DM.15 The study by Yadav et al.16 in India showed that lipid profile of diabetic was worse than subject control. Triglyceride, total cholesterol and LDL-C was significantly higher in diabetic patients, leading to dyslipidemia.17 This study showed the mean of total cholesterol, triglyceride and LDL-C of the subjects were reflected as dyslipidemia. Another study by Mahantesh14 in Karnataka, India also stated that triglyceride, total cholesterol and LDL-C level were higher in diabetic patients while HDL-C was relatively higher in control.14
The triglyceride and total cholesterol were significantly higher in central-obese diabetic patients). Nieves et al.8 also found similar
result in their study that patients with the greater level of abdominal fat had higher total cholesterol, triglyceride, and LDL-C compared to patients who had the minimum abdominal fat (p<0.001). The HDL-C level was lower than the minimum abdominal fat group (p<0.001). In this study, HDL-C in central obese diabetic was also significantly lower than non-central obese diabetic group while LDL-C was higher in central-obese diabetic, but was not statistically significant.
The relation between central obesity and lipid profile may be explained by the uncommon character of abdominal adipocyte. Lipolytic exertion in abdominal adipocyte is different from the visceral and subcutaneous compartment.18 Lipolytic force in the omental
Table 3 Lipid Profile in Type 2 Diabetic Women Patients
Parameters (mg/dl)
Waist Circumference (WC)
Total n (%) WC ≥80 cm
(diabetic women with central obesity)
WC <80 cm (diabetic women without
central obesity)
Total Cholesterol
<200 (optimal) 21 (26%) 29 (36%) 50 (31.2%)
200–239 (borderline) 23 (29%) 28 (35%) 51 (31.9%)
>240 (high) 36 (45%) 23 (29%) 59 (36.9%)
Mean (SD) 220.2 (42.1)
LDL Cholesterol
<100 (optimal) 7 (9%) 12 (15%) 19 (11.9%)
100–129 (near optimal) 20 (25%) 24 (30%) 44 (27.5%)
130–159 (borderline) 29 (36%) 30 (38%) 59 (36.9%)
160–189 (high) 18 (23%) 9 (11%) 27 (16.9%)
>190 (very high) 6 (7%) 5 (6%) 11 (6.9%)
Mean (SD) 138.1(35.6)
Triglyceride
<150 (optimal) 23 (29%) 44 (55%) 67 (41.9%)
150–199 (borderline) 16 (20%) 24 (30%) 40 (25.0%)
200–499 (high) 41 (51%) 12 (15%) 53 (33.1%)
>500 (very high) 0 (0%) 0 (0%) 0 (0.0%)
Mean (SD) 167.9(64.8)
HDL Cholesterol
<40 (low) 16 (20%) 15 (18%) 31 (19.4%)
40–59 (borderline) 58 (73%) 39 (49%) 97 (60.6%)
>60 (high) 6 (7%) 26 (33%) 32 (20.0%)
(visceral fat) is more active than in the subcutaneous depot in women because these visceral fats are more sensitive to β-adrenergic agonist incitement and less to insulin overriding. Therefore the more free faty acids (FFA) is released directly into liver.18 High level of Interleukin-6 which is generated by visceral fat also plays role in releasing FFA into liver by increasing sensitiveness of β-adrenergic-dependent lipolysis. The further effect of those process is hypertriglyceridemia state among central obese patients.18 This explanation
is related to the result of the study that triglyceride and total cholesterol in central obese-diabetic women were significantly higher than non-central obese-diabetic group. This study was in agreement with the study conducted in Pakistan stating that the mean of total cholesterol in obese (BMI>30, waist to hip ratio–WHR>0.85 in women, WC>88cm in women) women respondents were higher than non-obese (BMI<25, WHR<0.85 in women, WC<88 cm in women) women subjects. The mean of triglyceride was also higher in
obese-Figure 1 Comparison of Lipid Profile between Type 2 Diabetic Women with Central Obesity and Type 2 Diabetic Women without Central Obesity
Table 4 Statistical Test of Mean Differences of Lipid Profile of Diabetic Type 2 Women with Central Obesity and without Central Obesity
Parameters
Waist Circumference (WC)
p value WC ≥80 cm
(diabetic women with central obesity)
WC <80 cm
(diabetic women without central obesity)
Total Cholesterol
Mean (SD) 226.9 (36.6) 213.4 (46.3) 0.042
HDL cholesterol
Mean (SD) 47.1 (11.1) 54.3 (16.8) 0.002
LDL cholesterol
Mean (SD) 142.0 (33.8) 134.1 (37.2) 0.162
Triglyceride
Mean (SD) 194.3 (61.2) 141.6 (57.5) 0.000
women subject.19
According to this study, HDL-C level in central obese-diabetic patients were significantly lower than in non-central obese-diabetic patients. This result was in consistent with the study by Nieves et al.8 that stated HDL-C level of patient who had greater abdominal fat were lower than patient who had fewer abdominal fat. A study conducted by Shah19 also showed the similar pattern that obese women subjects had lower level of HDL-C compared to non-obese women subjects. Decreased HDL-C level in serum was associated with hypertriglyceride in central obesity. High concentration of triglyceride-rich lipoprotein caused elevated lipid carriage by cholesterol ester transfer protein (CETP) between VLDL particles and LDL as well as HDL particles. Then drained of HDL particles appearingin cholesterol ester and triglyceride was dominant.18 Numerous VLDL and HDL-accomodating triglyceride are hydrolyzed by hepatic lipase enzyme which elevates in plasma. Products of those process are small dense LDL and HDL particle and as chain reaction, reduced HDL2 sub fraction is found in patients.18
The LDL-C level between both groups did not show significant difference. This finding was in contrast with the study by Nieves et al.8 that showed LDL-C level of patients who had higher number of abdominal fat was significantly increased, compared to patients who had fewer number of abdominal fat (p<0.001). It is likely because this study could not identify the hsitory of dryg consumption from the medical record of the patients. Consumption of statin in previous treatment could be bias to the level of LDL patients. Another limitation of this study was the subject may have suffered another disease that affected the result of lipid profile. However, this condition was not recorded.
In conclusion, diabetic women patients with central obesity tend to have higher total cholesterol level, higher triglyceride level and lower HDL-C level compared to non-central obese subject. Prolonged abnormal lipid metabolism in central-obese diabetic patients could lead into serious complication of DM especially cardiovascular mortality. Health dietary food and adequate physical activity can prevent those complication and also improve insulin sensitivity of the patients.18
References
1. Hu G. Gender difference in all-cause and cardiovascular mortality related to
hyperglycaemia and newly-diagnosed diabetes. Diabetologia. 2003;46(5):608– 17.
2. Whiting DR, Guariguata L, Weil C, Shaw J. IDF diabetes atlas: global estimates of the prevalence of diabetes for 2011 and 2030. Diabetes Res Clin Pract. 2011;94(3):311– 21.
3. Alberti K, Zimmet P, Shaw J. Metabolic syndrome-a new world-wide definition. A consensus statement from the international diabetes federation. Diabet Med. 2006;23(5):469–80.
4. Badan Penelitian dan Pengembangan Kesehatan. Laporan hasil riset kesehatan dasar ( Riskesdas ) Indonesia Tahun 2007. Jakarta: Badan Penelitian dan Pengembangan Kesehatan Departemen Kesehatan Republik Indonesia; 2008.
5. World Health Organization. Waist circumference and waist-hip ratio: report of a WHO expert consultation. Geneva: World Health Organization (WHO). 2008. 6. Balkau B, Deanfield JE, Després JP, Bassand
JP, Fox KA, Smith Jr SC, et al. International day for the evaluation of abdominal obesity (IDEA). Circulation. 2007;116(17):1942– 51.
7. Krauss RM. Lipids and lipoproteins in patients with type 2 diabetes. Diabetes Care. 2004;27(6):1496–504.
8. Nieves DJ, Cnop M, Retzlaff B, Walden CE, Brunzell JD, Knopp RH, et al. The atherogenic lipoprotein profile associated with obesity and insulin resistance is largely attributable to intra-abdominal fat. Diabetes. 2003;52(1):172–9.
9. Hillier TA, Pedula KL. Characteristics of an adult population with newly diagnosed type 2 diabetes the relation of obesity and age of onset. Diabetes Care. 2001;24(9):1522–7.
10. Carr MC, Brunzell JD. Abdominal obesity and dyslipidemia in the metabolic syndrome: importance of type 2 diabetes and familial combined hyperlipidemia in coronary artery disease risk. J Clin Endocrinol Metab. 2004;89(6):2601–7. 11. Grundy SM, Cleeman JI, Daniels SR,
Donato KA, Eckel RH, Franklin BA, et al. Diagnosis and management of the metabolic syndrome: an american heart association/national heart, lung, and blood institute scientific statement. Circulation. 2005;112(17):2735–52.
BMI but high body fat. Diabetes Care. 2003;26(6):1946–7.
13. Yoon KH, Ko SH, Cho JH, Lee JM, Ahn YB, Song KH, et al. Selective β-cell loss and α-cell expansion in patients with type 2 diabetes mellitus in Korea. J Clin Endocrinol Metab. 2003;88(5):2300–8.
14. Mahantesh GP. Lipid profile in diabetes mellitus [dissertation]. Bangalore: Adichunchanagiri Institute of Medical Sciences; 2010.
15. Sultana R. Impact of duration of type 2 diabetes mellitus on lipid profile. Gomal J Med Sci. 2010;8(1):57–9.
16. Yadav N, Thanpari C, Shrewastwa M, Mittal R. Comparison of lipid profile in type-2 obese diabetics and obese non-diabetic
individuals: a hospital based study from Western Nepal. Kathmandu Univ Med J. 2012;10(39):44–7.
17. Samantha P, Venkateswarlu M, Siva PV. Lipid profile levels in type-2 diabetes mellitus from tribal population of Adilabad in Andhra Pradesh, India. J Clin Diagn Res. 2012;6(4):590–2.
18. Kopelman PG, Caterson ID, Dietz WH. Clinical obesity in adults and children. 3rd ed. London: Wiley; 2009.