ISSN 0024-9521
IJG Vol. 45, No.2, December 2013 (187 - 204) © 2013 Faculty of Geography UGM and The Indonesian Geographers Association
UTILIZATION OF GEOTAGGED PHOTOGRAPH, REMOTE
SENSING, AND GIS FOR POST-DISASTER DAMAGE
ASSESSMENT
Sapta Nugraha spta_bpnjateng
Badan Pertanahan Nasional, Provinsi Jawa Tengah
Michiel Damen [email protected].
Faculty of Geo-information and Earth Observastion, University of Twente
ABSTRACT
Merapi eruption in 2010 causing major damage impact on that region. Post-disaster damage assessment that has been done by the government have not been supported with a good spatial data so that validation is relatively weak. Method of post-disaster damage assessment, particularly assessment of building damage using geotagged photos, remote sensing and GIS is expected to improve the method of damage assessment by the government of Indonesia. Geojot Applications for Android Smartphone/Tablet allows the assessment of building damage to be included in the photo attribute. Interpretation of satellite imagery of building damage is done by using three indications: building visibility, building collapse, and building roof. Geotagged photograph can complement the needs of building damage assessment from satellite images because it can describe the structural and non-structural damage to buildings clearly. Geotagged photograph with GPS Lock-Off mode requiring information on the direction and distance of the object being photographed. Geotagged photograph with the QR code is the most profitable because the identity of the building is already known and can be matched with an existing database.
Keywords : geotagged photograph, damage assessment, remote sensing, GIS
ABSTRAK
Erupsi Merapi 2010 mengakibatkan dampak yang besar pada wilayah di sekitarnya. Meskipun demikian, pendugaan dampak pasca bencana yang telah dilaksanakan pemerintah tidak didukung oleh ketersediaan data spasial yang baik sehingga validasi yang dilakukan memiliki konfidensi yang rendah. Metode pendugaan dampak pasca bencana, terutama kerusakan bangunan menggunakan foto geotagging, penginderaan jauh, dan sistem informasi geografis (SIG) diharapkan mampu meningkatkan pendugaan dampak yang dilakukan oleh pemerintah. Aplikasi Geojot pada Smartphone/Tablet berbasis Android dapat digunakan dalam pendugaan dampak, yang dapat dimasukkan dalam atribut foto. Interpretasi citea satelit untuk pendugaan kerusakan bangunan dilakukan melalui tiga indikator, meliputi; visibilitas bangunan, runtuhan bangunan, dan atap bangunan. Foto geotagging dapat digunakan untuk melengkapi pendugaan kerusakan bangunan dari citra satelit karena dapat digunakan untuk mendeskripsikan bangunan, baik kerusakan secara struktural maupun non-struktural. Foto geotagging dengan mode GPS Lock-off digunakan untuk memperoleh informasi mengenai arah dan jarak dari objek pada foto. Foto geotagging dengan QR code sangat bermanfaat untuk merekam identitas bangunan untuk dicocokkan dengan data yang tersimpan pada database.
Kata kunci: foto geotagging, pendugaan dampak, penginderaan jauh, GIS
INTRODUCTION
Cangkringan sub-district, Sleman, Yogya-karta is one of the region severely affected by the eruption of Merapi volcano in 2010. Based on BNPB data, Sleman district suffered heavy damage in Cangkringan and Ngemplak with the number of heavy
Indonesian Journal of Geography, Vol 45, No.2, December 2013 : 186 - 204
188 area was greatly affected by the eruption of Merapi Volcano in 2010.
In 2011, Indonesian government issued a regulation of BNPB Nr. 15/2011 as a standard guideline for post-disaster asse-ssment. Based on this regulation, there are standards for the assessment of damage due to disasters. There are no more spe-cific instructions for the type of volcanic disaster. Based on the criteria used, remote sensing can not fulfill all the required data for the assessment of damages due to the disaster. Post-disaster damage assessment in Indonesia conducted by disaster ma-nagement agency of Indonesia. Impro-vements to the method that has been used by disaster management agency of Indo-nesia is very necessary to improve the results obtained.
The aim of this research is to develop and to test method for volcanic post-disaster damage assessment from geotagged gro-und photograph in combination with re-mote sensing and GIS in Indonesia, espe-cially for building damage assessment. The development of geotagged photograph and Geographic Information System can make more possibilities for utilization in disaster management. According to Welsh et. al., [2012], “geotagging is easy to undertake and is potentially cost effecti-ve”. Geotagged photos can be generated directly through the GPS equipment and digital cameras [Yaegashi et. al., 2009]. With the current technological deve-lopments, the smartphone is also equipped with geotagging facility. The use of smart-phone allows to use of certain applications for geotagging.
One of the applications on the Android-based smartphone for geotagging is GeoJot that produces geotag photos with GPS coordinates and can be used also to add the attribute data associated with geotag
pho-tos such as name, condition, value, etc [Geospatial Experts, 2012]. This allows the interpretation of geotag photos for post-disaster damage assessment purpose. Photograph of the entire building and the details that are taken will be useful as data for verification and analysis of matters that are not included in the list of field survey format [Crandell et. al, 2005]. 3D photo-graph may have a role in post-disaster damage assessment. Tsai et. al. [2011] explain that a photographer who is on site observations can generate 3D anaglyph photograph by photographing the object from different angles. He explained that the main difference of the images of 3D and 2D is a 3D anaglyph photograph can “provide a greater field depth contrast, the distances are extremely realistic, and the disaster sites (under 1 km2) can be better observed”. He stressed also that by using 3D anaglyph photographs, photos user is not necessary to be at the location of the photo to see the site conditions.
THE METHODS
UTILIZATION OF GEODATAGGED PHOTOGRAPH Sapta Nugraha, Michiel Damen
189
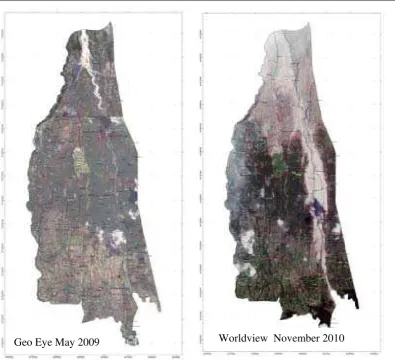
Figure 1. Satellite Imagery of Cangkringan Sub-District Before and After Merapi Eruption 2010
Secondary maps and data are used as ini-tial data for this research in the form of administrative map, hazard map, and tograph. Secondary data of geotagged pho-tographs that related to the research purpo-se will be upurpo-sed to obtain preliminary in-formation on the impact of disasters re-corded in the study area.
Landcover map is produced from visual interpretation of multitemporal high reso-lution imagery. Further, multitemporal landcover map can analyze kinds of land-cover that has been changed. Damage in-formation from selected object can be obtained from high resolution imagery according to damage criteria. Disaster affected areas can be identified from the analysis of changes in land cover and condition of the objects visually seen from
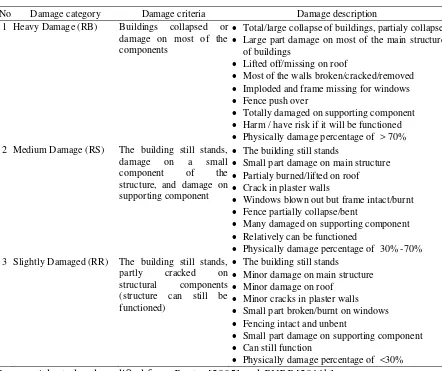
the imagery. Disaster affected area map, landcover map with damage information and others map then used as the basis for sampling in the field. Sampling technique that will be used is purposive sampling. Building damage isthe focust element in this research. Area that is affected by di-saster will be used as sampling location. Damages on building is the focus in this research. The building damage criteria we-re adopted and modified from Baxter [2005] and BNPB [2011b]. This analysis is conducted to adjust the type of disaster damage to volcanic and general criteria used by the government of Indonesia. The criteria of building damage due to pyroclastic flows/surges are shown in the Table 1.
Indonesian Journal of Geography, Vol 45, No.2, December 2013 : 186 - 204
190
Table 1. Criteria for Building Damage
No Damage category Damage criteria Damage description
1 Heavy Damage (RB) Buildings collapsed or
damage on most of the components
Total/large collapse of buildings, partialy collapse
Large part damage on most of the main structure
of buildings
Lifted off/missing on roof
Most of the walls broken/cracked/removed
Imploded and frame missing for windows
Fence push over
Totally damaged on supporting component
Harm / have risk if it will be functioned Physically damage percentage of > 70%
2 Medium Damage (RS) The building still stands,
damage on a small component of the structure, and damage on supporting component
The building still stands
Small part damage on main structure
Partialy burned/lifted on roof Crack in plaster walls
Windows blown out but frame intact/burnt
Fence partially collapse/bent
Many damaged on supporting component
Relatively can be functioned
Physically damage percentage of 30% -70%
3 Slightly Damaged (RR) The building still stands, partly cracked on structural components (structure can still be functioned)
The building still stands
Minor damage on main structure
Minor damage on roof
Minor cracks in plaster walls
Small part broken/burnt on windows
Fencing intact and unbent
Small part damage on supporting component
Can still function
Physically damage percentage of <30%
Source: Adopted and modified from Baxter [2005] and BNPB [2011b] QR code (Quick Response Code) for
identification of the building using Geojot combine with QR code scanner software for Android is designed as a scenario for combination of spatial data from satellite image interpretation and attribute of geotagged photos (Figure 2). QR code is designed with a format like this fromat below:
Sub-district name\Village name\Sub-Village name\Building owner\Building Identity Number
Example :
Cangkringan\Argomulyo\Bakalan\Sosro Supriyono\19
UTILIZAT with la characte a disast screen imagery delineat Merapi into six compac te surfa broadle broadle Cangkr Ha (65 (buildin of 256.4
TION OF GEODA
re2. QR Cod Iden
LT AND DI
ge Interpr tion Satelli
cation of al satellite i g for areas . Image befo
useful for and cover eristics is o ter that hap
visual inte y using Ar te land cov volcanic d x classes, n cted clay su ace, non-wo eaves and eaves domin ingan sub-d 5.25 %). C ng) has a r
42 Ha (5.6 %
Figure 3.
ATAGGED PHO
de Sample f ntification
ISCUSSIO
retation u ite Imagery
damage imagery is c s that have fore and afte r this purpo
changes ne possible ppened in th
erpretation rcGIS can ver. Land disaster 201
namely bar urface (build oody broadle water bod nate the land district of a Compacted
elatively la %).
Distance V
OTOGRAPH
for Building
ON
using Hig y
from mul conducted b e land cov er the disast ose. An ar
with certa indication hat area. O on a digit be done cover befo 10 is divid re soil (dry ding), concr
eaves, wood dies. Wood d cover in th about 2983.6 clay surfa arge coverag
Variation Sce
enario of 2D
nterpretation olcanic disa ypes such a uilding), bu lay surface on-woody b woody broad oil covers 1 imilar with ry soil is th illages clos illages are Umbulharjo. Overlay ana efore and ruption by rea affected andcover ch
istrict are co are soil (dr are soil (d ecame ba roadleaves woody broad
nd woody egetation (F rea changed s the area woody broad nd 9.57 % her major ch
on woody are soil (9.1 lso experien and cover t %).
D and 3D G
Sap
n of land c aster 2010 p as bar dry s urned vege (building) broadleaves dleaves. La 1564.72 Ha woody broa he most ext
est to the p Glagaharj
alysis of the after the using GIS d by the dis hanges in ompacted c ry), concre dry), non-w are soil ( became b dleaves bec
broadleave Figure 4; Ta d after the
with the ty dleaves (77.
into burned hange is the broadleave 13 %). Com nced consid that turns in
Geotagged P
pta Nugraha, Mic
cover after produces lan soil (interle
etation, com , concrete s, water bod andcover of a (34.22 %)
adleaves ar tensive in th
eak of Mer o, Kepuha
e land cove Merapi v To determ saster. The
Cangkring clay surface ete surface woody broa (dry), non burned veg ame bare so es became able 2). Mo
eruption of ype of lan .71 % into b d vegetation e landcover
s that turn mpacted clay
derable cha nto bare so
Photograph
chiel Damen
Merapi nd cover aved by mpacted
surface, dies and volcanic mine the
types of an
Indonesian Journal of Geography, Vol 45, No.2, December 2013 : 186 - 204
192
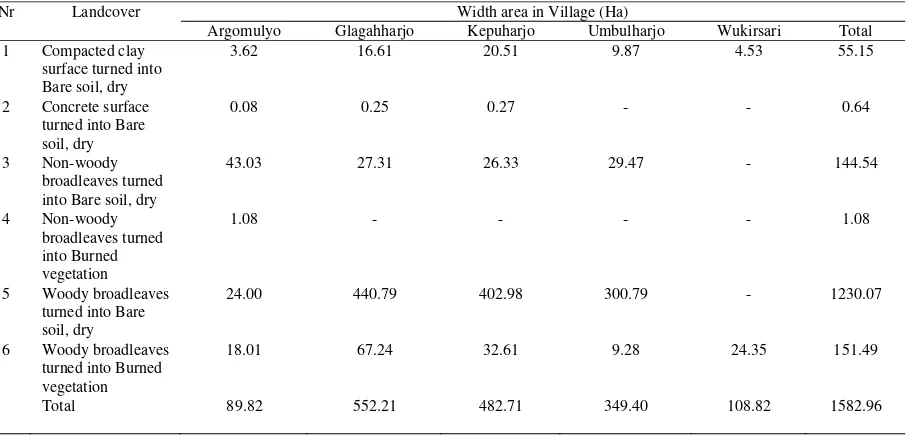
Figure 4. Landcover Changes Map after Merapi volcanic disaster 2010 Table 2. Landcover changes area after Merapi volcanic disaster 2010
Nr Landcover Width area in Village (Ha)
Argomulyo Glagahharjo Kepuharjo Umbulharjo Wukirsari Total
1 Compacted clay surface turned into Bare soil, dry
3.62 16.61 20.51 9.87 4.53 55.15
2 Concrete surface turned into Bare soil, dry
0.08 0.25 0.27 - - 0.64
3 Non-woody broadleaves turned into Bare soil, dry
43.03 27.31 26.33 29.47 - 144.54
4 Non-woody broadleaves turned into Burned vegetation
1.08 - - - - 1.08
5 Woody broadleaves turned into Bare soil, dry
24.00 440.79 402.98 300.79 - 1230.07
6 Woody broadleaves turned into Burned vegetation
18.01 67.24 32.61 9.28 24.35 151.49
Total 89.82 552.21 482.71 349.40 108.82 1582.96
UTILIZATION OF GEODATAGGED PHOTOGRAPH Sapta Nugraha, Michiel Damen
193 There are 3 types of hazards that can be analyzed in the event Merapi eruption in 2010, these types are pyroclastic flows, pyroclastic surges and lahars. Settlement widely affected by pyroclastic surges are situated in the Glagaharjo, Umbulharjo and Kepuharjo village respectively 11 Ha, 9.21 Ha, and 7.67 Ha, while the largest area of settlement affected by pyroclastic flows is located in the Glagaharjo and Ke-puharjo village respectively 12 Ha and 5.22 Ha. Settlement for the widest area affected by lahars is located in the Argomulyo village with total area of 1.44 Ha.
Interpretation of the damage is focused on damage to building. Interpretation of bu-ilding damage from high-resolution sate-llite imagery is done by using the criteria from Ogawa [2000] that has been mo-dified. Three criteria are used namely building visibility, building collapse and building roof condition. Interpretation is done by using on screen visual interpre-tation in ArcGIS by overlaying building layer and satellite imagery after the 2010 eruption of Merapi. The buildings that vanish/not visible, totaly collapse, and lifted off/missing roof have the highest number of 938 units (58.37 %), while the smallest (0.37 %) is building with clearly visible/building still stands, no collapse and lifted off/missing roof (Table 3).
Damage Interpretation from geotagged photograph
Geotagged photos depict the condition of the photographed object. Interpretation of building damage based on these compo-nents on geotagged photos isfacilitated by using a device for geotagging photos call-ed Geojot. Geojot is an application for geotagging photos on the Android opera-ting system. This application gives the users flexibility to design their own attri-butes of the photos. In this case, the design attributes that made is the design attributes for damage assessment due to volcanic
disaster. Attributes of building damage to the main structural elements such as the foundation, columns, floor and beam is made into single point that is the main structure of the building.
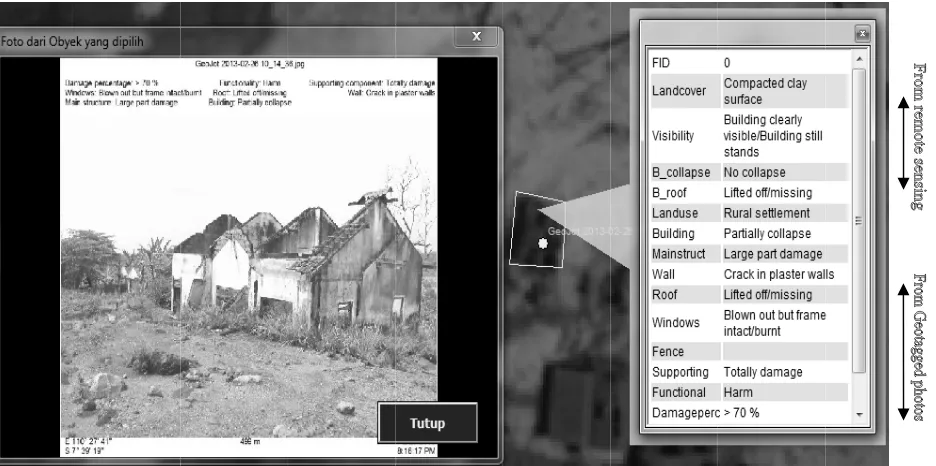
Figure 5 (left) is an example of the inte-rpretation of damage to buildings in the Bakalan sub-village, Argomulyo village, Cangkringan by using Geojot and GPS Photo Link application. Geojot is used to generate geotagged photograph and to fill the attributes of geotagged photograph, while the GPS Photo Link is used to create reports and spatial data based on pho-tographs from Geojot with attributes that have been filled. It can be seen that the large building collapse occurred, large part damage on main structure, most broken/ cracked/removed, partialy lifted on roof, blown out on windows but frame intact, totally damage on supporting component, and harm to be functionalized. Based on the above photo and the attributes, GPS Photo Link can be assembled into water-mark photo as report that shows the building damage attribute information. The geotagged photograph as shown in Figure 5 (right) was taken with GPS Lock-Off mode so that the coordinates listed are the coordinates of camera positions. Figures 290° WNW is the direction of the shooting (the camera towards the object to be photographed). GPS accuracy that can be obtained when shooting with geotagging Android devices are + 5-10 meters. Desired minimum accuracy limit for the GPS when photographing can be determi-ned on Geojot settings.
Combination of geotagged photograph attribute, interpretation from remotely sensed data by mean of GIS
selected coordin GPS Lo nate of nerate t photogr toward locked t rmore, nates of cam
ock-On opti f the object the coordina raphed, the the object the coordin all resultin Tab
uilding damag
ilding clearly v
ilding clearly v
ilding clearly v
ilding clearly v roof tile
ilding clearly v
ilding clearly v roof tile
ilding unclearl /missing nish/not visibl
al (Unit)
e: Data proc
re 5. Buildin
Indonesian Jo
ck-Off opt mera positio
ion can prod t photograp ates of the o photograph to be photo nate of the ob
g photos ha ble 3. Build
ge from high r
ly visible/buil
le, Totally col
cessing, 20
ng damage i
ournal of Geogra
ion produc on, while th duces coord phed. To g
object that b her should b ographed an bject. Furth ave the sam ding damage
resolution sate Buillding colla
ng still stands
ng still stands
ng still stands
ng still stands
ng still stands
ng still stands
lding can still
appse. Lifted
13
interpretatio Geojot to G
aphy, Vol 45, No
e interpretat
ellite imagery apse, Building
s, No collapse
s, No collapse
s, No collapse
s, No collapse
s, No collapse
s, No collapse
be identified,
off/missing
on in Geojo GPS Photo L
.2, December 20
oordinate th hotographed hods to be agged photo ults of ima ged photos GPS Lock-O
ario.
tion from sa
interpretation g Roof)
, Lifted off/m
, Minor dama
, No damage o
, Partialy lifte
, Lifted off/ m
, Partialy lifte
Totally colap
t (left) and Link (right)
013 : 186 - 204
hat is the d object. T applied fo os and attri agery interp with GPS On scenario
atellite imag
n (Building Vi
missing
age on roof tile
on roof
ed off or major
missing
ed off or major
ppse, Lifted
its interpret .
coordinates There are th or combinin
ibutes with pretation, ie
Lock-Off s and QR Co
gery
isibility,
e
r damage
r damage
tation repor
s of the hree
me-ng geo-h tgeo-he re-e gre-eota- geota-scenario,
ode
UTILIZATION OF GEODATAGGED PHOTOGRAPH Sapta Nugraha, Michiel Damen
195
GPS Lock-Off scenario
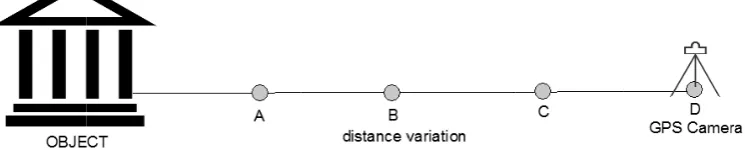
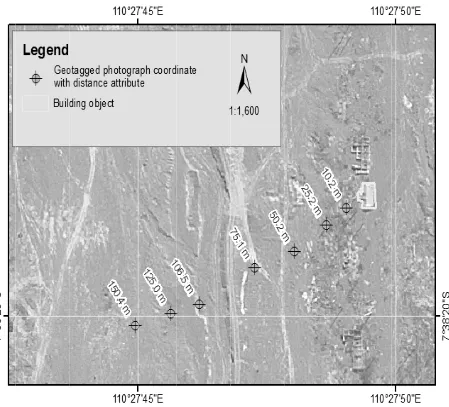
In this scenario, shooting direction becomes a very important factor for the combination with spatial data from remote sensing imagery. With an Android device that has an electronic compass and Geojot software, shooting direction can be re-corded on the attributes of the photo. Distance data between the camera and the object being photographed is also impor-tant. Relatively accurate distance measu-rements can be performed using a laser distance meter. In this study, Laser Ace 300 is used to calculate distance between camera and the object being photographed which can measure distances up to 300 meters.
If there is no distance information, the di-rection of the shooting information and camera position is used as the basis for determining which objects are photogra-phed on remote sensing imagery. By the direction and distance information, pann-ing (offset) camera coordinates into object coordinates can be done. Right or not the result of the coordinates shifting will be affected by the GPS accuracy when shoot-ing and the accuracy of distance measure-ment to the object.
The offset distance variation to determine the position of the object that has been photographed (Figure 6). From the above results can be analyzed that the greater of the shooting distance (for the same GPS accuracy), the offset becomes less accu-rate. That is because the precision of sho-oting direction became very influential. Change of a few degrees over long dista-nces will cause the offset position shifted further and further.
The incorporation of spatial data structure in which contained the interpretation re-sults and damage attribute to buildings from geotagged photos can be done by us-ing spatial join technique if the photos coordinate is in the building objects. If the
results of offset are not in the building boundary, then the provision of common identity between building objects and the point location of the photo on the attribute is another way that can be done to ne attributes. The result of attribute combi-nation is shown in Figure 7.
GPS Lock-On Scenario
The second scenario is to lock the nates of geotagged photos with the coordi-nates of the object to be photographed on Geojot. Photographer came to the location of the object photographed building and wait until the GPS accuracy reaches a ma-ximum. This method will produce pho-tographs with the same coordinates. The downside of this method is the photogra-pher may not be able to enter the building at the building that can not be approa-ched/entered because of certain conditions. The results shown in the Figure 8.
QR Code Scenario
Figu
Data co damage with a Q the attr directly through By usin recorde modera
Figur
ure 7. Comb
ollection and e using geot
QR Code is ribute of ph y with the h a join op ng QR Cod ed is buildi ate level
Indonesian Jo
re 6. Offset
bined geotag
d assessmen tagged phot s very benef hotos can spatial data peration tab de, building ing that ha of damage
ournal of Geogra
position re
gged photog using GIS nt of buildin
tos combin ficial becau be combin a of buildin ble with GI g that will b
as slighty e or heav
aphy, Vol 45, No
196 sult from di
graph attribu S (spatial joi
ng ed use ed ng IS. be to vy
da th st af ta bu no ca no
.2, December 20
ifferent vari
ute and ima in process) amage by th he building till there. If ffected area able of geo
uilding spat ot recorded an be ident ot registere
013 : 186 - 204
iation of dis
agery interpr
he conditio that is atta f the bound a are known otagged ph tial data, th d using QR tified. The ed can be
stance
retation attr
n of the rem ached QR dary of the n, based on hotos attrib he building t R Code in t
buildings assumed
ribute
mains of Code is
UTILIZAT
heavy/ building Code modera QR Co sub-vill ngan su Bakalan eruption building total n
Fig
TION OF GEODA
total dama g damage d
is a build ate damage. ode test con
lage, Argom ub-district. n sub-vil n 2010 ca g unit as sh number of
gure 8. Com
Figure 9.
ATAGGED PHO
ge. Thus th data collect
ding with
nducted in mulyo villa
Building o lage befo an be map
hown in Fi buildings
mbination of
. QR Code s
OTOGRAPH
he priority tion with Q
slightly
the Bakal age, Cangkr
object in th ore Mera pped into 6
gure 10. Th before th
f geotagged by GPS
scenario on
197 of QR to
an ri-he api 62 he he
di C af L of be a no bu co de
d photograph S Lock-On s
building an
isaster and Code Scenar
fter Merap Lock-Off or
f buildings e recorded
45 unit bui ot be record uildings w ondition o estroyed.
h attribute a scenario
nd the ‘read
Sap
then surve rio with Ge pi eruption
GPS Lock with a QR is 17 buildi ilding with a
ded can be were heavy
of buried
and imagery
d and entry’
pta Nugraha, Mic
eyed by us eojot for co 2010 (wi k-On). The
Code that ing unit. Th a QR Code assumed th damaged d or com
y interpretat
in Geojot
chiel Damen
sing QR onditions th GPS number can still he rest is that can hat these by the mpletely
Not all conditio because mining eruption result o sensing tagged join op mage le based o are us building sub-dist damage in Figur Each ty flows, cause d slightly heavy [2005]
l buildings ons on the e the proces
(field wor n of Merapi of building g imagery
photograph peration in evel assesse on the build sed. Spatia g damage l trict and th ed by the ty
re 11. ype of dis
pyroclastic different lev y damaged, damaged. who asses
Indonesian Jo
Figure 10. B
were sam ground is a ss of recon rk is 2 ye i in 2010). I g damage
is combine h attributes ArcGIS. ed by perfor ding damage
al distribut evel in the he number ypes of haza
saster eithe surges an vels of dam
moderate d According s the dyna
ournal of Geogra
Building da
mpled due a lot differe nstruction an ears after th Interpretatio from remo ed with ge by using th Building d rming a que e criteria th tion of th
Cangkring of buildin ard are show
er pyroclast nd lahars c
mage that a damaged an g to Baxt amic pressu
aphy, Vol 45, No
198 amage level
to
in Bakalan
xperienced yroclastic D y damage ndergo dyn he modera uildings tha f 2-6 kPa a re building ressure of 1 l., [2013] w he estimate ienced by t lopes of M sure experi rom 0-15 k
reas closer t This is in ac he buildings ocation clo Kepuharjo a most heavy d
ound.
013 : 187 - 204
n sub-village
by the Density Cur
buildings namic pressu
ate damag at undergo and slightly g experienc 1-3 kPa. Ba who made t
ed dynami the building Merapi volc
ienced by kPa where to the peak ccordance w
s in the vill sest to the and Glagaha damaged bu e
building rrents (PDC
are buildin ure > 4 kP ed buildin
dynamic p y damage b
ced with d ased on Jen the contour ic pressure gs on the s ano, dynam
buildings the highe
of Merapi v with the pos lages, in wh e peak of arjo village) uildings tha
due to Cs),
hea-ngs that a, while ngs are
pressure buildings dynamic nkins et.
map of e expe-southern mic
pre-ranging er value
UTILIZATION OF GEODATAGGED PHOTOGRAPH Sapta Nugraha, Michiel Damen
199
Figure 11. Building damage level for sampled buildings in Cangkringan sub-district.
Comparation of 2D and 3D Geotagged Photograph
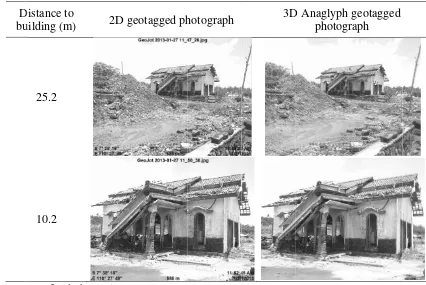
Comparison between 2D and 3D geotagged photos is conducted by testing for a variety of distances to the object of the assessed building damage. In this case, it is done by comparing the level of clarity of property damage that can be recorded from 2D and 3D photos. Measuring the
geotagg seven v 125 m, and 10. Compar rance 2 picting variatio Figure glyph g
ged photo ph Maker t 3D glasses ance of an
ns. The dis o to the bu d in the G variations of
106.5 m, 7 2 m (Figure rison of vi 2D and 3D
damage t ons in the
25. Based geotagged p
Figure
Indonesian Jo
ograph tr that can be to observ n object i tribution of uilding obj Glagaharjo f distance, f 75.1 m, 50 e 12; Table isual appea D geotagged
to building distance on the figu photograph
12. Distribu
ournal of Geogra
reated wi observed b ve the visu
in three d f the distan ject that w village wi from 150.4 m
.2 m, 25.2 4).
arance appe d photos d gs based o
is shown ure, 3D An can illustra
ution of geo
aphy, Vol 45, No
otagged pho
.2, December 20
more clearly amage to olumn stru ide and sev he other pol n addition, nd the wind learly with D geotagg istance fro eotagged p e photograp imensional tructure so bservations ccurs.
otograph for
013 : 187 - 204
y of buildin structures ucture that
ere crackin le as shown
the damag dows is ver 3D Anaglyp ged photog om the sho photograph
phed, then th effects o it can
of build
r distance v
ng damages in the for
collapsed g in the col n by yellow ge to the ro ry visible an ph photogra graph. The
ooting posi with the o he more ob of the b make the ding dama
ariation
vious 3-building
UTILIZAT
D bu
TION OF GEODA
Ta
Distance to uilding (m)
150.4
125
106.5
75.1
50.2
ATAGGED PHO
able 4. 2D a based on
2D ge
OTOGRAPH
and 3D geot n distance v eotagged ph
201 agged photo variation on hotograph
ograph visu n Building s
3D
Sap
ual comparis ample 3. D Anaglyph
photogr
pta Nugraha, Mic
son
geotagged raph
D bu
Sou
CONC
To perf photogr be done photogr geotagg GPS Lo applied tial. Th geotagg Code fo can be error, a data of interpre ing/join The use tter tha in term that oc damage that is tagged
Table
Distance to uilding (m)
25.2
10.2
urce: field ob
LUSION A
form a com raph, remot e with three raph shoot ged photogr
ock-On and and the ac he most m ged photogr or identifica done quic and the inco
f high-reso etation is ea ning tables w
e of 3D geot an using 2D ms of the cla
ccurred, pa e. The close
photograph photograph
Indonesian Jo
4 (cont.). 2 based o
2D ge
bsevation, 2
AND RECO
mbination o te sensing e methods ting in th raph with GP d QR Code. ccuracy of G minimal erro
raph combi ation of the ckly, havin
orporation o lution sate asy to do w with GIS.
tagged phot D geotagged
arity of buil articularly f er distance hed, it can p h with the m
ournal of Geogra
2D and 3D g on distance v
eotagged ph
2013
OMMENDA
of geotagg and GIS c of geotagg he field, GPS Lock-O
Each can b GPS is esse or method ined with Q building th g the lowe of the spati llite image with combi
tograph is b d photograp lding damag for structur
to the obje produce ge more obvio
aphy, Vol 45, No
202 geotagged p
variation on
hotograph
ATION
photograph v n Building s
3D
ffect of thre f the damag Maps of land
cale and bu uilding own he data is no ian governm ases, remote pdating dat ssessment p urrent cond or data colle an be read b e of post-dis
ACKNOWL
Thank to Mu omments a esearch and
onstructive
013 : 187 - 204
visual comp sample 3 D Anaglyph
photogr
ee-dimensio ge observed
d cover and uilding spat
ner needs to ot yet availa ment. By h e sensing im a so that po process cou dition. QR
ection of bu by the surve saster dama
LEDGEME
uh Aris Mar and his su
d thanks t comments.
parison
geotagged raph
onal and the d.
d land use o tial data in o be made able by the having thes magery can ost-disaster uld be fast Code can uilding iden eyors for the age assessm
ENT
rfai for the v upport dur to review
e clearer
on detail level of because Indone-se data-serve as damage ter than
be used ntity that
e purpo-ment.
valuable ring the
UTILIZATION OF GEODATAGGED PHOTOGRAPH Sapta Nugraha, Michiel Damen
203
REFERENCES
Baxter, P. J., Boyle, R., Cole, P., Neri, A., Spence, R., and Zuccaro, G. (2005), The impacts of pyroclastic surges on buildings at the eruption of the Soufrière Hills volcano, Montserrat, Bulletin of Volca-nology, 67 (4), 292-313. doi: 10.-1007/s00445-004-0365-7
BNPB (2008), Post-disaster Rehabilitation and Reconstruction, Legal Docu-ment of BNPB number 11/2008. BNPB (2011a), Merapi Volcanic Eruption
Reaching Impact IDR 4.23 Trillion. 17 January 2011, Retrieved from http://mis.bnpb.go.id/website/asp/b erita_list.asp?id=247. last accessed on 6 August 2012.
BNPB (2011b), Standard Guideline for Post-disaster Needs Assessment, Legal Document of BNPB number 15/2011.
Crandell, J., and Kochkin, V. (2005), Scientific damage assessment me-thodology and practical applica-tions, from http://cms.asce.org/- uploadedFiles/Communications- NEW/Hurricane/Scientific_Dama-ge_Assessment_Methodology_and _Practical_Applications.pdf.
Corbley, K. (2012), Mapping disasters with geo-tagged photos, 25 April 2012, Retrieved from http://ameri- cancityandcounty.com/gis-amp- gps/mapping-disasters-geo-tagged-photos.
Filippi, A. M. (2008), Remote Sensing-Ba-sed Damage Assessment for Home-land Security Geospatial Techno-logies and Homeland Security, In D. Z. Sui (Ed.), (Vol. 94, pp. 125-169): Springer, Netherlands.
Fontugne, R., Cho, K., Won, Y., & Fukuda, K. (2011), Disasters seen through Flickr cameras, Paper presented at the Proceedings of the Special Workshop on Internet and Disasters, Tokyo.
Francis, D. (2010), 3D Stereocope: Creating 3d Photographs Using A Single Camera Is Quite Simple, And We Show You How You Can Create Your Very Own 3D Ana-glyph Photos Using A Simple Utility, 25 May 2010, Retrieved from http://www.chip.in/article/-3D-STEREOSCOPE.html.last accessed on 3 August 2012.
Geospatial Experts (2012), GeoJot. Re-trieved from http://www.appszo- om.com/android_applications/pho-tography/geojot_cltgk.html. last a-ccessed on 16 July 2012.
Jenkins, S., Komorowski, J. C., Baxter, P. J., Spence, R., Picquout, A., Lavi-gne, F., and Surono, (2013), The Merapi 2010 eruption: An inter-disciplinary impact assessment methodology for studying pyro-clastic density current dynamics, Journal of Volcanology and Geo-thermal Research, doi: http://dx.-doi.org/10.1016/j.jvolgeores.2013. 02.012.
Ogawa, N., and Yamazaki, F. (2000), Photo-Interpretation Of Building Damage Due To Earthquakes Using Aerial Photographs, Re-trieved from http://ares.tu.chiba- u.jp/~papers/paper/WCEE/1906O-gawa.pdf. last acessed on 3 Fe-bruary 2013.
Indonesian Journal of Geography, Vol 45, No.2, December 2013 : 187 - 204
204 Enschede. Retrieved from http://-www.itc.nl/library/papers_2004/ms c/upla/derya_ozysik.pDF.
Rezaeian, M. (2010), Assessment of Earthquake Damages by Image-based Techniques, Institut für Geo-dasie und Photogrammetrie, Eidge-nossische Technische Hochschule Zürich.
Tsai, W., Chen, B., Chang, J., Lin, F., Chang, C., Sun, C., Su, W., Chen, M., Shih, D., Chen, C., Lin, S., and Yu, S. (2011), Application of Near Real-Time and Multiscale Three Dimensional Earth Observation Platforms in Disaster Prevention,
International Journal Of Auto-mation And Smart Technology, 1(2), 35-50. doi:10.5875/ausmt.-v1i2.124.
Welsh, K. E., France, D., Whalley, W. B., and Park, J. R. (2012), Geotagging photographs in student fieldwork, Journal of Geography in Higher Education. doi: 10.1080/030982-65.2011.647307.