IJG Vol. 47, No.1, June 2015 (26 - 39) © 2015 Faculty of Geography UGM and he Indonesian Geographers Association
Socio-Economic Factors Assessment Afecting the Adoption of Soil
Conservation Technologies on Rwenzori Mountain
Nabalegwa Wambede Muhamud and Asaba Joyfred
Received: 28 03 2015 / Accepted: 23 04 2015 / Published online: 30 06 2015 © 2015 Faculty of Geography UGM and he Indonesian Geographers Association
Abstract his study analysed the role of socio-economic factors in inluencing farmers’ adoption to soil conservation technologies in Bugoye Sub-county, Rwenzori Mountain. A cross sectional household survey design was used in this study, using systematic sampling to obtain 150 household samples. Qualitative analysis and chi-square tests were used to analyze these data. Results indicated that only 54% of the sampled households have adopted soil conservation, and revealed that eight of the nine factors signiicantly inluenced farmers’ adoption, which are slope, farm size, farm dis-tance from home, education level, family income, training, membership to NGOs, and credit accessibility. Only family size was insigniicant. Other constraints are labour demands, cost of conservation work, land fragmentation, crop pests, and the limited agricultural extension services. It is recommended to perform training for farmers on designing soil conservation structures. Policies for empowering farmers with extra income are crucial to increase the adoption of soil conservation eforts.
Abstrak Penelitian ini menganalisis peranan faktor sosial ekonomi dalam mempengaruhi adopsi petani terhadap teknologi konservasi tanah di Bugoye Sub-county, Gunung Rwenzori Mountain. Metode cross sectional household survey design di-gunakan dalam penelitian ini, dengan mengdi-gunakan systematic sampling untuk mendapatkan 150 sampel rumah tangga. Analisis kualitatif dan tes chi-square digunakan untuk menganalisis data tersebut. Hasil penelitian menunjukkan bahwa hanya 54% dari rumah tangga yang dijadikan sampel mengadopsi konservasi tanah, dan mengungkapkan bahwa delapan dari sembilan faktor secara signiikan mempengaruhi adopsi petani, yaitu kemiringan lereng, luas lahan, jarak lahan dari rumah, tingkat pendidikan, pendapatan keluarga, pelatihan, keanggotaan LSM, dan aksesibilitas kredit. Hanya jumlah anggota keluarga yang tidak berhubungan signiikan. Kendala lainnya adalah tuntutan tenaga kerja, biaya pekerjaan konservasi, fragmentasi lahan, hama tanaman, dan penyuluhan pertanian yang terbatas. Disarankan untuk memberikan pelatihan bagi para petani cara merancang struktur konservasi tanah. Kebijakan untuk menguatkan petani dengan peng-hasilan tambahan sangat penting dalam meningkatkan adopsi upaya konservasi tanah.
Keywords: Adoptions, Soil Conservation technologies, Socio-economic factors, Rwenzori
Kata kunci: Adopsi, teknologi konservasi tanah, faktor sosial-ekonomi, Rwenzori
Soil has been of particular interest to man since the beginning of organized agriculture many thousands of years ago. Brader [1994] observes no single resource is more important to the achievement of sustainable agriculture than soil, which contains the nutrients and stores water essential for plant growth. Indeed, the quality of soil largely determines the level of agricultural development, food production, and the quality of life for a large part of the population over the earth’s surface. In the developing world where the majority of the population live in the rural areas as farmers, human survival is dependent on the sustainable use of the land resource. As such, the quality of land should be maintained so that its on-site production capacity is maintained or improved to meet the needs of the present and future generations.
Nabalegwa Wambede Muhamud and Asaba Joyfred
Department of Geography and Social Studies, Kyambogo University Uganda
Email: nabalegwa@yahoo.com
Uganda as a developing country depends largely on agriculture for her food requirements, export earnings and raw materials for agro-based industries. However, due to rapid increase in population, there has been an increasing demand land for both agricultural and non agricultural activities, resulting in intensive cultivation of land, and lowering its current and potential capacity to produce goods and services. Uganda’s Population has been growing at a fast rate. he population igures of Uganda were 12.6 Million in 1980, 16.7 Million in 1991, and 24.7 Million people in 2002 [NEMA, 2005]. Currently the country’s population stands at 28.4 million with a population growth rate of 3.4%. As a result of this trend of population growth, land fragmentation is increasingly common, fallow periods have been greatly shortened and crop harvests have fallen. Soil deterioration by erosion, even on fertile soils, undermines the agricultural sector, which greatly upholds the country’s economy.
Busongora County is located in the eastern part of
Kasese district bordered by Bukonzo county in the west, Kamwenge District in the east, Kabarole District in the north and Bushenyi District in the south, (See Figure 1). his county has a fascinating physical landscape characterized by a low lat land in the northeast and south and a mountainous land rising to over 7500t in the North West. Over ity percent of Busongora county is mountainous typical of mount Rwenzori.
Busongora County is part of the Rwenzori region, which was subjected to several complex internal processes of faulting, folding and vulcanicity responsible for its striking relief drainage and geology. Nakimera [2001], citing Tanner [1971]; Maasha [1975] and Ebiger [1989], discussed the geology and geomorphology of the Rwenzori Mountain. She notes that the Rwenzori Mountains, of which Busongora County is its part, is considered to be a recently raised horst within the rit valley and comprises of the undiferentiated gneisses of the Gneissic-Granulitic complex overlaid uncomfortably in places occupied by the younger pre-Cambrian rocks of the Toro super group. he rise of the mountain and the formation of the rit valley were the result of a series of successive tectonic episodes reported to have started in the Miocene. During the major tectonic episode at about 8 Million years ago, the loor of the rit valley which dominates the north eastern and southern parts of Busongora was down-thrown. Around about 2.6 to 2.3 Million years ago, another major tectonic event resulted in the emergence of the Rwenzori up to considerable altitudes and into the formation of the present rit valley lakes of Edward in the southwest, George in the southeast and the Kazinga channel in the southern part of Busongora.
Maasha [1975] and Twesigomwe [1995], cited by Nakimera [2001], studied the seismicity of the Rwenzori and its Neighborhood and noted that earthquakes were common phenomena in the Rwenzori region, testifying to the fact that the area is still tectonically active. heir seismic data suggests that the Rwenzori is a segmented block whose segments move vertically relative to each other. he mountain itself is rising relative to the surrounding country [Twesigomwe and Ssemanda, 1998]. he Busongora uplands are also characterized by a number of deep incised river valleys typical of mountainous regions.
It is important to note that the sharp contrast in relief between the mountainous North West and the low land south and north East of Busongora has had a bearing on land use practices and on the severity of erosion. As such the erosion risk is higher on the mountainous North West, a phenomenon that calls for mitigation measures in the form of soil conservation if land has to be used sustainably.
Busongora County, as part of the larger Rwenzori Mountain experiences montane climate. Due to its location near the equator, the inter tropical convergence zone (ITCZ) lies close to the mountain range for most of the year and provides heavy orographic rainfall.
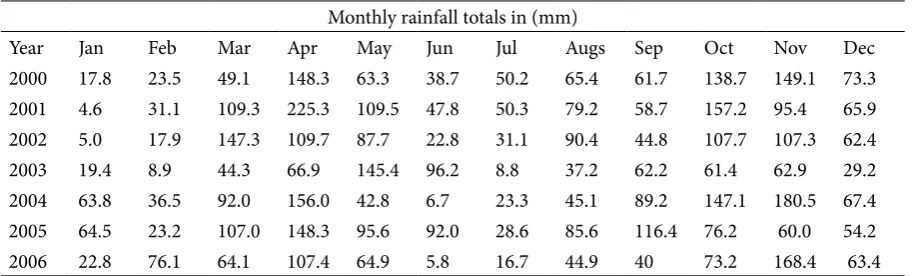
Rainfall data for this mountainous region is scarce. Even then, the scantly available data provided by Osmaston [1965] cited by Nakimera [2001], indicated that the Rwenzoris is a wet mountain with two short dry seasons of January- February and June -July. he mean monthly rainfall during these seasons is less than 50 mm. he average rainfall for the wet seasons of March- May and August - December is 203 mm. November is the wettest month with about 381 mm of rainfall. he Current rainfall data for Busongora shown in Table 1 conirms that the area still experiences two long wet seasons that is, March to May and August to December with mean monthly rainfall values of 104 mm and 83.6 mm respectively and two short dry seasons January to February and June to July with mean monthly rainfall values of 29.6 mm and 37.1 mm respectively.
Indeed, from the rainfall data presented in Table 1,January is the driest month with the mean rainfall value of 28.3 mm while November is the wettest month with mean rainfall of 117.6 mm. It should also be noted that the relief contrasts of Busongora have brought about variations in climatic conditions and as such, the mountainous North West is characterized by a relatively regular decrease in temperature with increasing elevation and generally heavy rainfall. Due to the Orographic efect, precipitation in the form of rainfall is generally to increase with increasing altitude. But, it seems that this is possible only up to the upper limit of the high-pressure zone. Osmaston [1965] indicated that above 2200 meters above sea level, precipitation begins to decrease with altitude. Important to note here, is that the higher frequency of rainfall over this mountainous area oten cause rapid mass movements which are readily accelerated by human use of the mountain resources [Cook and Dornkamp, 1974]. he low land north-eastern and southern parts of Busongora are however relatively dry and this is due to their generally low relief, a characteristic of the East African rit valley loor. In this study, the high intensity and frequency of rainfall in this mountainous region was presumed to be related to the high rates of erosion over the Busongora upland peasant farms, thus the need for soil conservation.
Table 1. Showing monthly rainfall data from the Kasese airstrip weather station in Busongora County Kasese district
Monthly rainfall totals in (mm)
Year Jan Feb Mar Apr May Jun Jul Augs Sep Oct Nov Dec
2000 17.8 23.5 49.1 148.3 63.3 38.7 50.2 65.4 61.7 138.7 149.1 73.3
2001 4.6 31.1 109.3 225.3 109.5 47.8 50.3 79.2 58.7 157.2 95.4 65.9
2002 5.0 17.9 147.3 109.7 87.7 22.8 31.1 90.4 44.8 107.7 107.3 62.4
2003 19.4 8.9 44.3 66.9 145.4 96.2 8.8 37.2 62.2 61.4 62.9 29.2
2004 63.8 36.5 92.0 156.0 42.8 6.7 23.3 45.1 89.2 147.1 180.5 67.4
2005 64.5 23.2 107.0 148.3 95.6 92.0 28.6 85.6 116.4 76.2 60.0 54.2
2006 22.8 76.1 64.1 107.4 64.9 5.8 16.7 44.9 40 73.2 168.4 63.4
Source: Department of Meteorology Ministry of Water and Environment
Figure 1. Map Location of Bugoye Sub County in Kasese District
their ability to produce goods on sustainable basis. On the moderate slopes however, thicker soils are more common towards the base than on slope crests where mass wasting and erosion inhibit soil accumulation. Presently land resources are cultivated on both the steep and gentle slopes in the form of cultivation, grazing, logging and road construction increase the dangers of soil erosion, hence the need for soil conservation. his study explores techniques that should be adopted by the Busongora upland peasant farmers to ensure that the fertility of soil, the only basic resource for agricultural development, is enhanced and sustained
2. he Methods
Across sectional household survey design was used in the study. Bugoye Sub-county, which is one of the densely populated sub-counties in Busongora County, was purposively chosen as a representative sample for assessing the factors inluencing farmers’ adoption of soil conservation. he sub-county was selected for observations based on the fact that, it is the one county where soil conservation is more pronounced. he area also represents some of the most fragile and erosion prone slopes in Busongora due to its generally steep slope gradient, population pressure on land and poor cultivation practices and as such, requires urgent attention.
For assessing the inluence of the socio-economic factors on farmers’ response to soil conservation, a questionnaire-guided interview was administered to 150 respondents drawn from all the ive parishes of the sub county. Two villages were randomly selected from each parish, making a total of ten villages. Systematic sampling was then used to select a total of 15 farmers per village using a list of household heads at the sub county. To have a detailed insight into the problems of soil erosion and issues of soil conservation, an agriculture extension oicer at the sub county was purposively selected and interviewed. Qualitative analysis and chi-square tests were used to analyze the data collected.
3. Result and Discussion
Analysis of data for the study was done to test the signiicance of each of the socio-economic factors in inluencing farmers’ response of soil conservation.
Cross tabulation and chi-square tests were used to test whether diferences in the independent variables between adopters and non adopters signiicantly afected farmers’ adoption of soil conservation, at 5% signiicance level.
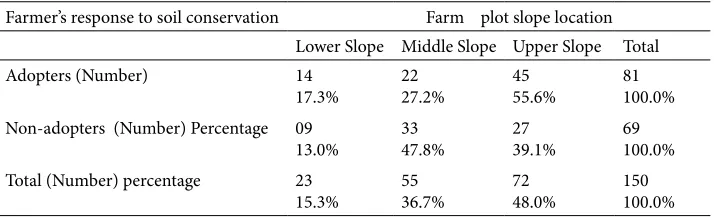
Slope steepness is one of the signiicant factors that was said to afect soil erosion in a way that the rate of erosion normally increases with the increasing slope [Morgan, 1986]. When the location of farm plots on the slopes of Bugoye was assessed, it was discovered that arable land in Bugoye Sub- County is located on all three slope segments that is, the lower, middle and upper slopes. As seen in Table 2, 15.3% of the sample households had farm plots on the lower slope segments, 36.7% had their farm plots on the middle slope segments while 48% had farm plots on the upper slopes. Among the adopters, 17.3% had farm plots located on lower slopes, 27.2% had farms on the middle slope and 55.6% had their farms on the upper slopes. For the non-adopters 13% had their farm plots on the lower slope, 47.8% had farms on the middle slopes, and 39.1% had farm plots on the upper slope. From the results it can be seen that most of the adopters, that is 55.6%, reported having farm plots on the upper slopes. But, this igure is equally high for the non-adopters. In fact about 39% of the non-adopters had farms on upper slopes too. he fact that a considerable number of non adopters were found to be farming the steep upper slopes of the Bugoye uplands without applying any form of conservation is an indicator of the urgent need to intensify soil conservation eforts in this mountainous part of Uganda.
In this study, farm plot slope location was assumed to signiicantly afect farmers’ adoption of soil conservation and as such a chi-square signiicance test was performed to ascertain whether the diferences in farm plot slope location between adopters and non-adopters is signiicant in inluencing farmers’ response to soil conservation. he results of the chi-square analysis are summarized in Table 3.
he chi-square analysis results show signiicant diference in farm plot slope location between adopters and non adopters. hus, farm plot slope location afects famers’ response to soil conservation. Indeed, in the study area, population pressure and land scarcity has
Table 2. Relationship between farmer’s responses to soil conservation methods and farm plot slope location slope. (n=150)
Farmer’s response to soil conservation Farm plot slope location
Lower Slope Middle Slope Upper Slope Total
Adopters (Number) 14
17.3%
22 27.2%
45 55.6%
81 100.0%
Non-adopters (Number) Percentage 09 13.0%
33 47.8%
27 39.1%
69 100.0%
Total (Number) percentage 23 15.3%
55 36.7%
72 48.0%
pushed most people to move to marginal lands with low productivity, so that farmers see conservation as a way of enhancing yields over these marginal lands. he worry for conservationists however, should be the fact that a good number of farmers, which is 39% of the non-adopters, were cultivating the steep slopes without practicing any soil conservation methods, thereby inducing severe erosion rates. he question here is why soil conservation appears to be diicult to implement even in areas where it is obviously diicult to sustain crop production without conserving the soil. A number of scholars have explained the diiculty of practicing conservation on unproductive lands. According to Meyer [1975], the irst requirement for efective soil conservation is that the income from the farm is large enough to provide a suicient portion for the maintenance of the soil capital. He added that it is illusionary to plan expanding agriculture activities on marginal land on the assumption that soil quality improvement will compensate for the low production potential. To him low production potential is in itself a major constraint to the control of further degradation. In Bugoye, the low production potential of the steeper slopes meant a low yield for the farmers, leading to poverty. he poor people have obviously passed on their poverty to land by cultivating it without any form of conservation, thereby worsening the land degradation problem. Unless government facilitates these farmers, soil conservation over these less productive areas, will remain uneconomically viable for a considerable number of farmers.
Analysis of the size of the land owned by each household indicated that, family land holdings are considerably small. Due to the practice of sharing land between the father and sons over generations, land in Bugoye is highly fragmented into small pieces. he
average number of pieces held by a farmer was 4 farm plots and the average farm size was 1.7 hectares, but generally farm size in the area of study ranged between 0.25 to 4 hectares.
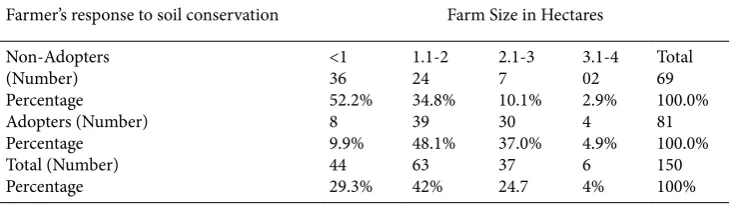
Among the adopters of soil conservation, 9.9% had farm size less than or equal to 1 hectare, 48.1% had land of 1.1 to 2 hectares, 37% had land between 2.1 to 3 hectares and 4.9% had land that is greater or equal to 3.1 hectares. Among the non-adopters, however, 52.2% of had farm size less than or equal to 1 hectare, 34.8% had 1.1 to 2 hectares of land, 10.1% had farm sizes of 2.1 to 3 hectares and 2.9% had farm size greater than or equal to 3.1 hectares (Table 4).
From the results in Table 4, it can be observed that adopters of soil conservation had larger farm plots, while most of non-adopters.had small farm plots.
he problem of small fragmented farm plots seems to be typical of rural Uganda and is indeed a barrier to soil conservation. Bagoora [1997] in analyzing the distribution of farm sizes among the upland peasant farmers of Rukiga, noted that family land holdings were considerably small and highly fragmented with the average size of pieces held per household being 6.7, thus making investment into soil conservation uneconomical.
In this study, adoption of soil conservation was presumed to be signiicantly afected by farm size. he chi-square test was run to test whether the diferences in farm sizes between adopters and non-adopters signiicantly afected farmers’ adoption to soil conservation and the results are presented in Table 5.
As seen on Table 5, the chi-square reveals a signiicant diference in farm sizes between adopters and none adopters. hus, farm size signiicantly afects farmers’ adoption of soil conservation in Bugoye. Farmers with relatively larger farm plots adopted
Table 3. Chi-Square test for the signiicance of farm plot slope location on adop-tion of soil conservaadop-tion
Value Degrees of freedom
Asymp.sig.(2-sided)
Pearson Chi-Square Likelihood Ration
Linear-by-Linear Association N of Valid Cases
6.871
Table 4. Relationship between farmer’s response to soil conservation methods and Farm size (n=150)
Farmer’s response to soil conservation Farm Size in Hectares
soil conservation more than those with smaller farm plots. hese results relate to the indings of Okoye [1998] who in his comparative analysis of factors inluencing adoption of traditional and recommended conservation practices in Nigeria conirmed that, adoption of soil erosion control practices responded to farm size positively and signiicantly. Given the large family sizes and therefore population pressure on land, soil conservation structures as terraces were said to occupy land that would have otherwise been used for agriculture and as such, households with smaller farm plots chose to devote the scarce land resource to the growing of crops. In analyzing the efect of farm sizes on the adoption of soil conservation methods, Meyer et al. [1977] argued that in many developing countries, the mean size of the farmstead does not allow an individual farmer to have an impact on land degradation. As such unless the problem of small land holdings in Rural Uganda is addressed, plans for improving adoption of soil conservation will not succeed.
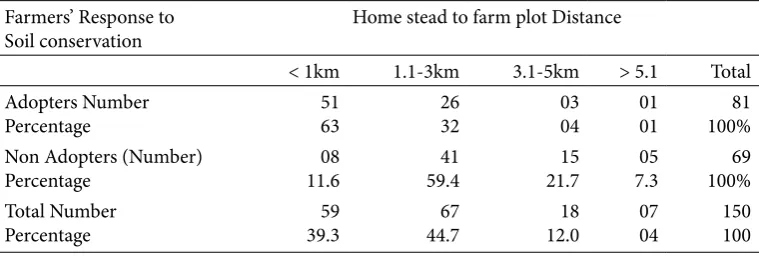
he distance travelled by the farmer to his farm plot is said to afect their willingness to adopt soil conservation practices. Analysis of homestead to farm plot distance in Bugoye, revealed that 39.3% of the 150 respondents had their furthest farm plot within a distance of less than one kilometre, 44.7% travelled a distance of 1 to 3 kilometres, 12.0% travelled a distance of 3.1-5km and 4% travelled a distance of 5.1 km and above. he results in Table 6, show that among the adopters of soil conservation, 63% travelled less than 1 km to their furthest farm plot, 32% travelled between 3.1 to 5 km, 4% travelled between 1.1 to 3 km and 1%
travelled a distance of 5.1 km and above. Among the non adopters, 11.6% travelled less or equal to 1 km to their furthest farm plot, 59.4% travelled between 1.1 and 3 km, 21.7% had their furthest farm plot being located at 3.1 to 5 km from the home stead while 7.3% travelled a distance of 5.1km and above. he average homestead to farm plot distance for adopters was 1.1 km, while that of the non-adopters was 2.7 km.
As shown by the results in Table 6, adopters travelled shorter distance than non-adopters,meaning that distance afected the adoption of soil conservation negatively.
In this study it was assumed that the distance from the homestead to the farm plot signiicantly afected farmers’ adoption soil conservation. herefore a chi-square signiicance test was run to ascertain whether the diferences in homestead to farm plot distance between adopters and non-adopters signiicantly afected farmers’ response to soil conservation. he test results are given in Table 7.
he chi-square test results showed a signiicant diference in homestead to farm plot distance between adopters and non adopters. Farmers that were close to their farm plots were found to adopt soil conservation more than those that were far away from their farm plots. Bagoora [1997], in analyzing distances travelled by farmers in the Rukiga highlands, explained the efect of homestead to farm plot distance on soil conservation by arguing that long distances waste farmers’ time and energy so that by the time they reach their farms, less time and energy is remaining, which makes economic sense for the farmer to devote the remaining time
Table 5. Chi-Square Tests for the signiicance of farm size on adoption of soil conservation
Value Degrees of freedom Asmp. Sig. (2-sided)
Pearson Chi-Square Likelihood Ratio Linear-by-Linear Association N of Valid Cases
36.158
Table 6. Relationship between farmers’ responses to soil conservation methods and distance (n=150)
Farmers’ Response to Soil conservation
Home stead to farm plot Distance
< 1km 1.1-3km 3.1-5km > 5.1 Total
and energy to crop growing rather than conservation practices. he same view was echoed by Alemu [1999], who argued that soil conservation structures are only retained on plots closer to residential areas. Indeed, some of the interviewed non-adopters complained that the time lost in traversing long distances to their farm plots made it diicult for them to construct soil conservation structures, as these required a lot of time.
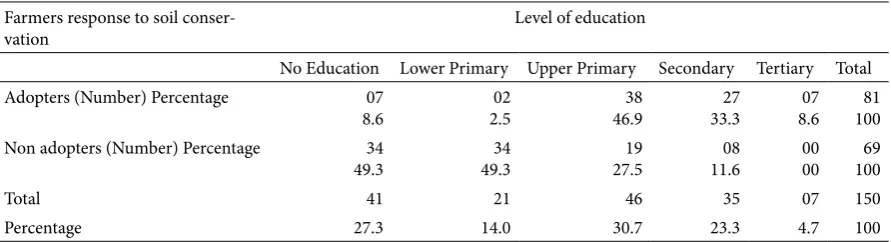
In terms of education levels, Busongora County like any other county in rural Uganda exhibits low levels of education. In the area of study, 27.3% of the 150 respondents had no education at all, 14.0% had lower primary education, and 30.7% had upper primary education. Only 28% had secondary and tertiary education. Analysis of education levels among the adopters and non-adopters shows that 8.6% of the adopters had no education, 2.5% had lower primary education, 46.5% had upper primary education, 33.3% had secondary education and 8.6% had tertiary education (Table 8). Of the non-adopters, 49.3% had no education at all, 27.5% had lower primary education, 11.6% had upper primary education and 11.6% had secondary education. here were no non-adopters with tertiary education.
As can be seen from the results in Table 8, the adopters were more educated than the non-adopters. On average 88.8% of the adopters had upper primary education and above, but the igure was 23.2% for non-adopters. In this study, level of education was presumed to positively and signiicantly inluence farmers’ adoption to soil conservation methods and as such adopters were expected to be more educated than the non-adopters. A chi-square test was run to test whether there were diferences in levels of education
between adopters and non-adopters and whether those diferences signiicantly afected farmers’ response to soil conservation. he Chi-square results are presented in Table 9.
As hypothesized, the chi-square test results show a signiicant diference in levels of education between adopters and non adopters. hus, the level of education signiicantly afected farmers’ adoption of soil conservation. Exposure to education was found to increase farmers’ management capacity and to enhance their understanding of the beneits of soil conservation. Education was also found to increase the farmers’ ability to obtain and apply relevant information concerning the use of various soil conservation methods. he results agree with Rogers’ [1982] argument that exposure to education enhances the awareness of a new technology and thus, increasing the capacity of the farmers to adopt a given technology. Ntege-Nanyeenya [1997], in the case of Uganda, indicated that education had a signiicant efect on farmers’ choice to adopt maize improved production technologies. Another study done by Nkonya et al. [1997] on the efect of education on the adoption of improved maize seeds also shows a similar efect. Given that education enhances the farmers’ ability to adopt soil conservation methods, the low level of education in the area of study posses a big challenge to soil conservation eforts in Busongora County in particular and rural Uganda in general. (e) Family size
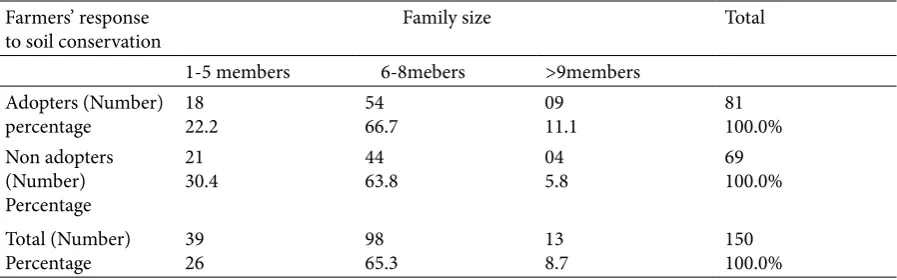
Aware of the inluence of family size on food production and conservation work, the respondents were asked to indicate the number of members in their households and the results revealed that family size ranges between 2 and 11 persons, an indication that
Table 7. Chi-Square Test for the signiicance of homestead to farm plot distance on adoption of soil conservation
Value Degrees of freedom Asymp. Sig. (2-sided)
Person Chi-Square Likelihood Ration Linear-by-Linear Asso-ciation
N of valid Cases
44.690 49.029 38.588 150
3 3 1
.000 .000 .000
Table 8. Relationship between Farmer’s response to soil conservation and Level of education (n=150)
Farmers response to soil conser-vation
Level of education
No Education Lower Primary Upper Primary Secondary Tertiary Total
Adopters (Number) Percentage 07
8.6
02 2.5
38 46.9
27 33.3
07 8.6
81 100
Non adopters (Number) Percentage 34 49.3
34 49.3
19 27.5
08 11.6
00 00
69 100
Total 41 21 46 35 07 150
family planning practices in the area of study are not well developed. Most families in Busongora have large numbers of people with the average family size being 6 persons per household. Generally about 77.8% of the adopters and 69.6% of the non-adopters have family size ranging from 6 to 11 persons (Table 10).
In this study family size was presumed to have a positive and signiicant efect on the adoption of soil conservation, so that adopters were assumed to have larger family sizes than non-adopters. Aterwards, a chi-square test was run to test whether the diferences in family sizes between adopters and non adopters signiicantly afected farmers’ adoption of soil conservation practices. he chi-square test results in Table 11 indicated that that there was no signiicant diference in family sizes between adopters and non adopters, family size did not signiicantly afect farmers’ response to soil conservation.
Most of the studies about on the inluence of family size on adoption of soil conservation done in diferent areas indicated that family size has a positive and signiicant efect on soil conservation. Admassie [1992] in his study on catchments approach to soil conservation in Kenya found that family labour the most important factor in the implementation of soil conservation. he size of households has also been identiied to signiicantly inluence the rate of fertilizer adoption in Eastern Oromia, Ethiopia [Bezabih 2000] and the probability of adopting improved fallow in Zambia [Keil 2001]. Whereas large families would be
an advantage in soil conservation, as they would ensure adequate family labour to construct and maintain conservation structures and gather mulching materials, analysis of age groups in each family indicated an immense labour shortage in the area of study. While the results show that the main source of labour for farm activities is the family, analysis of family size in relation to age among 30 randomly selected households revealed that, about 55.2% of the family members were children of up to 19 years, with many still in school and others too young to provide labour for conservation work. 22.4% were found to belong to age group of 20-45 years, 17.6% were 46-55 years old while 4.8% were over 55years old. As such family size did not necessarily represent the amount of labour available for farm activities including soil conservation work. he same view is echoed by Bagoora [1997], who in analyzing the inluence of family sizes on food production and soil conservation in the Rukiga highlands notes that, farm labour at the family level was inadequate due to the fact that most of the family members in the area were young and therefore either at school or too young to do any conservation work. As such unless soil conservationists urgently address this problem of inadequate labour in rural Uganda, it will continue to constrain soil conservation eforts.
Household income is believed to be important in inluencing adoption of innovations including those in agriculture. Increased income is likely to increase the ability of a farmer to pay for labour for
Table 10. Relationship between farmer’s response to soil conservation methods and family size (n=150)
Farmers’ response to soil conservation
Family size Total
1-5 members 6-8mebers >9members
Adopters (Number) percentage
18 22.2
54 66.7
09 11.1
81 100.0% Non adopters
(Number) Percentage
21 30.4
44 63.8
04 5.8
69 100.0%
Total (Number) Percentage
39 26
98 65.3
13 8.7
150 100.0% Table. 9 Chi-Square Tests for signiicance of education level on the adoption of soil conservation
Value Degrees of Freedom Asymp. Sig. (2- sided)
Pearson Chi-Square 67.896 4 .000
Likehood Ration 76.161 4 .000
Linear-by-Linear Association 51.322 1 .000
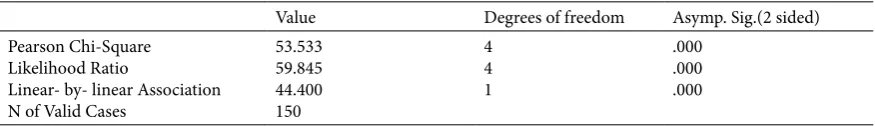
the construction and maintenance of conservation structures and the collection of mulches. Other soil conservation methods as application of fertilizers are costly and cannot be aforded by poor households. As revealed by data presented in Table 12, the majority of the peasant farmers in Busongora County are poor with low incomes, typical of rural Uganda. Since a large percentage of the peasant farmers’ income comes from agriculture, the low agricultural productivity of their farms is largely responsible for the biting poverty in Rural Uganda. Of the 150 respondents about 33.4% reported earning monthly income of up to 40.000 shillings, 43.3% reported earning between 40.0001 to 60.000 shillings per month while only about 23.3% were earning over 60.000 shillings per month. Desegregation of data into adopters and non adopters revealed that adopters were wealthier than the non adopters. Of the 81 adopters of soil conservation, about 91.4% reported earning a monthly income of over 40.000 shillings. his igure was 37.7% for the non adopters.
In this study, household income was hypothesised to signiicantly afect farmers’ adoption of soil conservation. High income farmers were assumed to adopt soil conservation more than low-income farmers. As such, the chi-square signiicance test was run to test whether the diferences in incomes between the adopters and non-adopters signiicantly afected soil conservation. As seen in Table 13, the chi-square analysis showed a signiicant diference in incomes between adopters and non adopters. hus household income, signiicantly afects farmers’ response to soil conservation implying that higher income farmers adopted soil conservation more than lower income ones.
Indeed, as asserted by Dudal [1980], the total income from farm and non-farm activities inluences how much is invested in soil conservation. In his view, if the total income from the farm is suicient, a due share will be spent on soil conservation eforts but if the income is low and the farm productive capacity is low,
Table 12. he relationship between farmers’ response to soil conservation and their family income (n=150)
Farmers’response to soil conservation
Family Income in shillings Total
<=20.000 20.0001-40.0000
40.0001-60000
60.0001-100.0000
>=100.000
Adopters (Number) Percentage
02 2.5
05 6.1
43 53.1
14 17.3
17 21.0
81 100
Non Adopter s (No.) Percentage
20 29.0
23 33.3
22 32
01 1.4
03 4.3
69 100
Total (Number) Percentage
22 14.7
28 18.7
65 43.3
15 10
20 13.3
150 100
Table 13. Chi-Square Tests for signiicance of income on adoption of soil conservation
Value Degrees of freedom Asymp. Sig.(2 sided)
Pearson Chi-Square Likelihood Ratio
Linear- by- linear Association N of Valid Cases
53.533 59.845 44.400 150
4 4 1
.000 .000 .000
Table 11. Chi-Square Tests for the signiicance of family size on adoption
Value Degrees of freedom Asymp. Sig. (2-sided)
Pearson Chi-Square 3.109 2 .375
Likelihood Radio 3.526 2 .317
Linear-by-Linear
Association 2.483 1 .115
then the portion of income spent on soil conservation will be insuicient to maintain the land. As such, it is diicult for the low income peasant farmers of Bugoye to practice soil conservation. In fact the poor farmers have transferred their poverty onto land by farming it without conservation, thus accelerating soil erosion and aggravating the problem of land degradation, a problem that requires urgent attention.
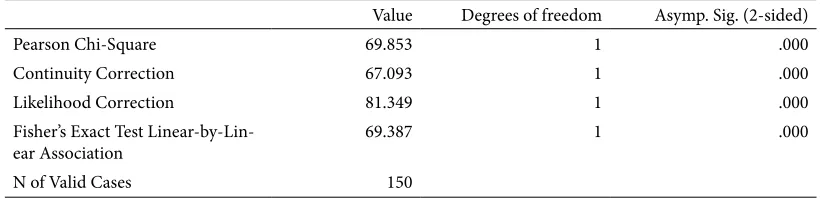
Training in soil conservation is believed to improve a farmer’s ability to apply a soil conservation technology on his farm. As such, farmers were asked if they ever had any form of training on the use of soil conservation methods. As shown in Table 14, 61 of the 150 farmers, which is 40.7% reported having had some form of training on the use of soil conservation, while 89 farmers that is 59.3%, had not received any form of training in soil conservation. Desegregation of data into adopters and non-adopters shows that, 71.6% of the adopters had received some form of training in soil conservation while 28.4% had not. Among the non-adopters however, 95.7% had not received any training in soil conservation while only 4.3% had received training in soil conservation.
As seen from Table 14, adopters were more trained than non-adopters. In this study, training in soil conservation was presumed to signiicantly improve farmers’ ability to adopt soil conservation methods. A chi-square test was run to show whether training in soil conservation signiicantly afected farmers’ adoptive behaviour, the results of which are presented in Table
15.
he results of the chi-square analysis in Table 15 revealed a signiicant diference in training between adopters and non adopters, implying a signiicant efect of training on farmers’ adoption of soil conservation technologies. Farmers who had trained in soil conservation adopted soil conservation more than those who had not trained. Farmers, however, complained that most of the training was done at the sub-county headquarters and at religious centers, where the extension workers explained what was supposed to be done on their farm plots but without ever visiting them on their individual farms. Even then, only 25 of the 61 farmers, which is 41% of those who had received training, reported having been trained by Government agricultural extension staf. he rest were reported to have been trained by friends and NGO staf. herefore, it could be said that most of the training in soil conservation in Bugoye, that was done by NGOs and government extension workers is too theoretical and only provides the farmer with a motivation to practice conservation without the technical knowledge of how to apply the methods. he motivated farmers therefore use their own personal knowledge together with the little they can remember from the extension worker’s lectures to determine the dimensions of the conservation structures on their farms. he few and poorly facilitated extension staf, that is one per sub-county, cannot adequately provide training to all the farmers and this may partly account for the substandard
Table 14. Relationship between farmer’s response to soil conservation and training in soil conserva-tion methods. (n=150)
Farmer’s response to soil conservation Training in soil conservation
Not trained Trained Total
Adopters (Number) 23
28.4
58 71.6
81 100
Non adopters (Number) 66
95.7
03 4.3
69 100
Total (Number) 89 61 150
Percentage 59.3 40.7 100.0
Table 15. Chi-Square Tests for signiicance of training on adoption of soil conservation methods.
Value Degrees of freedom Asymp. Sig. (2-sided)
Pearson Chi-Square 69.853 1 .000
Continuity Correction 67.093 1 .000
Likelihood Correction 81.349 1 .000
Fisher’s Exact Test Linear-by-Lin-ear Association
69.387 1 .000
and ineicient conservation structures observed on the Bugoye upland farm plots. he problem of poor facilitation of extension workers is well elaborated by Bagoora [1997] who argued that, the generally low eiciency of government extension services due to the lack of incentives and logistics for conservation work was a major hindrance to soil conservation eforts in the Rukiga highlands. hus, it is prudent that extension services in Busongora County and the Rwenzori region in general should be improved to facilitate farmers’ training in soil conservation and enhance the adoption of soil conservation methods.
It is a recognized fact that the difusion of information on improved technologies is an important element that positively contributes to their sustained use. he role of formal organizations in soil conservation is to disseminate information about various soil conservation technologies and the need for soil conservation. Analysis of membership to local organizations revealed that 37.3% of the 150 respondents belonged to at least one formal local organization, while 62.7% did not belong to any formal organization. Table 16 shows that, among the peasant farmers who had adopted soil conservation, 68.1% were members to local organizations and 31.9% were non-members. However, among the non-adopters 88.9% were non-members of formal organization while 11.1% were members. From the results it can be deduced that most of the adopters belonged to at least one formal organization while only a few of the non-adopters were members to formal organizations. It is also important to note here that, most of the farmers who were members to formal organizations reported belonging to farmers
associations.
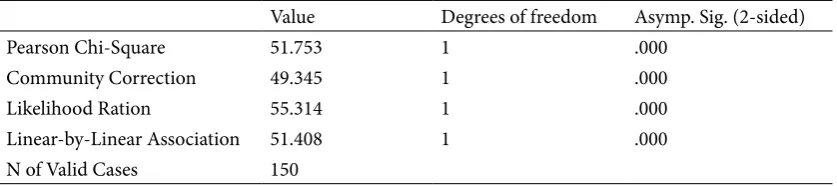
he contribution of formal organization to social capital has been emphasized as the major of NGOs in soil conservation. In this study membership to a formal organization was presumed to positively and signiicantly inluence farmers’ adoption of soil conservation methods. A chi-square test was run to show whether membership to formal organizations signiicantly afected soil conservation, the results of which are given in Table 17.
he chi-square analysis results indicate a signiicant diference in membership to formal local organizations between adopters and non adopters. Membership to NGOs signiicantly afects farmers’ adoption of soil conservation. Indeed membership to an existing local organization relects to some extent a certain level the social capital possessed by a farmer, which in turn enables the farmer to internalize the economic externalities of adopting soil conservation methods. As noted by Troeh et al. [1980], most of the beneits of soil conservation are enjoyed by other land owners and the general public rather than by the individual farmer, who initially invests in building the terraces, changes tillage practices or plants protective vegetation. In his view soil conservation has more communal than individual beneits. In agreement with this, Swinton [2000] argued that although these beneits are not accrued to the farmer who makes the investment, community organizations can internalize these externalities. In his view social capital in the form of shared norms and or feelings among members has the potential to motivate individuals to act for the collective good. In the area of study, peasant farmers who reported belonging Table 16. Relationship between farmers’ responses to soil conservation methods and membership to a local
orga-nization (n=150)
Farmer’s Response to Soil Conservation Membership to NGO
Member Non member Total
Adopters (Number) Percentage
Non adopters (Number) Percentage
Total (number) percentage
47 68.1% 9 11.1% 56 37.3%
22 31.9% 72 88.9% 94 62.7%
69 100.0% 81 100.0% 150 100.0%
Table 17. Chi-Square Test for the signiicance of membership to NGOs on adoption of soil conservation methods.
Value Degrees of freedom Asymp. Sig. (2-sided)
Pearson Chi-Square 51.753 1 .000
Community Correction 49.345 1 .000
Likelihood Ration 55.314 1 .000
Linear-by-Linear Association 51.408 1 .000
to local formal organizations disclosed that these organizations had helped them to access information about land management practices, family planning methods, good feeding, better sanitation, and health. hey also reported that members, in small groups, help one another in constructing terraces on their farm plots and also through pooling resources together. Some reported having started a small scale income generating projects such as poultry, piggery, rearing of exotic goats, vegetable growing. he money from these projects would be lend to individual members at low interest rates thus boosting their incomes. All these indicate that local organizations are indeed active in boosting farmers’ incomes, disseminating information and creating awareness on the diferent methods of conserving soil, the social beneits of soil conservation, and thus, positively inluencing farmers’ adoption of soil conservation. Swinton [2000] in agreement with these indings asserts that, where community organizations exist social capital may further help individuals overcome resource barriers to conservation by providing collective capital and labour. It is therefore necessary that the formation of these local formal organizations be given urgent attention by both government and NGOs to boost farmers’ social capital and, therefore, enhance adoption of soil conservation in rural Uganda.
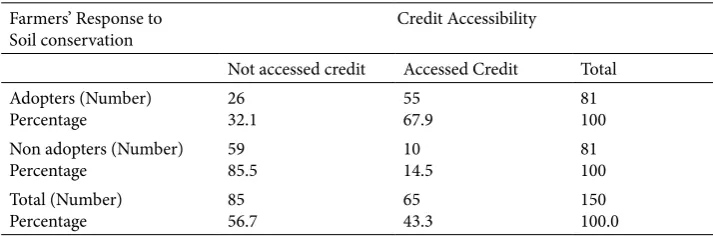
Poor rural households in developing countries lack adequate access to credit, which in turn impinges a signiicant negative impact on technology adoption, agricultural productivity, nutrition, health, and all household welfare. In the study area, it was found that a total of 65 respondents, which is 43.3% had received credit at least once in the last three years, while 85 respondents that is 56.7%, had not accessed any form of credit. Desegregation of data into adopters and non-adopters of soil conservation as shown in Table 18 revealed that 67.9% of the adopters had accessed credit while 32.1% had not. But among the non-adopters, only 14.5% had accessed credit while 85.5% had not. As such, adopters were found to have accessed credit more than the non-adopters.
Limited access to credit is said to have a negative impact on the adoption of technologies. In this study,
credit accessibility was assumed to signiicantly afect farmers’ ability to adopt soil conservation. A chi-square test was therefore done to ascertain whether credit accessibility was signiicantly related to adoption of soil conservation. he results of the chi-square are presented in the Table 19.
As seen from the results in Table 19, the chi-square analysis showed a systematic diference in credit accessibility between adopters and non adopters. hus credit accessibility signiicantly afects adoption of soil conservation. he positive role of access to credit in enhancing the rate of adoption of technology has been well acknowledged. Wogayehu and Drake [2001] argue that, farmers who acquire money on credit are motivated by the desire to pay back and as such they invest more in yield enhancing activities such as soil and water conservation. In Bugoye sub-county, it was discovered that, besides investing money obtained from credit in small scale businesses such as shops and the payment of children school fees, the majority reported having used a considerable portion of the borrowed money to fund their agriculture activities including inancing the construction of diversion channels water, collection pits and terraces. he availability of credit was found to supplement farmers’ low incomes, thereby enabling them to inance activities that would have been diicult to undertake without acquisition money on credit. Although accessibility to credit by Bugoye farmers was found to facilitate soil conservation, credit infrastructure was found to be inadequate. Micro inance schemes were found to be poorly developed so that the small farmers groups were found to be the main source of credit for most of the farmers. In fact 43 of the 65 farmers, which is 66% of those that had acquired credit, reported having obtained it from farmers association. Only ive farmers, which are 7.7%, reported having got money from formal micro inance institutions mainly pride micro inance whose oices are located in Kasese town at a considerable distance from Bugoye. he remaining 17 farmers, which are 26.3%, had acquired credit from friends and individual money lenders.
his poor micro inance infrastructure denies the poor peasant farmers the badly needed capital for
Table 18. Showing Relationship between farmer’s response to soil conservation methods and credit accessibility (n=150)
Farmers’ Response to Soil conservation
Credit Accessibility
Not accessed credit Accessed Credit Total
Adopters (Number) Percentage
26 32.1
55 67.9
81 100
Non adopters (Number) Percentage
59 85.5
10 14.5
81 100
Total (Number) Percentage
85 56.7
65 43.3
investment in modern methods of agriculture including soil conservation of agriculture for better yields, and should be the focus of those responsible for ensuring sustainable use of the land resource in rural Uganda.
4. Conclusions
his study was undertaken in response to the lack of data on the performance of the present soil conservation technologies in the Rwenzori highlands in western Uganda and as such it generated large amounts of data on the factors afecting their adoption and on the problems and prospects of soil conservation on arable lands. Based on the indings of the study the following conclusions were made.
On the factors that afect farmers adoption of soil conservation, training in soil conservation was found to be the most signiicant factor inluencing farmers response to conservation eforts, followed by membership to local formal organization, credit accessibility, farm plot slope location, and homestead distance to farm plot. Family size was found to be insigniicant in inluencing farmers’ behaviour towards soil conservation.
he high labour requirements for soil conservation
work and land shortages due to land fragmentation and the lack of expertise knowledge and guidance on the appropriate designs of soil conservation structure were identiied as the most important constraints to soil conservation eforts. Indeed, both the adopters and non adopters complained that they lacked labour and money for soil conservation activities, and their limited access to extension workers leaving them with no choice but to cultivate land with no conservation.
he main conclusion of this study is that severe erosion still takes place on upland peasant farms despite the conservation measures undertaken by the farmers, and given that farmers eforts to practice soil conservation are mainly constrained by their social economic environment it is imperative to advocate for strategy that is more comprehensive involving the application of the combination of physical conservation structures, land management practices, and agronomic methods together with ensuring that farmers are provided with the necessary knowledge and skills useful in designing appropriate soil conservation structures and availed with the capital resources to fund soil conservation since it is indeed a costly venture but with communal beneits.
Table 19. Chi-Square Tests for signiicance of credit on adoption of soil conservation
Value Degrees of freedom Asymp. Sig. (2- sided)
Pearson Chi-Square 43.283 1 .000
Continuity Correction 41.135 1 .000
Likelihood Ration 464.491 1 .000
Fisher’s Exact Test Linear-by-Linear Asso-ciation
42.994 1 .000
N of Valid Cases 150
References
Bagoora, D.K., and Festus., (1997), Assessment of runof and soil loss on Peasant Upland farms and their Implications for Environmental Conservation in Rukiga Highlands Eastern Kabale District: Unpub phD Dissertation; Makerere University.
Bezabih, E., (2000), he Role of New varieties and chemical Fertilizer under risk: Case of Small holders in Eastern Oronia, Ethiopia,Shaker Verlag, Aachen, Germany., In: Abera Birhanu Demeke (ed). Factors Inluencing the Adoption of Introduced Soil Conservation Practices in North Eastern Ethiopia. Brader, L., (1994), Sustainable Agriculture and
Environment. In Achipale, E., Bakunda M.A., Tenywa J.S., Ogenga Latigo, M.W., Mugali, J.O., (Eds).
Cook R. U., and Doornkamp, J.C., (1974), Geomorphology in Environmental Management, Oxford University Press.
Dudal,. (1980), An Evaluation of Soil Seeds In: RPC Morgan (ed). Soil Conservation Problems and Prospects. Bedford UK
Ebiger C J., (1989), Tectonic Develoment of the western Branch of the East African rit valley System., In: Nakimera, Immaculate (ed), he Impact of human activities and climate on the Vegetation in the Lake Victoria region and on the Rwenzori Mountain and its Neghbourhood. Unpub. PhD hesis, Faculty of science, Makerere University.
Keil, A., (2001), Adoption of leguminous tree Fallows in Zambia Discussion Paper No.33.University of Gottingen, Germany: In Abera, Birhanu, Demeke, (ed). Factors Inluencing the adoption of introduced soil conservation practices in Northwestern Ethiopia.
(ed), he Impact of human activities and climate on the Vegetation in theLake Victoria region and on the Rwenzori Mountain and its Neghbourhood. Unpub. PhD hesis, Faculty of science, Makerere University.
Meyer, L, D., and Foster G. R., (1975), Source of Soil eroded by Water from Upland slopes: InMorgan,R. P. C., (ed) soil Conservation Problems and Perspectives. John willy and sons Chrichester. Newyork. Brisbane. Toronto.
Meyer L. D., and Harman W. C., (1977), Multiple erosion rain fall simulator for erosion research On hill side slopes.ASAE Paper. In In Morgan,R. P. C., (ed) soil ConservationProblems and Perspectives.John willy and sons Chrichester. Newyork. Brisbane. Toronto. Morgan R.P.C, (1986), Soil erosion and Conservation.
Longman roup, UK, Limited.
Nakimera Immaculate, (2001), he Impact of human
activities and climate on the Vegetation in the Lake Victoria region and on the Rwenzori Mountain and its Neighbourhood. Unpub. PhD hesis, Faculty of Science Makerere University.
NEMA.,2004/2005. State of Environment report for Uganda: National Environment Management Authority. Kampala.
Okoye, C. U., (1998), Comparative analysis of the Factors in the adoption of Traditional andRecommended soil erosion control Practices in Nigeria. Soil and tillage research., In: Abera Birhanu Demeke (ed). Factors Inluencing the Adoption of Introduced Soil Conservation Practices in North Eastern Ethiopia.