ILO Estimates of the Economically Active Population:
1990-2010 (Sixth Edition)
Contents
Contents ... 2
Preface ... 3
1. Introduction ... 4
2. Estimation model 1990-2010: data and methodology ... 5
2.a. Introduction ... 5
2.b. Data selection criteria and coverage ... 6
2.c. Missing value estimation procedure ... 9
3. Strengths, limitations and future work ... 21
4. Bibliography ... 23
ANNEX 1: Country composition of each sub-regional grouping... 25
ANNEX 2: Tables of regression specifications by region, sex and age group ... 27
ANNEX 3: Harmonizing LFPR by age bands ... 31
a. Harmonising data to 15 years and above ... 31
b. Harmonising data from large age bands to 5-year age bands ... 34
Preface
The 6th Edition of the estimates and projections of the economically active population EAPEP Database is the result of a joint collaboration between the ILO Department of Statistics and the ILO Employment Trends Unit.
In this edition, the Employment Trends Unit and the Department of Statistics had the joint responsibility for developing the historical estimates (1990-2010), whilst the Department of Statistics had primary responsibility for developing the projections.
For this edition, enhanced methodologies have been developed in order to improve the EAPEP labour force estimates and projections. There are several important changes in this edition as compared to the previous one.
Firstly, the statistical basis has been increased (in other words, the proportion of imputed values has been reduced). In addition, the historical estimates (1990-2010) are now accompanied by detailed metadata for each data point. The metadata include several fields regarding the source of collected data, the type of adjustments made to harmonise them (when needed) and the type of imputation method used to fill missing data.
Concerning the projection exercise, the projections are now based on a wider range of models than in the previous edition. Notably, they allow the capture of the impact of the latest economic (and still on-going) crisis on the labour force participation for concerned countries. Finally, in this edition the ILO uses projections made by National Statistical Offices (NSOs), provided that these have been published recently. This concerns around twelve countries.
The resulting models and methodologies will be the basis for subsequent updates of the EAPEP Database by the Department of Statistics and the Employment Trends Unit.
This paper was prepared by Evangelia Bourmpoula, Steven Kapsos (ILO Employment Trends Unit) and Jean-Michel Pasteels (ILO Department of Statistics). This work has benefited from excellent collaboration with Geneviève Houriet-Segard, Messaoud Hammouya, Monica Castillo and Ivan Mustafin, as well as from the valuable comments of Rafael Diez de Medina, Director of the Department of Statistics and Ekkehard Ernst, Chief of the Employment Trends Unit.
1. Introduction
The ILO programme on estimates and projections of the economically active population is part of a larger international effort on demographic estimates and projections to which several UN agencies contribute. Estimates and projections of the total population and its components by sex and age group are produced by the UN Population Division, and employed populations by the ILO, the agricultural population by FAO and the school attending population by UNESCO.
The main objective of the ILO programme is to provide member states, international agencies and the public at large with the most comprehensive, detailed and comparable estimates and projections of the economically active population in the world and its main geographical regions. The first edition was published by the ILO Department of Statistics in 1971 (covering 168 countries and territories, with reference period 1950-1985)1; the second edition in 1977 (with 154 countries and territories and reference period 1975-2000)2; the third edition in 1986 (with 156 countries and territories and reference period 1985-2025)3; the fourth edition in 1996 (with 178 countries and territories and reference period 1950-2010)4; the fifth edition in 2007 (with 191 countries and reference period 1980-2020) with two subsequent updates (in August 2008 and December 2009)5.
The present sixth edition covers 191 countries and territories. The reference period for the estimates is 1990-2010 and for the projections is 2011-2020. For countries with historical data prior to 1990 (but after 1979), estimates concerning the period prior to 1990 are also provided.
The basic data are single-year labour force participation rates by sex and age groups, of which ten groups are defined by five-year age intervals (15-19, 20-24, ..., 60-64) and the last age group is defined as 65 years and above. The data are available at the ILO main website for labour statistics: http://laborsta.ilo.org.
The labour force participation rate is a measure of the propo tio of a ou t ’s o ki g-age population that engages actively in the labour market, either by working or looking for work; it provides an indication of the relative size of the supply of labour available to engage in the production of goods and services.6 The labour force participation rate is calculated as:
where stand for country, year, age group and sex, respectively.
At this aggregated level, the variable "participation rate" is of dichotomous nature: either you participate or you do not. That is, what is observed is how many individuals from a particular demographic group (male, female, prime age, youth, etc.) are working or looking for work, but the extent of work – the number of hours which this portion of the population is working or willing to work – is not captured.
The purpose of the present note is to describe the main elements of the estimation methodology adopted for the sixth edition. For this edition, enhanced methodologies have been developed in order to improve the EAPEP labour force estimates and projections. Firstly, the statistical basis has been increased (in other words, the proportion of imputed values has been reduced). In addition, the historical estimates (1990-2010) are now accompanied by detailed metadata for each data point regarding the source of collected data, the type of adjustments made to harmonise them (when needed) and the type of imputation method used to fill missing data.
1
ILO, Labour force projections, 1965-85 (1st
edition, Geneva 1971). 2
ILO, Labour force projections, 1950-2010 (2nd
edition, Geneva 1976). 3
ILO, Economically Active Population: Estimates and projections, 1950-2025 (3rd edition, Geneva 1986).
4
ILO, Economically Active Population Estimates and projections, 1950-2010 (4th edition, Geneva 1996).
5
ILO, Estimates and Projections of the Economically Active Population, 1980-2020 (5th
edition, Geneva 2007, Update August 2008, Update December 2009).
6
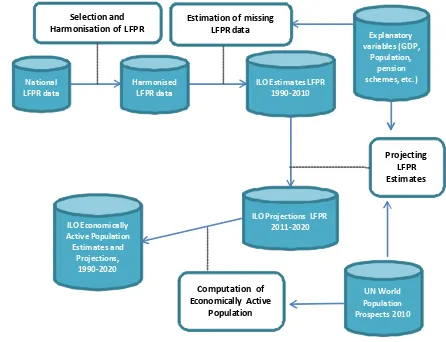
Figure 1. ILO Estimates and Projections of the Economically Active Population 1990-2020 (Sixth edition)
The underlying national labour force data used for producing harmonised single-year ILO country estimates of labour force participation rates (LFPR) by sex and standard age groups are described in section 2. That section also includes the description of the statistical treatment of missing values and the estimation models for countries for which no or limited data were available. The different strengths and limitations of the present methodology are presented in section 3, as well as proposed directions for future work.
2. Estimation model 1990-2010: data and methodology
2.a. Introduction
The EAPEP database is a collection of country-reported and ILO estimated labour force participation rates. The database is a complete panel, that is, it is a cross-sectional time series database with no missing values. A key objective in the construction of the database is to generate a set of comparable labour force participation rates across both countries and time. With this in mind, the first step in the production of the historical portion of the 6th Edition of the EAPEP database is to carefully scrutinize existing country-reported labour force participation rates and to select only those observations deemed sufficiently comparable. Two subsequent adjustments are done to the national LFPR data in order to increase the statistical basis (in other words, to decrease the proportion of imputed values); that is, harmonization of LFPR data by age bands and adjustment based on urban data (see Annexes 3 and 4 for a detailed description of these adjustments). In the second step, a weighted least squares panel model was developed to produce estimates of labour force participation rates for those countries and years in which no country-reported, cross-country comparable data currently exist.
This section contains two main parts. The first part provides an overview of the criteria used to select the
aseli e atio al la ou fo e pa ti ipatio ate data that se e as the ke i put i to the ILO’s E o o i all
Active Population Estimates and Projections 6th Edition database. This section includes a discussion of
non-National LFPR data
Selection and Harmonisation of LFPR
Estimation of missing LFPR data
Harmonised LFPR data
UN World Population Prospects 2010 ILO Estimates LFPR
1990-2010
Projecting LFPR Estimates
ILO Economically Active Population Estimates and
Projections, 1990-2020
ILO Projections LFPR 2011-2020
Explanatory variables (GDP,
Population, pension schemes, etc.)
Computation of Economically Active
comparability issues that exist in the available national LFPR data and concludes with a description of the LFPR data coverage, after taking into account the various selection criteria. The second part describes the econometric model developed for the treatment of missing LFPR values, both in countries that report in some but not all of the years in question, as well as for those countries for which no data are currently available.
2.b. Data selection criteria and coverage
Non-comparability issues
In order to generate a set of sufficiently comparable labour force participation rates across both countries and time, it is necessary to identify and address the various sources of non-comparability. This section draws heavily on the labour force participation data comparability discussion in the Key Indicators in the Labour Market (KILM), 7th Edition (Geneva, ILO 2011). The main sources of non-comparability of labour force participation rates are as follows:
Type of source– country-reported labour force participation rates are derived from several types of sources including labour force surveys, population censuses, establishment surveys, insurance records or official government estimates. Data taken from different types of sources are often not comparable.
Age group coverage– non-comparability also arises from differences in the age groupings used in measuring the labour force. While the standard age-groupings used in the EAPEP Database are 15-19, 20-24, 25-29, 30-34, 35-39, 40-44, 45-49, 50-54, 55-59, 60-64 and 65+, some countries report non-standard age groupings, which can adversely affect broad comparisons. For example, some countries have adopted non-standard lower or upper age limits for inclusion in the labour force, with a cut-off point at 14 or 16 years for the lower limit and 65 or 70 years for the upper limit.
Geographic coverage – some country-reported labour force participation rates correspond to a specific geographic region, area or territory such as "urban areas". Geographically-limited data are not comparable across countries.
Others – Non-comparability can also arise from the inclusion or non-inclusion of military conscripts; variations in national definitions of the economically active population, particularly with regard to the
statisti al t eat e t of o t i uti g fa il o ke s , "subsistence work" and the u e plo ed, ot looki g
fo o k ; a d diffe e es i su e efe e e pe iods.
Data selection criteria
Taking these issues into account, a set of criteria was established upon which nationally-reported labour force participation rates would be selected for or eliminated from the input file for the EAPEP dataset.7 There are three criteria described hereafter.
Selection criterion 1 (type of source)
Data must be derived from either a labour force or household survey or a population census. Labour force surveys are the most comprehensive source for internationally comparable labour force data. National labour force surveys are typically very similar across countries, and the data derived from these surveys are generally much more comparable than data obtained from other sources. Consequently, a strict preference
7
All labour force participation data in the EAPEP input file were selected from the ILO Key Indicators of the Labour Market (KILM) 7th
Edition Database (Geneva, 2011), http://www.ilo.org/kilm. The main sources of data in the KILM include the ILO Labour Statistics
(Laborsta), http://laborsta.ilo.org; the Organization for Economic Development and Cooperation (OECD) Labour Force Statistics
Database, http://www.oecd.org; the Statistical Office of the European Communities (EUROSTAT) European Labour Force Survey (EU
LFS) online database (http://epp.eurostat.ec.europa.eu); ILO Regional Office for Latin America and the Caribbean Labour Analysis and
Information System (SIAL) Project (http://www.oitsial.org.pa/) and the ILO Labour Market Indicators Library (LMIL),
was given to labour force survey data in the selection process. Yet, many developing countries without adequate resources to carry out a labour force survey do report LFPR estimates based on population censuses. Due the need to balance the competing goals of data comparability and data coverage, some population census-based labour force participation rates were included. However, a strict preference was given to labour force survey-based data, with population census-derived estimates only included for countries in which no labour force survey-based participation data exist. Data derived from official government estimates in principle were not included in the dataset as the methodology for producing official estimates can differ significantly across countries and over time, leading to non-comparability. However, bearing in mind that as large a statistical basis as possible is preferable to a fully imputed series, the available official government estimates are kept for 6 countries.8
Selection criterion 2 (age coverage)
Data broken down by 5-year age groups and 65+ are included in the initial input. For example, when the labour force participation rate refers to the total working age population, this observation is not included. Ideally, the reported rate corresponds to the 11 standardized age-groups (15-19, 20-24, 25-29, 30-34, 35-39, 40-44, 45-49, 50-54, 55-59, 60-64 and 65+). For the countries with non-standardised age-groups, two types of harmonisation has been applied; harmonising the lower and upper age limit and harmonising data from larger age bands to the above standard 5-year age bands. Detailed descriptions of these harmonisations can be found in Annex 3.
Selection criterion 3 (geographical coverage)
Regarding the geographical selection criteria, data corresponding to national (i.e. not geographically limited) labour force participation rates or data adjusted to represent national participation rates are included. Labour force participation rates corresponding to only urban or only rural areas are not comparable across countries. This criterion was necessary due to the large differences that often exist between rural and urban labour markets. For four countries in Latin America, the labour force participation rates corresponding to urban areas only were adjusted and estimates derived from these were subsequently included (see Annex 4).
Resulting input data file
Together, these criteria determined the data content of the final input file, which was utilized in the subsequent econometric estimation process (described below). Table 1 provides response rates and total observations by age-group and year. These rates represent the share of total potential (or maximum) observations for which real, cross-country comparable data (after harmonisation adjustments) exist.
8
Table 1. Response rates by year, both sexes combined
Year
Proportion of potential observationsa
Number of observations
1980 0.13 541
1981 0.12 508
1982 0.14 572
1983 0.22 927
1984 0.17 711
1985 0.22 921
1986 0.21 894
1987 0.20 835
1988 0.24 1'023
1989 0.27 1'153
1990 0.26 1'104
1991 0.28 1'161
1992 0.26 1'112
1993 0.29 1'198
1994 0.30 1'248
1995 0.34 1'415
1996 0.31 1'323
1997 0.32 1'343
1998 0.34 1'426
1999 0.35 1'483
2000 0.37 1'552
2001 0.36 1'510
2002 0.36 1'528
2003 0.39 1'628
2004 0.42 1'753
2005 0.45 1'870
2006 0.43 1'802
2007 0.41 1'724
2008 0.45 1'872
2009 0.41 1'704
2010 0.32 1'328
Total 0.30 39'169
a
The potential number of observations for each year is 4'202 data points (11 age-groups x 191 countries x 2 sexes). Hence, the total potential number of observations which covers the time period 1980 to 2010 is 130'262 data points.
In total, comparable data are available for 39'169 out of a possible 130'262 observations, or approximately 30 per cent of the total. It is important to note that while the percentage of real observations is rather low, 174 out of 191 countries (91 per cent) reported labour force participation rates in at least one year during the 1980 to 2010 reference period. 9 Thus, some information on LFPR is known about the vast majority of the countries in the sample.
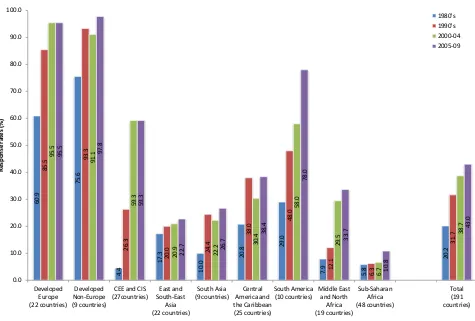
There is very little difference among the 11 age-groups with respect to data availability. This is primarily due to the fact that countries that report LFPR in a given year tend to report for all age groups. On the other hand, there is a clear variation in response by year. Figure 2 shows the evolution of the response rates by estimation group over the last 20 years. Certainly, coverage tends to improve over time, as the lowest
9
coverage occurred in the early 1980s (only 20.2 per cent of the total potential number of observations is reported over this period). While the overall response rate is approximately 30 per cent, response rates vary substantially among the different regions of the world. In particular, in CEE and CIS and South America the response rates improved by about 55 and 49 percentage points, respectively. Sub-Saharan Africa followed by East Asia has the lowest response rates while at the same time the progress in improving the probability of response over time has been relatively low.
Figure 2. Response rates by estimation group and selected time periods (%)
*The response rate is calculated by dividing the number of the countries who report labour force participation rates with the number of countries per groupXyears.
2.c. Missing value estimation procedure
Overview
This section describes the basic missing value estimation model developed to produce the EAPEP historical database. The model was developed by the ILO Employment Trends Unit as part of its ongoing responsibility for the development and analysis of global and regional aggregates of key labour market indicators including labour force, employment, unemployment, employment status, employment by sector and working poverty, among others.10 The present methodology contains four steps. First, in order to ensure realistic estimates of labour force participation rates, a logistic transformation is applied to the input data file. Second, a simple interpolation technique is utilized to expand the baseline data in countries that report labour force participation rates in some years. Next, the problem of non-response bias (systematic differences between countries that report data in some years and countries that do not report data in any year) is addressed and a solution is developed to correct for this bias. Finally, a weighted least squares estimation model is applied, which produces the actual country-level LFPR estimates. Each of these steps is described below.
10
A series of background papers on the Trends Unit’s work related to world and regional aggregates including methodological documents
on the relevant econometric models can be found at http://www.ilo.org/trends.
60.9 75.6 4.4 17.3 10.0 20. 8 29.0 7.9 5.8 20.2 85.5 93.3 26.3 20 .0 24.4 38.0 48.0 12.1 6.3 31.7 95.5 91.1 59.3 20.9 22.2 30.4 58 .0 29.5 6.7 38.7 95.5 97.8 59.3 22.7 26.7 38.4 78. 0 33.7 10.8 43.0 0.0 10.0 20.0 30.0 40.0 50.0 60.0 70.0 80.0 90.0 100.0 Developed Europe (22 countries) Developed Non-Europe (9 countries)
Step 1: Logistic transformation
The first step in the estimation process is to transform all labour force participation rates included in the input file. This step is necessary since using simple linear estimation techniques to estimate labour force participation rates can yield implausible results (for instance labour force participation rates of more than 100 per cent). Therefore, in order to avoid out of range predictions, the final input set of labour force participation rates is transformed logistically in the following manner prior to the estimation procedure:
it it it
y y Y
1
ln (1)
where yit is the observed labour force participation rate by sex and age in country i and year t. This transformation ensures within-range predictions, and applying the inverse transformation produces the original labour force participation rates. The specific choice of a logistic function in the present context was chosen following Crespi (2004).
Step 2: Country-level interpolation
The second step in the estimation model is to fill in, through linear interpolation, the set of available information from countries that report in some, but not all of the years in question. In many reporting countries, some gaps in the data do exist. For instance, a country will report labour force participation rates in 1990 and 1995, but not for the years in between. In these cases, a simple linear interpolation routine is applied, in which LFPR estimates are produced using equation 2.
0 0 0
1 0 1
)
( i
i i
it t t Y
t t
Y Y
Y
(2)
In this equation, Yi1 is the logistically transformed labour force participation rate in year t1, which corresponds to the closest reporting year in country i following year t.
Y
i0 is the logistically transformed labour force participation rate in year t0, which is the closest reporting year in country i preceding year t. Accordingly, Yi1 is bounded at the most recent overall reporting year for country i, whileY
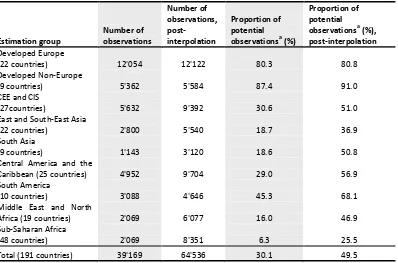
i0 is bounded at the earliest reporting year for country i.Table 2. Response rates by estimation group Estimation group Number of observations Number of observations, post-interpolation Proportion of potential
observationsa (%)
Proportion of potential
observationsa (%),
post-interpolation Developed Europe
(22 countries) 12'054 12'122 80.3 80.8
Developed Non-Europe
(9 countries) 5'362 5'584 87.4 91.0
CEE and CIS
(27countries) 5'632 9'392 30.6 51.0
East and South-East Asia
(22 countries) 2'800 5'540 18.7 36.9
South Asia
(9 countries) 1'143 3'120 18.6 50.8
Central America and the
Caribbean (25 countries) 4'952 9'704 29.0 56.9
South America
(10 countries) 3'088 4'646 45.3 68.1
Middle East and North
Africa (19 countries) 2'069 6'077 16.0 46.9
Sub-Saharan Africa
(48 countries) 2'069 8'351 6.3 25.5
Total (191 countries) 39'169 64'536 30.1 49.5
a
The potential number of observations for each region is calculated by 11 age-groups x number of countries x 2 sexes x (2010-1980+1).
The increase in observations resulting from the linear interpolation procedure is provided in Table 2. This table also provides a picture of the large variation in data availability among the different geographic/economic estimation groups. In total, the number of observations increased from 39'169 to 64'536 – that is, from 30 per cent to 50 per cent of the total potential observations. The lowest data coverage is in sub-Saharan Africa, where the post-interpolation coverage is 25.5 per cent. Post-interpolation coverage reaches 80.8 per cent in the Developed Europe region and 91 per cent in the Developed Non-Europe region. The resulting database represents the final set of harmonized real and estimated labour force participation rates upon which the multivariate weighted estimation model was carried out as described below.
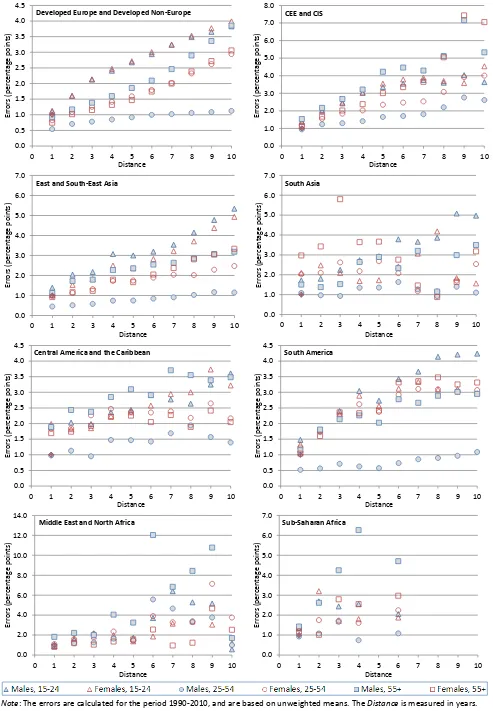
Figure 3 depicts the errors11 that can result from the linear interpolation (method 1). For the sake of parsimony, figure 3 shows only results for youth (15-24 years), prime-age (25-54 years) and elderly (55 years and above) by gender and by region for a range of (symmetric) distance d between the reported rates varying from 1 to 10 years. To calculate these errors, only countries with at least 3 reported years were included. For example, the error in time t for a distance of 1 can be calculated for the countries which report at least three consecutive years and is obtained as follows:
2
/
)
(
ˆ
1 1 ) 1 ( ) 1(d
t
t d
t
t
tt
Y
Y
Y
Y
Y
Similarly, the error in time t for a distance of 10 can be calculated for the countries which report data at t-10, t and t+10 and is calculated as follows:
2
/
)
(
ˆ
10 10 ) 10 ( ) 10(d
t
t d
t
t
tt
Y
Y
Y
Y
Y
11
Firstly, Figure 3 confirms our expectations regarding the increase in the magnitude of prediction errors with the distance length. For all regions and subgroups of the population, the errors at distance 1 are significantly lower than for the next years.
For the prime age, errors for male LFPRs are the lowest across all regions in the world and do not increase much with the distance. The interpolation method is therefore justified for that subgroup of the population, whatever the distance between two available observations. For women in the prime age, the errors are lower than that of the two other age groups but are significantly higher than that of male in the prime age (see notably Latin America).
In general, the errors tend to be the highest for youth (15-24) but this is not true for all regions. This phenomenon concerns in particular developed regions. One interpretation is that youth LFPR are more volatile over time in developed countries and vary more in function of business cycles or other policy determinants than the other subgroups of the population under analysis. For developing countries, the story is different even if as a general rule, the prediction errors for youth are higher than for the prime age.
There is no consistent difference between male and female errors for youth and elderly but the picture is different for the prime-age group, as seen previously.
Figure 3. Prediction errors (method 1) by distance of interpolation, estimation group, age groups and sex
Note: The errors are calculated for the period 1990-2010, and are based on unweighted means. The Distance is measured in years.
0.0 0.5 1.0 1.5 2.0 2.5 3.0 3.5 4.0 4.5
0 1 2 3 4 5 6 7 8 9 10
E rr o rs (pe rc e nt ag e po int s) Distance
Developed Europe and Developed Non-Europe
0.0 1.0 2.0 3.0 4.0 5.0 6.0 7.0 8.0
0 1 2 3 4 5 6 7 8 9 10
E rr o rs ( p e rc e n tage p o in ts ) Distance CEE and CIS
0.0 1.0 2.0 3.0 4.0 5.0 6.0 7.0
0 1 2 3 4 5 6 7 8 9 10
E rr o rs (pe rc e nt ag e po int s) Distance East and South-East Asia
0.0 1.0 2.0 3.0 4.0 5.0 6.0 7.0
0 1 2 3 4 5 6 7 8 9 10
E rr o rs (pe rc e nt ag e po int s) Distance South Asia 0.0 0.5 1.0 1.5 2.0 2.5 3.0 3.5 4.0 4.5
0 1 2 3 4 5 6 7 8 9 10
E rr o rs (pe rc e nt ag e po int s) Distance Central America and the Caribbean
0.0 0.5 1.0 1.5 2.0 2.5 3.0 3.5 4.0 4.5
0 1 2 3 4 5 6 7 8 9 10
E rr o rs (pe rc e nt ag e po int s) Distance South America 0.0 2.0 4.0 6.0 8.0 10.0 12.0 14.0
0 1 2 3 4 5 6 7 8 9 10
E rr o rs (pe rc e nt ag e po int s) Distance Middle East and North Africa
0.0 1.0 2.0 3.0 4.0 5.0 6.0 7.0
0 1 2 3 4 5 6 7 8 9 10
Step 3: Calculation of response-probabilistic weights
Out of 191 countries in the EAPEP database, 17 do not have any reported comparable labour force participation rates over the 1980-2010 period (see footnote 10). This raises the potential problem of non-response bias. That is, if labour force participation rates in countries that do not report data tend to differ significantly from participation rates in countries that do report, basic econometric estimation techniques will result in biased estimates of labour force participation rates for the non-reporting countries, as the sample upon which the estimates are based does not sufficiently represent the underlying heterogeneity of the population.12
The identification problem at hand is essentially whether data in the EAPEP database are missing completely at random (MCAR), missing at random (MAR) or not missing at random (NMAR).13 If the data are MCAR, non-response is ignorable and multiple imputation techniques such as those inspired by Heckman (1979) should be sufficient for dealing with missing data. This is the special case in which the probability of reporting depends neither on observed nor unobserved variables – in the present context this would mean that reporting and non-epo ti g ou t ies a e esse tiall si ila i oth thei o se a le a d u o se a le characteristics as they relate to labour force participation rates. If the data are MAR, the probability of sample selection depends only on observable characteristics. That is, it is known that reporting countries are different from non-reporting countries, but the factors that determine whether countries report data are identifiable. In this case, econometric methods incorporating a weighting scheme, in which weights are set as the inverse probability of selection (or inverse propensity score), is one common solution for correcting for sample selection bias. Finally, if the data are NMAR, there is a selection problem related to unobservable differences in characteristics among reporters and non-reporters, and methodological options are limited. In cases where data are NMAR, it is desirable to render the MAR assumption plausible by identifying covariates that impact response probability (Little and Hyonggin, 2003).
Given the important methodological implications of the non-response type, it is useful to examine characteristics of reporting and non-reporting countries in order to determine the type of non-response present in the EAPEP database. Table 3 confirms significant differences between reporting and non-reporting countries in the sample.
Table 3. Per-capita GDP and population size of reporting and non-reporting countries
Reporters (174 countries)
Non-reporters (17 countries)
Mean per-capita GDP, 2010(2005 International $) 13'460 5'262 Median per-capita GDP, 2010 (2005 International $) 7'694 2'379
Mean population, 2010 (millions) 38.4 11.4
Median population, 2010 (millions) 7.6 5.3
Sources: World Bank, World Development Indicators Database 2011; UN, World Population Prospects 2010 Revision Database.
The table shows that reporting countries have considerably higher per capita GDP and larger populations than non-reporting countries. In the context of the EAPEP database, it is important to note that countries with low per-capita GDP also tend to exhibit higher than average labour force participation rates, particularly among women, youth and older individuals. This outcome is borne mainly due to the fact that the poor often have few assets other than their labour upon which to survive. Thus, basic economic necessity often drives the poor to work in higher proportions than the non-poor. As economies develop, many individuals (particularly women) can afford to work less, youth can attend school for longer periods, and consequently,
12
For more information, see Crespi (2004) and Horowitz and Manski (1998). 13
overall participation rates in developing economies moving into the middle stages of development tend to decline.14
It appears that factors exist that co-determine the likelihood of countries to report labour force participation rates in the EAPEP input dataset and the actual labour force participation rates themselves. The missing data do not appear to be MCAR. Due to the existence of data (such as per-capita GDP and population size) that exist for both responding and non-responding countries and that are related to response likelihood, to the aim is to render the MAR assumption plausible and thus to correct for the problem of non-response bias.15 This correction can be made while using the fixed-effects panel estimation methods described below, by
appl i g ala i g eights to the sample of reporting countries. The remainder of the present discussion describes this weighting routine in greater detail.
The basic methodology utilized to render the data MAR and to correct for sample selection bias contains two
steps. The fi st step is to esti ate ea h ou t ’s p o a ilit of epo ti g labour force participation rates. In the EAPEP input dataset, per-capita GDP, population size, year dummy variables and membership in the Highly Indebted Poor Country (HIPC) Initiative represent the set of independent variables used to estimate response probability.16
Following Crespi (2004) and Horowitz and Manski (1998), we characterize each country in the EAPEP input dataset by a vector (yit, xit, wit, rit), where y is the outcome of interest (the logistically transformed labour force participation rate), x is a set of covariates that determine the value of the outcome and w is a set of covariates that determine the probability of the outcome being reported. Finally, r is a binary variable indicating response or non-response as follows:
report
not
does
i
if
reports
i
if
r
it0
1
(3)
Equation 4 indicates that there is a linear function whereby the likelihood of reporting labour force participation rates is a function of the set of covariates:
it it
it
w
r
*
'
(4)where a country reports if this index value is positive (
r
it*
0
). is the set of regression coefficients and it is the error term. Assuming a symmetric cumulative distribution function, the probability of reporting labour force participation rates can be written as in equation 5.
'
it
i F w
P (5)
The functional form of F depends on the assumption made about the error term it. As in Crespi (2004), we assume that the cumulative distribution is logistic, as shown in equation 6:
' ''
exp
1
exp
it it it
w
w
w
F
(6)
14
See ILO, KILM 7th
Edition, (Geneva, ILO, 2011) and Standing, G. Labour Force Participation and Development (Geneva, ILO, 1978).
15
Indeed, according to Little and Hyonggin (2003), the most useful variables in this process are those that are predictive of both the missing values (in this case labour force participation rates) and of the missing data indicator. Per-capita GDP is therefore a particularly attractive indicator in the present context.
16
It is necessary to estimate equation 6 through logistic regression, which is carried out by placing each country into one of the 9 estimation groups listed in Table 2. The regressions are carried out for each of the 11 standardized age-groups and for males and females. The results of this procedure provide the predicted response probabilities for each age-group within each country in the EAPEP dataset.
The second step is to calculate country weights based on these regression results and to use the weights to
ala e the sa ple du i g the esti atio p o ess. The p edi ted espo se p o a ilities al ulated i
equation 6 are used to compute weights defined as:
)
ˆ
,
|
1
(
1
)
(
it itit it
w
r
P
r
P
w
s
(7)The weights given by equation 7 are calculated as the ratio of the proportion of non-missing observations in the sample (for each age-group and each year) and the reporting probability estimated in equation 6 of each age-group in each country in each year. By calculating the weights in this way, reporting countries that are more similar to the non-reporting countries (based on characteristics including per-capita GDP, population size and HIPC membership) are given greater weight and thus have a greater influence in estimating labour force participation rates in the non-reporting countries, while reporting countries that are less similar to non-reporting countries are given less weight in the estimation process. As a result, the weighted sample looks more similar to the theoretical population framework than does the simple un-weighted sample of reporting countries.
Step 4: Weighted multivariate estimation
The final step is the estimation process itself. Countries are again divided into the 9 estimation groups listed above, which were chosen on the combined basis of broad economic similarity and geographic proximity.17 Having generated response-probabilistic weights to correct for sample selection bias, the key issues at hand include 1) the precise model specification and 2) the choice of independent variables for estimating labour force participation.
In terms of model specification, taking into account the database structure and the existence of unobserved heterogeneity among the various countries in the EAPEP input database, the choice was made to use panel data techniques with country fixed effects, with the sample of reporting countries weighted using the sit(w) to correct for non-response bias.18B usi g fi ed effe ts i this a , the le el of k o la ou force participation rates in each reporting country is taken into account when estimating missing values in the reporting country, while the non-reporting countries borrow the fixed effect of a similar reporter country. The similarity is simply based on economic and social factors, such as per capita GDP and general cultural norms. More formally, the following linear model was constructed (and run on the logistically transformed labour force participation rates):
it it i
it x e
Y
'
(8)where αi is country-specific fixed effect, χit is a set of explanatory covariates of the labour force participation
rate and eit is the error term. The main set of covariates included is listed in table 4.19
17
Schaible (2000) discusses the use of geographic proximity and socio-economic status to define estimation domains for data estimation including for ILO labour force participation rates. See also Schaible and Mahadevan-Vijaya (2002).
18
Crespi (2004) provides a test comparing the bias resulting from different missing value estimation models and finds that the weighted least squares model using fixed-effects provides the smallest relative bias when estimating unemployment rates.
19
Table 4. Independent variables in fixed-effects panel regression
Variable Source
Per-capita GDP,
Per-capita GDP squared World Bank, World Development
Indicators 2011 and IMF, World Economic Outlook April 2011
Real GDP growth rate, Lagged real GDP growth rate Share of population aged 0-14, Share of population aged 15-24, Share of population aged 25-64
United Nations, World Population Prospects 2010 Revision Database
In the context of the EAPEP database, there are two primary considerations in selecting independent variables for estimation purposes. First, the selected variables must be robust correlates of labour force participation, so that the resulting regressions have sufficient explanatory power. Second, in order to maximize the data coverage of the final EAPEP database, the selected independent variables must have sufficient data coverage.
Overall, the determinants of the participation rate can be broken down into structural or long-term factors, cyclical and accidental factors. The level of development has a clear impact on LFPRs over time (World Bank 2012) and can capture movements in other structural factors. Structural factors affecting the LFPRs include policy and legal determinants (e.g. flexibility of working-time arrangements, taxation, family support, retirement schemes, apprenticeships, work permits, unemployment benefits, and minimum wage) as well as other determinants such as demographic and cultural factors, level of education, technological progress and availability of transportation. Some of the key findings in the literature suggest that the more flexible the working-time arrangements are, the higher the LFPRs. In addition, taxation of second earners (relative to single earners) usually has a negative impact on female LFPR, while childcare subsidies and paid parental leave usually have a positive impact on LFPR (Jaumotte 2003).Prolongation of studies can decrease the LFPRs while increases in the age of marriage and declines in fertility tend to increase the LFPRs for women. Cultural factors such as strong family ties or religion have a strong impact on LFPR for some subgroups of the population. For example, in many countries, religious or social norms may discourage women from undertaking economic activities. These structural factors are the main drivers of the long-term patterns in the data. Changes in policy and legal determinants (e.g. changes in retirement and pre-retirements schemes) can result in important shifts in participation rates from one year to another.
Cyclical factors refer to the overall economic and labour market conditions that influence the LFPR. In other words, labour demand has an impact on labour supply. In times of strong slowdown or recession, two effects
In terms of variables related to economic growth and development, as mentioned above, per-capita GDP is often strongly associated with labour force participation.20 This, together with the substantial coverage of the indicator made it a prime choice for estimation purposes. However, given that the direction of the relationship between economic development and labour force participation can vary depending on a
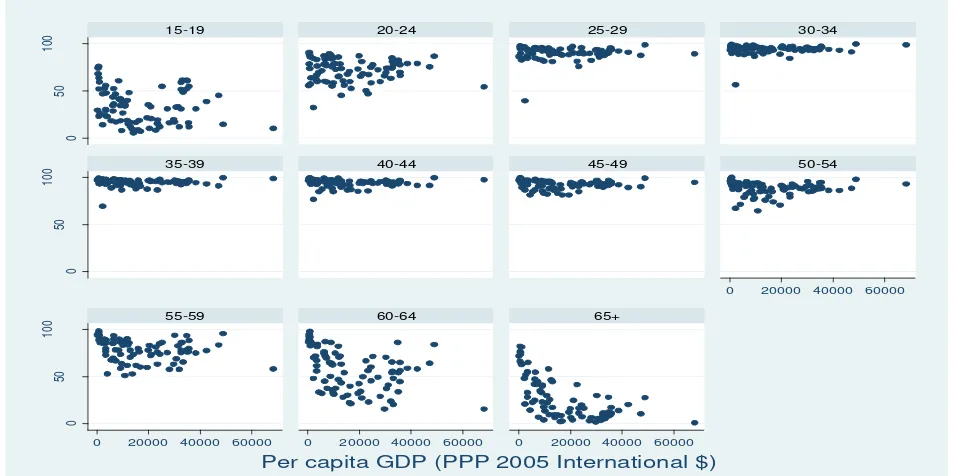
ou t ’s stage of de elop e t, the s ua e of this term was also utilized to allow for this type of non-linear relationship.21 Figure 4 depicts clearly that this relationship varies by both sex and age group. For men and women in the prime-age, there is no relationship, statistically speaking. For both men and women aged 15 to 19 years, and those aged above 55 years, there is a clear U-relationship between per capita GDP and labour force participation rate. Furthermore, annual GDP growth rates were used to incorporate the relationship between participation and the state of the macro-economy.22 The lag of this term was also included in order to allow for delays between shifts in economic growth and changes in participation.
Figure 4. Labour force participation rates by sex and age-group, and per capita GDP, 2005 (83 countries with reported data)
20
See also Nagai and Pissarides (2005), Mammen and Paxon (2000) and Clark et al. (1999). 21
Whereas economic development in the poorest countries is associated with declining labour force participation (particularly among women and youth), in the middle- and upper- income economies, growth in GDP per capita can be associated with rising overall
participation rates – often driven by rising participation among newly empowered women. This phenomenon is the so-called “U-shaped”
relationship between economic development and participation. See ILO, KILM 4th
Edition and Mammen and Paxon (2000). 22
See Nagai, L. and Pissarides (2005), Fortin and Fortin (1998) and McMahon (1986).
0
50
100
0
50
100
0
50
100
0 20000 40000 60000
0 20000 40000 60000 0 20000 40000 60000 0 20000 40000 60000
15-19 20-24 25-29 30-34
35-39 40-44 45-49 50-54
55-59 60-64 65+
Note: 2005 is selected because it represents a pre-crisis year for which the response rate is the highest. Source: KILM 1b, 7th Edition
Changes in the age-structure of populations can also affect labour force participation rates over time. This happens at the country-wide level, since different age cohorts tend to have different labour force participation rates, and thus changes in the aggregate age structure of a population can affect the overall participation rate. More importantly for the present analysis, however, is the potential impact that demographic changes can have on intra age-group participation rates within countries. Changes in population age structure can affect the overall burden for caring for dependents at home, thus affecting
i di iduals’ de isio s to pa ti ipate i la ou a kets. This a ha e a pa ti ula l i po ta t effe t o o e ’s decisions to enter into work.23 In order to incorporate these types of demographic effects, the share of population aged 0-14 (young age-dependent), 15-24 (working-age youth) and 25-64 (adults below 65 years) were incorporated to varying degrees in regions in which an important relationship between participation and demographics was found. These variables are by definition correlated and thus increase the presence of multicolinearity in the regressions. However it was determined that this did not present a prohibitively significant problem in the context of the present estimation procedure.
In all estimation groups, a set of country dummy variables was used in each regression in order to capture country fixed effects. A preliminary examination of the input data revealed that countries in the South Asia estimation group exhibit a particularly large degree of heterogeneity in labour force participation rates, especially with regard to female participation. In order to estimate robust labour force participation rates in non-reporting countries in this estimation group, it was necessary to introduce a dummy variable to further subdivide economies in the region based on observed national labour market characteristics and prevailing cultural norms with regard to male and female labour market participation. This variable was significant in more than 70 per cent of the regressions carried out for the estimation group. Finally, the constant i, given in equation 8 is country-specific and captures all the persistent idiosyncratic factors determining the labour force participation rate in each country. For 11 out of the 17 countries which do not have any reported comparable labour force participation rates over the 1980-2010 period the fixed effect of a counterpart economy has been chosen instead of the regional average. The end result of this process is a balanced panel containing real and imputed cross-country comparable labour force participation rates for 191 countries over the period 1990-2010. Furthermore, for the above mentioned 17 countries a smoothing procedure
23
Bloom and Canning (2005), Falcão and Soares (2005), O’Higgins (2003), Clark et al. (1999), Fullerton (1999) and McMahon (1986)
provide some examples of the relationships between population structure (and demographic change) and labour force participation rates for different groups of the population.
0
50
100
0
50
100
0
50
100
0 20000 40000 60000
0 20000 40000 60000 0 20000 40000 60000 0 20000 40000 60000
15-19 20-24 25-29 30-34
35-39 40-44 45-49 50-54
55-59 60-64 65+
similar to the one described in Annex 3 has been applied in order to achieve consistency across age groups.24 In the final step, these labour force participation rates are multiplied by the total population figures given in the United Nations World Population Prospects 2010 Revision database, which gives the total labour force in each of the 191 countries, broken down by age-group and sex.
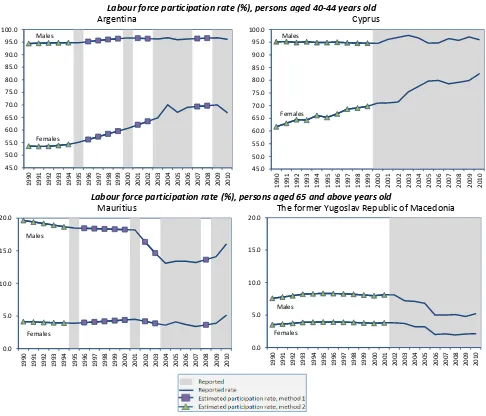
Figure 5 illustrates four examples of the resulted time series as estimated by methods 1 and 2. The upper panel shows the full time series of LFPRs for men and women aged 40 to 44 years old for Argentina and Cyprus, while the lower panel shows the time series of LFPRs for men and women aged 65 years and above for The former Yugoslav Republic of Macedonia and Mauritius. The shaded bars indicate years for which the LFPRs are reported, method 1 estimates are indicated by the squares and method 2 estimates by triangles. By definition, method 1 produces straight lines between reported rates. Method 2 can also produce very smooth lines but this depends on the model specification, estimated parameters and the changes in the explanatory variables. For the age group 40 to 44 years old in the two countries presented in figure 5, there has been increasing trend of female LFPRs. However, the trend back-casted from method 2 are different in Cyprus and Argentina. In Argentina, the trend in female LFPR prior to 1995 (first data point) is rather flat while in Cyprus, the estimated trend is more pronounced between 1990 and 2000 (first data point).
Figure 5. Examples of estimation methods 1 and 2
Labour force participation rate (%), persons aged 40-44 years old
Argentina Cyprus
Labour force participation rate (%), persons aged 65 and above years old
Mauritius The former Yugoslav Republic of Macedonia
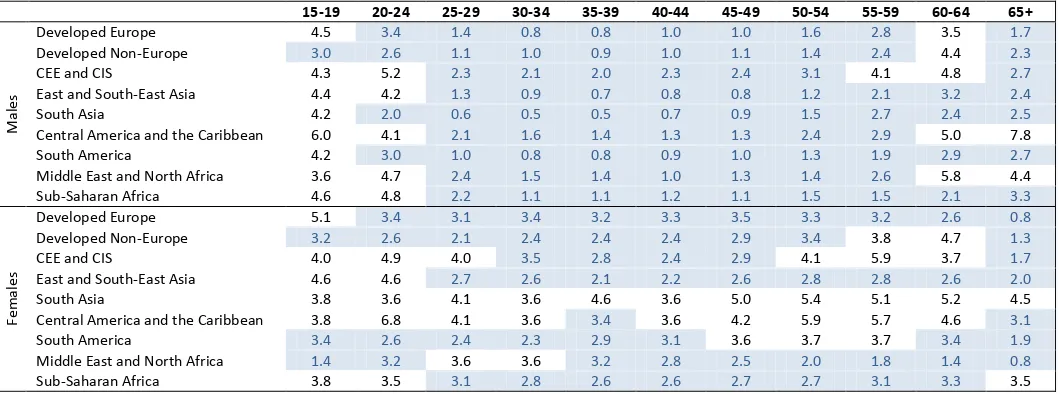
Figure 3 and table 5 present the errors by region, age and sex which result from method 2. The shaded cells represent errors below 3.5 percentage points. These errors are calculated as the percentage point difference
24
This is necessary because equation 8 runs separately for males and females and for the several age groups. Hence, the current model cannot assure consistency across the life span.
between the predicted values as they result from method 2 and the reported rates. The highest errors can be found for the younger groups.
Table 5. Prediction errors (method 2), by age group, sex and estimation group
15-19 20-24 25-29 30-34 35-39 40-44 45-49 50-54 55-59 60-64 65+
M
al
e
s
Developed Europe 4.5 3.4 1.4 0.8 0.8 1.0 1.0 1.6 2.8 3.5 1.7 Developed Non-Europe 3.0 2.6 1.1 1.0 0.9 1.0 1.1 1.4 2.4 4.4 2.3 CEE and CIS 4.3 5.2 2.3 2.1 2.0 2.3 2.4 3.1 4.1 4.8 2.7 East and South-East Asia 4.4 4.2 1.3 0.9 0.7 0.8 0.8 1.2 2.1 3.2 2.4 South Asia 4.2 2.0 0.6 0.5 0.5 0.7 0.9 1.5 2.7 2.4 2.5 Central America and the Caribbean 6.0 4.1 2.1 1.6 1.4 1.3 1.3 2.4 2.9 5.0 7.8 South America 4.2 3.0 1.0 0.8 0.8 0.9 1.0 1.3 1.9 2.9 2.7 Middle East and North Africa 3.6 4.7 2.4 1.5 1.4 1.0 1.3 1.4 2.6 5.8 4.4 Sub-Saharan Africa 4.6 4.8 2.2 1.1 1.1 1.2 1.1 1.5 1.5 2.1 3.3
F
e
m
al
e
s
Developed Europe 5.1 3.4 3.1 3.4 3.2 3.3 3.5 3.3 3.2 2.6 0.8 Developed Non-Europe 3.2 2.6 2.1 2.4 2.4 2.4 2.9 3.4 3.8 4.7 1.3 CEE and CIS 4.0 4.9 4.0 3.5 2.8 2.4 2.9 4.1 5.9 3.7 1.7 East and South-East Asia 4.6 4.6 2.7 2.6 2.1 2.2 2.6 2.8 2.8 2.6 2.0 South Asia 3.8 3.6 4.1 3.6 4.6 3.6 5.0 5.4 5.1 5.2 4.5 Central America and the Caribbean 3.8 6.8 4.1 3.6 3.4 3.6 4.2 5.9 5.7 4.6 3.1 South America 3.4 2.6 2.4 2.3 2.9 3.1 3.6 3.7 3.7 3.4 1.9 Middle East and North Africa 1.4 3.2 3.6 3.6 3.2 2.8 2.5 2.0 1.8 1.4 0.8 Sub-Saharan Africa 3.8 3.5 3.1 2.8 2.6 2.6 2.7 2.7 3.1 3.3 3.5
Note: The errors are measured in percentage points. The shaded cells indicate errors below 3.5 percentage points.
Step 5: Judgmental adjustments
For a few countries, the estimates derived from the weighted panel model (see previous section) have been adjusted when the estimates were not judged to be realistic in comparison with real data observed in similar countries.
This happens notably for some countries for which the proxy variables used in the panel model are poor proxies of the determinants of changes in LFPR. Cases in point include countries with a very volatile GDP over time, due to a strong dependence on oil or other mineral commodities (copper, gold). In this context, the trends derived from the panel model are often too volatile.
Other types of information are also used. These include the proportion of immigrant workers in the country and HIV prevalence. In this edition of the EAPEP database, the information was used primarily to check and manually adjust the estimated historical values. For example, in countries with high HIV prevalence, LFPR for all affected subgroups of the population (including male in the prime age) should be lower than in other countries.
3. Strengths, limitations and future work
In this edition, the priority is to fully exploit information reported by NSOs, even if some adjustments need to be made. For the sake of continuous improvement, the strengths and weaknesses of this edition are described hereafter.
The strengths are:
(i) A limitation is that the degree of confidence regarding each published data point varies significantly across country. The confidence in each data point depends on the availability and consistency of historical data. However, in this edition, no confidence intervals are published since the final estimates are derived from various steps. There are two extreme sets of countries: the ones for which historical data are available in a consistent manner over time (e.g., OECD countries) and those for which there is no consistent historical data at all (the list of 17 countries mentioned in section 2). It is advised to consider the estimates (as well as the projections) derived for the latter group as purely indicative.
(ii) The panel regressions model each time series (LFPR by age group and by sex) independently and the consistency is checked afterwards, making the exercise extremely time consuming. Moreover, because there are many regression models (176, 11 age groups x 2 sexes x 8 regions), it is further time consuming to modify the models.
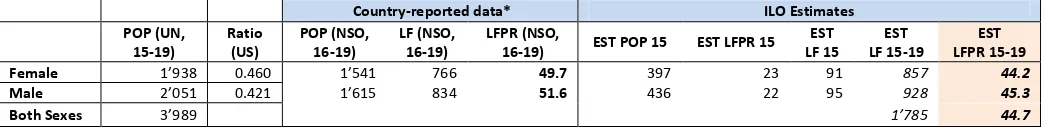
(iii) The proportional adjustments made in order to harmonise the data have some limitations, since in the absence of complete information over time, some simplifying assumptions of constant patterns over time have to be made. An example of this limitation is the following. In the case of harmonisation adjustments of age band 16-19, applying the proportional adjustment based on US data for other countries supposes a priori similar patterns between the US and those countries, and similar changes over time. However, the proportion of 15 year olds that work compared to the 16-19 age group, may differ from the US proportion, simply due to different policies regarding apprenticeships and other work-study programmes.
(iv) Some adjustments have not been made in this edition. Cases in point are the exclusion of military forces and prisoners from the surveys, the difference in the treatment of subsistence workers across countries and the use of different reference periods (whole year, month).
(v) The linear interpolation and the weighted panel regressions are not based on the same assumptions. The linear interpolation assumes that the changes in LFPR due to cyclical and accidental factors are negligible compared to structural ones. The inclusion of linearly interpolated values in the sample used to estimate the panel regressions introduces linearity artificially in the model.
(vi) For some regions, there are not enough data (e.g. “u ‐“aha an Africa), making the estimates far less robust. The parameters of the panel models are run on the sample of historical data plus the interpolated data which might not be the ultimate solution to the problem of scarce reported series. In addition, the GDP per capita is too volatile for a few economies that rely strongly on oil and/or other mineral commodities. In this context, it becomes a poor proxy for what it is meant to capture (wealth per inhabitant, existence of social security schemes, access to education, etc.).
Future work should address each of the above mentioned limitations, bearing in mind the costs and benefits of each improvement. As mentioned above, more adjustments could be done in the future (treatment of military forces, prisoners, subsistence workers and the use of different reference periods). Also, for some
ou t ies fo hi h the e is o data at all, i o‐datasets of thi d ou t ies ould be used as an alternative to econometric models (e.g., using micro-data from some regions in Pakistan for estimating LFPR in Afghanistan).
Regarding the estimating phases, the number of estimation models could be reduced and dummy variables
fo su ‐ egions and for countries with similar labour markets (e.g., in terms of share of immigrant workers,
regressions would be estimated only on the basis of historical data and linear interpolation should no longer be used as such. Also, some other structural variables can be considered (literacy rates, life expectancy, educational variables), provided that complete time series are available. Another track to explore is to impose some consistency between estimates of different subgroups of the population. For example, modeling the LFPR at a more aggregate level (e.g., at the p i e age odel ‐ athe tha at the -year interval level.
Finally, in an ideal world, the processes for estimating and projecting the LFPRs would be derived from a common model. Different model specifications could be imagined for different country groupings which would be defined on the basis of available data.
4. Bibliography
Bloom, D. a d Ca i g, C. . Glo al de og aphi ha ge: Di e sio s a d e o o i sig ifi a e . Harvard Initiative for Global Health, Working Paper No. 1.
Cla k, R., Yo k, A. a d A ke , R. . E o o i de elop e t a d la ou fo e pa ti ipatio of olde
persons . Populatio Resea h a d Poli Re ie , : -432.
C espi, G. . I putatio , esti atio a d p edi tio usi g the Ke I di ato s of the La ou Ma ket KILM data set . E plo e t “t ateg Pape / , Ge e a, ILO).
Duval R., M. Eris and D. Furce i. . The Effects of Downturns on Labour Force Participation: Evidence and Causes . Economics Department Working Paper No. 875. OECD. Paris.
Fal ão, B. a d “oa es, R. . The de og aphi di isio a d the se ual di isio of la o . CDDRL, “ta fo d
Institute on International Studies, No. 50, September, 2005.
Fo ti , M. a d Fo ti , P. . The ha gi g la ou fo e pa ti ipatio of Ca adia s, -1996: Evidence
f o a pa el of si de og aphi g oups . Applied Resea h B a h, “t ategi Poli , Human Resources Development Canada, October 1999.
Fulle to , H. . La o fo e pa ti ipatio ates: ea s of ha ge, -98 and 1998- . Mo thl Labor Review, Dec. 1999. US Bureau of Labor Statistics, Washington, DC.
Heckman J. 1979. “a ple sele tio as a spe ifi atio e o , E o o et i a, ol. , , -161.
Houriet-Segard and Pasteels. 2011. "Projections of Economically Active Population. An Inventory of National and International Methodologies. ILO Department of Statistics WORKING PAPER, Forthcoming (2011).
Ho o itz J.L., a d Ma ski C.F. . Ce so i g of out o es a d eg esso s due to su e o espo se: Ide tifi atio a d esti atio usi g eights a d i putatio , Jou al of E o o et i s, ol. , -58.
Jaumotte J. 2003. Female labour force participation: past trends and main determinants in OECD countries. OECD Economics Department Working Papers, No. 376.
Kapsos “. . Wo ld a d egio al t e ds i la ou fo e pa ti ipatio : Methodologies a d ke esults ,
Economic and Labour Market Papers 2007/1, Geneva, ILO.
ILO 2009. ILO Estimates and projections of the economically active population: 1980-2020 (Fifth edition). Methodological description.
International Monetary Fund. 2011. World Economic Outlook Database. September 2011.
Little, R. a d H o ggi , A. . Ro ust likelihood-based analysis of multivariate data with issi g alues . University of Michigan Department of Biostatistics Working Paper Series 2003/5.
Ma e , K. a d Pa o , C. . Wo e ’s o k a d e o o i de elop e t . Journal of Economic Perspectives, Volume 14: Number 4, 141-164.
M Maho , P. . A international comparison of labour force participation, 1977- Mo thl La o Review, Vol 109, No. 5.
Nagai, L. a d Pissa ides, C. . T e ds i la ou suppl a d e o o i g o th . Center for Economic Performance, London School of Economics.
Nicoletti, C. 2002. Correcting for sample selection bias: Alternative estimators Compared. ISER, University of Essex.
O’Higgi s, N. . T e ds i the outh la ou a ket i de elopi g a d t a sitio ou t ies . “o ial
Protection Discussion Paper Series No. 321. World Bank, 2003.
OECD 2010. The Impact of the Economic Crisis on Potential Output. Working Party No. 1 on Macroeconomic and Structural Policy Analysis ECO/CPE/WP1(2010)3. P.13.
“ hei le, W. . Methods fo p odu i g o ld a d egio al esti ates fo selected key indicators of the
la ou a ket .
Scheible, W. and Mahadevan-Vija a, R. . Wo ld a d egio al esti ates fo sele ted ke i di ato s of
the la ou a ket , ILO E plo e t Pape / . Ge e a, ILO
Standing, G. 1978. Labour Force Participation and Development. Geneva, ILO. United Nations. World Population Prospects: 2010 Revision Population Database. World Bank, World Development Indicators Database 2011.
ANNEX 1: Country composition of each sub-regional grouping
AFRICA
Eastern Africa Burundi, Comoros, Djibouti, Eritrea, Ethiopia, Kenya, Madagascar, Malawi,
Mauritius, Mozambique, Rwanda, Réunion, Somalia, Tanzania, United Republic of, Uganda, Zambia, Zimbabwe
Middle Africa Angola, Cameroon, Central African Republic, Chad, Congo, Congo, Democratic
Republic of, Equatorial Guinea, Gabon, Sao Tome and Principe
Northern Africa Algeria, Egypt, Libyan Arab Jamahiriya, Morocco, Sudan, Tunisia, Western Sahara
Southern Africa Botswana, Lesotho, Namibia, South Africa, Swaziland
Western Africa Benin, Burkina Faso, Cape Verde, Côte d'Ivoire, Gambia, Ghana, Guinea, Guinea-Bissau, Liberia, Mali, Mauritania, Niger, Nigeria, Senegal, Sierra Leone, Togo
NORTHERN AMERICA Canada, United States LATIN AMERICA AND THE CARIBBEAN
Caribbean Aruba, Bahamas, Barbados, Cuba, Dominican Republic, Grenada, Guadeloupe, Haiti,
Jamaica, Martinique, Netherlands Antilles, Puerto Rico, Saint Lucia, Saint Vincent and the Grenadines, Trinidad and Tobago, Virgin Islands (US)
Central America Belize, Costa Rica, El Salvador, Guatemala, Honduras, Mexico, Nicaragua, Panama
South America Argentina, Bolivia, Brazil, Chile, Colombia, Ecuador, French Guiana, Guyana, Paraguay, Peru, Suriname, Uruguay, Venezuela, Bolivarian Rep. of
ASIA
Eastern Asia China, Hong Kong, China, Japan, Korea, Dem. People's Rep. of, Korea, Republic of, Macau, China, Mongolia
South-Central Asia Afghanistan, Bangladesh, Bhutan, India, Iran, Islamic Rep. of, Kazakhstan, Kyrgyzstan, Maldives, Nepal, Pakistan, Sri Lanka, Tajikistan, Turkmenistan, Uzbekistan
South-Eastern Asia Brunei Darussalam, Cambodia, Indonesia, Lao People's Dem. Rep., Malaysia, Myanmar, Philippines, Singapore, Thailand, Timor-Leste, Viet Nam
Western Asia Armenia, Azerbaijan, Bahrain, Cyprus, Georgia, Iraq, Israel, Jordan, Kuwait, Lebanon, Oman, Qatar, Saudi Arabia, Syrian Arab Republic, Turkey, United Arab Emirates, West Bank and Gaza Strip, Yemen, Republic of
Eastern Europe Belarus, Bulgaria, Czech Republic, Hungary, Moldova, Republic of, Poland, Romania, Russian Federation, Slovakia, Ukraine
Northern Europe Channel Islands, Denmark, Estonia, Finland, Iceland, Ireland, Latvia, Lithuania, Norway, Sweden, United Kingdom
Southern Europe Albania, Bosnia and Herzegovina, Croatia, Greece, Italy, Macedonia, The former Yugoslav Rep. of, Malta, Montenegro, Portugal, Serbia, Slovenia, Spain
Western Europe Austria, Belgium, France, Germany, Luxembourg, Netherlands, Switzerland
OCEANIA
Australia-New Zealand Australia, New Zealand
Melanesia Fiji, New Caledonia, Papua New Guinea, Solomon Islands, Vanuatu
Micronesia Guam
ANNEX 2: Tables of regression specifications by region, sex and age group
Females
1 Developed Europe
15-19 20-24 25-29 30-34 35-39 40-44 45-49 50-54 55-59 60-64 65+
Per-capita GDP x x x x x x x x x x x
Per-capita GDP squared x x x x x x x x x
Real GDP growth rate x x x x x x x x x x x
Lagged real GDP growth rate x x x x x x x x x x x
Share of population aged 0-14
Share of population aged 15-24
Share of population aged 25-64
R-squared 0.852 0.833 0.838 0.870 0.913 0.926 0.927 0.946 0.950 0.934 0.864
2 Developed Non-Europe
15-19 20-24 25-29 30-34 35-39 40-44 45-49 50-54 55-59 60-64 65+
Per-capita GDP x x x x x x x x x x x
Per-capita GDP squared x x x x x x x x x x x
Real GDP growth rate x x x x x x x x x x x
Lagged real GDP growth rate x x x x x x x x x x x
Share of population aged 0-14
Share of population aged 15-24
Share of population aged 25-64
R-squared 0.950 0.778 0.875 0.892 0.877 0.890 0.896 0.892 0.863 0.675 0.706
3 CEE and CIS
15-19 20-24 25-29 30-34 35-39 40-44 45-49 50-54 55-59 60-64 65+
Per-capita GDP x x x x x x x x x x x
Per-capita GDP squared x x x x x x x x x x x
Real GDP growth rate
Lagged real GDP growth rate
Share of population aged 0-14
Share of population aged 15-24
Share of population aged 25-64
R-squared 0.573 0.536 0.627 0.615 0.661 0.733 0.804 0.856 0.765 0.824 0.868
4 East & South-East Asia (& the Pacific)
15-19 20-24 25-29 30-34 35-39 40-44 45-49 50-54 55-59 60-64 65+
Per-capita GDP x x x x x x x x x x x
Per-capita GDP squared x x x x x
Real GDP growth rate
Lagged real GDP growth rate
Share of population aged 0-14
Share of population aged 15-24
Share of population aged 25-64
R-squared 0.913 0.887 0.940 0.955 0.957 0.943 0.936 0.921 0.938 0.959 0.951
5 South Asia
15-19 20-24 25-29 30-34 35-39 40-44 45-49 50-54 55-59 60-64 65+
Per-capita GDP
Per-capita GDP squared
Real GDP growth rate
Lagged real GDP growth rate
Share of population aged 0-14 x x x x x x x x x x x
Share of population aged 15-24 x x x x x x x x x x x
Share of population aged 25-64 x x x x x x x x x x x
dummy x x x x x x x x x x x
Females
6 Central America and the Caribbean
15-19 20-24 25-29 30-34 35-39 40-44 45-49 50-54 55-59 60-64 65+
Per-capita GDP x x x x x x