Full Terms & Conditions of access and use can be found at
http://www.tandfonline.com/action/journalInformation?journalCode=vjeb20
Journal of Education for Business
ISSN: 0883-2323 (Print) 1940-3356 (Online) Journal homepage: http://www.tandfonline.com/loi/vjeb20
Academic Attributes of College Freshmen That
Lead to Success in Actuarial Studies in a Business
College
Richard Manning Smith & Phyllis Schumacher
To cite this article: Richard Manning Smith & Phyllis Schumacher (2006) Academic Attributes of College Freshmen That Lead to Success in Actuarial Studies in a Business College, Journal of Education for Business, 81:5, 256-260, DOI: 10.3200/JOEB.81.5.256-260
To link to this article: http://dx.doi.org/10.3200/JOEB.81.5.256-260
Published online: 07 Aug 2010.
Submit your article to this journal
Article views: 51
View related articles
ABSTRACT.The authors studied
beginning undergraduate actuarial concen-trators in a business college. They identi-fied four variables (math Scholastic Apti-tude Test [SAT] score, verbal SAT score, percentile rank in high school graduating class, and percentage score on a college mathematics placement exam) that were available for entering college students that distinguished freshman actuarial majors who completed the major from those who changed concentrations at some point before completing the major. In addition, the authors developed a logistic regression model using the same variables that pre-dicted the probability of a student being a member of the actuarial graduates or the actuarial dropouts. This information is expected to improve the ability of teachers to advise prospective and beginning actuar-ial students as to their likelihood of com-pleting this challenging concentration and, thereby, qualifying for an entry-level posi-tion in the actuarial field.
Copyright © 2006 Heldref Publications
draws students who have enjoyed math-ematics in high school and who are interested in applying mathematics to a business career.
Over the years, Bryant has had many freshmen begin with the belief or hope that they are good enough to succeed in the mathematics courses required to complete the actuarial concentration but turn out not to be up to the task. At some point during their pursuit of the actuari-al concentration, mostly in their fresh-man or sophomore years, a substantial number of students drop out of this con-centration for various reasons. Students may decide that they are more interest-ed in some other concentration within the college of business or another major within the university. Most of these stu-dents have remained at Bryant. In addi-tion, students may switch majors because they lose interest in mathemat-ics. However, the most frequent reason that students leave the actuarial concen-tration appears to be that they find the mathematics too difficult. From our experience as instructors, it has always appeared that completing the concentra-tion requires a sufficient combinaconcentra-tion of mathematical ability and knowledge, along with study ability and persistence. From summer orientation before their freshman year through the end of their freshman year and beyond, many stu-dents remain uncertain of the major they want to pursue. Some of these students
obs Rated Almanac recently ranked the actuarial career as the second most desirable career (Krantz, 2002). In addition, the Web site BeAn Actuary.org reported that all previous five editions of Jobs Rated Almanac
beginning in 1998 ranked the actuarial profession as one of the top four most desirable (“Actuary is rated one of the best,” 2005). However, it is relatively unknown among college students. Although the field deserves to be better known, only a small percentage of stu-dents should consider pursuing a con-centration in this field. Because mathe-matics is the primary tool for an actuary, students must have sufficient mathemat-ical ability and interest for this concen-tration to be an appropriate choice for them. Furthermore, having a successful career requires a student to pass actuar-ial exams, many of which are heavily mathematically based. Therefore, a stu-dent with a strong business background and a positive outgoing personality who dislikes mathematics or who is not high-ly mathematicalhigh-ly capable would be ill-advised to pursue this field.
In the college of business at Bryant University in Smithfield, RI, most stu-dents concentrate in traditional business areas such as accounting, management, marketing, finance, and computer infor-mation systems. In addition, we have an applied actuarial mathematics concen-tration. This concentration, as expected,
Academic Attributes of College Freshmen
That Lead to Success in Actuarial Studies
in a Business College
RICHARD MANNING SMITH PHYLLIS SCHUMACHER BRYANT UNIVERSITY
SMITHFIELD, RHODE ISLAND
J
have strong mathematics ability and might at least give some consideration to pursuing an actuarial concentration. Many such students who do consider the concentration wonder whether they will be successful. The pressure on these stu-dents is exacerbated by the fact that actuarial students, unlike other business students, begin to take courses in their concentration when they are freshmen. Clearly, it would be desirable for such students to have a way of forecasting before they begin so that they might know how likely they are to succeed in the concentration and, by extension, potentially obtain an entry-level position in the actuarial field. In addition, it would help for instructors in the mathe-matics department to be able to improve their ability to advise such students.
There have been several studies fore-casting the academic success of engi-neering students using similar academic variables to those we used in the present study. As is true for actuarial students and engineering students, mathematical ability is recognized as an essential attribute. House (2000) found that high school rank and ACT composite score were the two most important variables in predicting success for students majoring in science, engineering, and math. Financial goals and self-concept were two other variables included in his model. For female students, the ACT composite score was the single best pre-dictor, with academic expectancies also included in the model.
Talib et al. (1999) found that, for entering engineering students, a differ-ent curriculum should be developed for groups of students who are categorized by their mathematics and science com-petencies. Consistent with these results, in a study of engineering majors, Leuw-erke, Robbins, Sawyer, and Hovland (2004) found that the mean ACT math-ematics score of students who complet-ed a college engineering major was sig-nificantly greater than was that of students who changed their major or left the university.
Oman (1986) found that mathematics proficiency was a major factor in pre-dicting student success in introductory computer science courses. In a study of college computer science majors in Tai-wan, Fan, Li, and Niess (1998) found
that overall high school achievement and math course averages were effective predictors of success.
However, few studies have focused on actuarial students and variables relat-ing to their success. In a previous study (Smith & Schumacher, 2005), we found that, among undergraduate actuarial graduates, math Scholastic Aptitude Test (SAT) scores (MSAT), verbal SAT scores (VSAT), percentile rank in high school graduating class (RANK), and percentage score on a college mathe-matics placement exam administered to all students entering the university (PLACE%) had some relevance to fore-casting the students’ grade point aver-ages in their concentration. For both males and females, RANK and PLACE% were included in the best regression prediction model.
One of our goals in this article was to extend the results of our previous study by identifying variables that distinguish freshman actuarial majors who com-plete the concentration from those who drop out at some point before complet-ing the concentration. We analyzed four academic variables available for enter-ing freshmen: PLACE%, MSAT, VSAT, and RANK. In addition, we developed a logistic regression model that predicted the probability of a given student being a member of the actuarial graduates or the actuarial dropouts.
An obvious hypothesis as to why actuarial students would drop the con-centration is that they have merely lost interest in the concentration or in math-ematics, or they have become more interested in some other field. We know several very good mathematics students who have switched out of the actuarial concentration because of increased interest in another field. However, in this article, we investigated the possibil-ity that any of the stated four academic variables had a strong influence on whether a student persisted in the con-centration until graduation.
METHOD
Participants
We obtained data from 185 Bryant University students expecting to gradu-ate in the years 1999–2005 who had
begun their college careers as freshman actuarial majors in the years 1995–2001. Among these students, 77 have graduat-ed as actuarial concentrators (actuarial graduates). The remaining 108 students dropped out of the concentration (actu-arial dropouts) at a variety of points in their college careers. Because of missing values, the n values for the different variables were sometimes less than 77 for the actuarial graduates and less than 108 for the actuarial dropouts. The entire 2003 freshman class, which consisted of 776 students (435 males and 341 females), was used as a reference group for characterizing the average academic qualifications of entering students at Bryant University.
Procedure
We used ttests to compare the actu-arial graduates with the actuactu-arial dropouts with respect to the indepen-dent variables (PLACE%, MSAT, VSAT, and RANK). In addition, we conducted a logistic regression using the same independent variables to fore-cast the probability of a given entering actuarial freshman becoming an actuar-ial graduate or dropout.
Variables
Mathematics Placement Test Score (PLACE%)
Bryant University has been adminis-tering a multiple-choice mathematics placement test to incoming freshmen since the summer of 1992. The main purpose of the test has been to deter-mine which of Bryant’s entering fresh-men, regardless of intended major, would benefit from our remedial math-ematics course before taking our stan-dard freshman mathematics courses. Since the fall of 1995, the test has con-sisted of 35 questions involving high school elementary or intermediate alge-bra. PLACE% is the percentage of cor-rect answers, recorded in decimal form, achieved by each student. Students take this test during a summer orientation for freshmen without having made any special attempt to study for it. The test essentially serves as a quick indicator of a student’s knowledge of high school algebra.
All entering freshmen are required to take the placement test, including prospective actuarial students, for whom the test is expected to be very easy. In fact, the mean placement per-centage score of all entering actuarial students in the sample for which the score was available was .71, with n = 163,SD= 0.23. The average for Bryant freshmen as a whole was .35 (n = 652,
SD = 0.25). The difference was highly significant,t(266) = 17.60,p= .000. We certainly expected students pursuing the actuarial concentrators, however quali-fied, to be much stronger in their alge-bra knowledge than were the entering business concentrations as a group. Prior to this study, we had observed two extremes on the placement test: Many of Bryant’s best actuarial students have obtained a near perfect score of 1.00 on the test; however, entering actuarial freshmen who have only achieved close to the average percentage of all Bryant students have tended to drop out of the program. It follows from these observa-tions that we expected some difference between mathematics placement scores (PLACE%) for actuarial graduates and those of actuarial dropouts.
Mathematics Scholastic Aptitude Test Score (MSAT)
Prior to the present study, we viewed the MSAT score as an indicator of a stu-dent’s mathematical ability to succeed in actuarial mathematics courses. In a prior study (Smith & Schumacher, 2005), we found MSAT to be a significant predic-tor of grade point average (GPA) for actuarial students in their mathematics courses. In addition, the mean MSAT score of all the entering actuarial stu-dents at Bryant was 645 (n= 173,SD= 65.53), compared with the mean MSAT of 526 (n= 754,SD= 70.2) for all 2003 (a representative year) entering fresh-men. This difference was highly signifi-cant,t(270) = 15.67,p= .000.
Verbal Scholastic Aptitude Test Score (VSAT)
Although actuarial students at Bryant generally have higher MSAT scores than do other students, we did not assume that they would also necessarily have higher VSAT scores. For the entire
sam-ple in the study, the mean VSAT score was 555 (n= 173,SD= 79), which was higher than the average of 522.2 (n = 754,SD= 64.5) for all Bryant entering freshmen from 2003. Although the dif-ference was not nearly as significant as that for MSAT, it was still highly signif-icant,t(227) = 5.10,p= .000.
Percentile Rank in High School Graduating Class (RANK)
From our experience prior to the pres-ent study, we felt that studpres-ents’ per-centile ranks in their high school gradu-ating classes were indicators of overall study dedication and effectiveness and that this study effectiveness would tend to persist in college. Considering the dif-ficulty of the concentration, such study effectiveness is especially important in the actuarial concentration. In a previous study (Smith & Schumacher, 2005), we found that percentile rank in a high school class was a significant variable in predicting actuarial graduates’ GPAs in mathematics courses. On this basis, we expected that RANK would be higher for actuarial graduates than for actuarial dropouts. For our sample, the mean RANK for all actuarial graduates and dropouts together was .81 (n= 155,SD= .16), which was higher than the average of .65 (n= 628,SD= .19) for all Bryant entering freshmen from 2003. The dif-ference was highly significant,t(271) = 10.43, p= .000. No account has been
taken for the fact that the selectivity of high schools that students come from can vary widely.
RESULTS
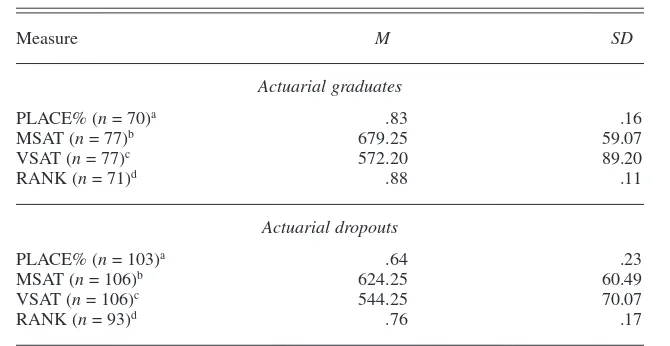
The results of the t tests comparing the performance of actuarial graduates and actuarial dropouts for all four inde-pendent variables are shown in Table 1. It can be seen that, for all four vari-ables—PLACE%, MSAT, VSAT, and RANK—actuarial graduates had aver-age scores that were significantly higher than those of the actuarial dropouts. The two-tailed t tests had p values less than .001 in three cases; only in the case of the VSAT was the p value as high as .04. We ran the logistic regression with gender as an independent variable in addition to the four original variables. A test of the full model with all five predictors was statistically reliable with a chi-square value of 50.574 (df
= 8, n = 158, p < .001). In addition, the Hosmer and Lemeshow Test statis-tic yielded a chi-square of 6.072 (df= 8,n = 158, p= .639), indicating that the model’s estimates fit the data at an acceptable level.
The classification table obtained from SPSS (Version 12, Chicago, IL) is shown in Table 2. This table shows that 72.1% of the students predicted to be actuarial graduates were actuarial graduates and that 76.7% of the students predicted to be
TABLE 1. Results of t Tests Comparing Actuarial Program Graduates
With Dropouts on Four Independent Variables
Measure M SD
Note. PLACE% = math placement test score; MSAT = math SAT score; VSAT = verbal SAT score; RANK = high school class rank.
at(178) = 6.16,p< .001. bt(181) = 5.91,p< .001. ct(181) = 2.19,p< .04. dt(162) = 5.14,p< .001.
actuarial dropouts were, in fact, dropouts. Overall, the logistic regression model accurately assigned 74.7% of the sample of actuarial graduates and dropouts to their correct categories.
Of the 22 students whose forecasted probability of success was .75 or greater, 19 (86%) completed the con-centration. Of the 54 students whose forecasted probability was .60 or greater, 42 (78%) completed the con-centration. Of the 54 students whose forecasted probability was .30 or less, only 7 (13%) completed the concentra-tion. In fact, all but 2 of these students struggled to complete the concentration, achieving low math GPAs. Only 1 of 30 (3%) students whose forecasted proba-bility was less than .13 was able to com-plete the concentration.
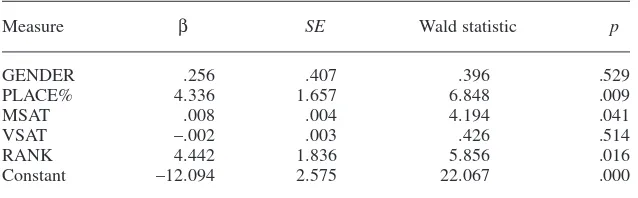
The regression coefficients, along with individual Wald statistics and cor-responding significance levels are shown in Table 3. As can be seen from these values, three of the original vari-ables (i.e., PLACE%,p< .01; MSAT,p< .05; and RANK, p< .02) were signifi-cant in the logistic regression model, whereas neither gender nor VSAT was significant.
DISCUSSION
The logistic regression equation can be used for a prospective actuarial stu-dent with given PLACE%, MSAT, VSAT, RANK, and gender to produce a probability that the student will be an actuarial graduate and not a dropout. Considering the example of the data from one of the students in the sample, the model indicated that this seemingly promising student, having a .71 PLACE%, 660 MSAT, and 780 VSAT, but whose RANK was only .58, had only a .13 probability of becoming an actuarial graduate. This student did, in fact, become one of the dropouts. This example shows that a low RANK can significantly reduce a student’s proba-bility of success, even when that student has good to very good scores on the SATs and math placement exam.
By contrast, one of the successful actuarial graduates, who had a .67 PLACE% (fair), 600 MSAT (fair), 500 VSAT (fair), but with a .97 RANK, had a .35 probability of success in the pro-gram according to the model. This example shows how a superior class rank can to some extent help a student
to overcome only fair scores on the other measures.
PLACE% was also shown to be a sig-nificant factor. Compare the following students from the sample:
Student 1. PLACE% = .82 MSAT = 720 VSAT = 620 RANK = .93
Student 2. PLACE% = .58 MSAT = 720 VSAT = 580 RANK = .94
The two students, who had identical MSATs, nearly identical RANKS, and close VSATs, differed greatly only in their PLACE%. According to the model, Student 1, with the higher math place-ment score, had a .72 probability of grad-uating in the concentration (and, in fact, did become an actuarial graduate), while Student 2, with the lower placement score, had a .50 probability of graduating in the concentration (and, in fact, dropped out of the concentration). The difference in PLACE% alone clearly resulted in a significant difference in the probabilities produced by the model. Student 2 cer-tainly had a high enough probability to be encouraged to pursue the concentration, but Student 1 was much more likely to complete the concentration.
There may be some tendency for teachers to heavily weigh students’ MSATs in evaluating whether students can complete the actuarial concentration. The above examples of unsuccessful stu-dents with a high MSAT and either low RANK or a low PLACE% suggest that MSAT alone is not a sufficient indicator of success in the actuar-ial concentration.
Furthermore, the following example shows that, according to the prediction model presented in this article, a modest MSAT score should not automatically discourage a student from considering the actuarial concentration. The logistic regression model shows that a male with a 580 MSAT, considered low for an actu-arial student, and a VSAT of 510 can still achieve a probability of more than .50 of becoming an actuarial graduate if he has a high enough PLACE% (.85) and high enough RANK (.92). A female student with a 590 MSAT and 510 VSAT could achieve a similar probability of becom-ing an actuarial graduate with a .85 PLACE% and a .96 RANK.
In summary, a student with a marginal MSAT should not automatically be advised to reject the actuarial
concentra-TABLE 2. Classification of Actuarial Program Students as Graduates or Dropouts as Predicted by the Logistic Regression Model
Correctly Incorrectly Percentage Category predicted,n predicted,n correct
Actuarial graduates 49 19 72.1 Actuarial dropouts 69 21 76.7 Overall 118 40 74.7
TABLE 3. Logistic Regression Coefficients and Wald Statistics for Independent Variables Used in Predicting Actuarial Program Completion
Measure β SE Wald statistic p
GENDER .256 .407 .396 .529 PLACE% 4.336 1.657 6.848 .009 MSAT .008 .004 4.194 .041 VSAT –.002 .003 .426 .514 RANK 4.442 1.836 5.856 .016 Constant –12.094 2.575 22.067 .000
Note. PLACE% = math placement test score; MSAT = math SAT score; VSAT = verbal SAT score; RANK = high school class rank. df= 1.
tion. The student’s PLACE% and RANK should also be considered to find out if they increase the student’s probability of being successful in the concentration. Ideally, in addition to the academic vari-ables that were considered, some affec-tive independent variables might have been added in an attempt to increase the accuracy of the logistic regression model. Some of these variables are (a) students’ perceptions of their mathemati-cal ability; (b) students’ levels of com-mitment at the outset in pursuing the actuarial concentration; (c) students’ lev-els of commitment to achieving high grades in college; (d) students’ use of successful study strategies; (e) students’ study discipline; and (f) students’ tenden-cies to be academically persistent.
For variables mentioned in c through f, we believe that one of the variables in our study, RANK, may, at least partially, take these into account. However, separate measures of any or all of the six variables might have proved to be valuable con-tributors to the model. Unfortunately, the relevant data on the students in the study were not available because appropriate
surveys were not taken at the times the students began the actuarial program.
The challenging nature of the mathe-matics courses that actuarial students take makes it very desirable for prospec-tive actuarial students to obtain an informed view of their potential to suc-ceed in their required mathematics cours-es before beginning to pursue such a con-centration. In this article, we presented four variables that distinguish actuarial program graduates from program dropouts. In addition, we produced a logistic regression model that can be used to obtain a probability of an actuar-ial student graduating in that concentra-tion. This information is expected to help mathematics faculty advise entering freshmen students who are considering a concentration in actuarial mathematics as to the likelihood of their success in this concentration and in the actuarial field.
NOTE
Correspondence concerning this article should be addressed to Professor Richard Manning Smith, Mathematics Department, Suite A, Bryant University, Smithfield, RI 02917-1284.
E-mail: rsmith@bryant.edu
REFERENCES
“Actuary is rated one of the best jobs in America.” (2005). Retrieved March 19, 2006, from http://www.beanactuary.org/about/best_job .cfm
Fan, T., Li, Y., & Niess, M. L. (1998). Predicting academic achievement of college computer sci-ence majors. Journal of Research on Comput-ing in Education, 31(2), 155–172.
House, D. (2000). Academic background and self-beliefs as predictors of student grade perfor-mance in science, engineering and mathemat-ics. International Journal of Instructional Media, 27(2), 207–220.
Krantz, L. (2002). Jobs rated almanac. Fort Lee, NJ: Barricade Books.
Leuwerke, W. C., Robbins, S., Sawyer, R., & Hov-land, M. (2004). Predicting engineering status from mathematics achievement and interest congruence. Journal of Career Assessment,2, 135–149.
Oman, P. W. (1986). Identifying student charac-teristics influencing success in introductory
computer science courses. AEDS Journal,
19(2–3),226–233.
Smith, R. M., & Schumacher, P. (2005). Predict-ing success for actuarial students in
undergrad-uate mathematics courses. College Student
Journal, 39(1), 165–177.
Talib, R., Ismail, R., Mohd, R., Janor, R., Ahmed, A. Z., & Aljunid, S. A. K. (1999). Programme-quality assessment by the implication of vari-able entry qualification on students perfor-mance. Assessment & Evaluation in Higher Education, 24(2), 205–213.