Full Terms & Conditions of access and use can be found at
http://www.tandfonline.com/action/journalInformation?journalCode=vjeb20
Download by: [Universitas Maritim Raja Ali Haji] Date: 11 January 2016, At: 22:19
Journal of Education for Business
ISSN: 0883-2323 (Print) 1940-3356 (Online) Journal homepage: http://www.tandfonline.com/loi/vjeb20
Student Expectations of Technology-Enhanced
Pedagogy: A Ten-Year Comparison
Mary Jo Jackson , Marilyn M. Helms , William T. Jackson & John R. Gum
To cite this article: Mary Jo Jackson , Marilyn M. Helms , William T. Jackson & John R. Gum (2011) Student Expectations of Technology-Enhanced Pedagogy: A Ten-Year Comparison, Journal of Education for Business, 86:5, 294-301, DOI: 10.1080/08832323.2010.518648 To link to this article: http://dx.doi.org/10.1080/08832323.2010.518648
Published online: 21 Jun 2011.
Submit your article to this journal
Article views: 525
View related articles
ISSN: 0883-2323 print / 1940-3356 online DOI: 10.1080/08832323.2010.518648
Student Expectations of Technology-Enhanced
Pedagogy: A Ten-Year Comparison
Mary Jo Jackson
University of South Florida St. Petersburg, St. Petersburg, Florida, USA
Marilyn M. Helms
Dalton State College, Dalton, Georgia, USA
William T. Jackson and John R. Gum
University of South Florida St. Petersburg, St. Petersburg, Florida, USA
The influx of technology into education has begun a transformation of the classroom. The authors replicated a 1996 study of college students’ expectations of technology to be used in the classroom. Students reported prior experience with computer technology, their ideal classroom instruction techniques, and what technology-enhanced pedagogies they anticipated in college classrooms. Although student desires have changed, the picture of an ideal classroom still shows a strong desire for lecture-dominated classes with class discussion and exercises, written handouts, and outlines. Implications and suggestions for future research are included. Keywords: college pedagogy, technology, teaching
As recently as the late 1980s, articles on technology in the classroom were scarce and required a definition and explana-tion of technology-enhanced opexplana-tions before presenting a new theory. This has changed dramatically and was illustrated by a Market Data Retrieval study that estimated colleges spent$6.94 billion on information technology (IT) in 2006, a 35% increase from the previous year. Additionally, Kiernan (2006) reported the average college technology budget to be $1.4 million.
Projections are that technology usage may transform higher education learning and teaching in the future (Kiernan, 2006; Watson, Boudreau, York, Greiner, & Wynn, 2008); however, research on the use of technology-enhanced ped-agogies in higher education and of the link between these and student learning is limited and conflicting. Studies in the late 1990s appeared to suggest cautious optimism for a positive relationship between the use of technology and stu-dent educational achievements (Schacter, 1999). Over time, others have disagreed on the benefits of the various types of
Correspondence should be addressed to Marilyn M. Helms, Dalton State College, School of Business, 650 College Drive, Dalton, GA 30720, USA. E-mail: [email protected]
technology-enhanced pedagogy on learning whereas others indicated faculty costs and time may outweigh any benefits to student learning (Herrington & Kervin, 2007; Smith, 2001; Watson et al.).
Krentler and Willis-Flurry (2005) suggested students per-ceive technology as an effective learning tool and many insti-tutions and faculty assume students expect their courses to be infused with technological supplements. Growing up in an in-tensive environment of television, movies, and video games, younger students have developed learning styles where com-prehension occurs largely through visual images. This form of delivery may shape what students perceive and may af-fect their interest levels and retention of information. In this vein a similarity can be drawn to the phenomenon that has occurred in news coverage, where snippets or sound bites are the forms of information most sought due to time constraints and limited attention spans of viewers.
Similarly, it is expected that students raised in an environ-ment in which senses are flooded with visual inputs may have different expectations regarding what they consider optimal pedagogies for learning and whether they consider technol-ogy enhancements to be a nicety or a necessity. Additionally, as Schrum (2005) pointed out, most students are ahead of their professors in computer literacy. It is also expected that
EXPECTATIONS OF TECHNOLOGY 295
in their just-in-time environment, students seek immediate feedback on assignments and demand anytime access for grade posting. Anecdotal evidence suggests students prefer Web-posted documents including class syllabi, lecture notes, links to current articles and readings, or PowerPoint slides. Most textbook publishers offer this form of support in ancil-lary materials specifically developed for the online environ-ment. With the proliferation of the iPod it is not inconceivable that some students would prefer lectures and video clips to download as podcasts for MP3 players and other personal listening devices.
Technology-enhanced pedagogies are becoming more common in today’s classrooms. Demand is expected to con-tinue its substantial growth over the next decade (Debevec, Shih, & Kashyap, 2006; Hall & Elliott, 2003). Schrum (2005) reported that technological advances have exceeded the most optimistic expectations but agreed that educational institu-tions have not yet realized the full potential, and that although some aspects of education delivery have indeed changed, with the growth and proliferation of technology course con-tent and objectives have remained the same. This myriad of technologies are not only being used in a variety of educational settings, but their use is also being studied by educational researchers in a variety of settings, including information systems classrooms (Bradley, Mbarika, Sankar, Raju, & Kaba (2007), accounting classrooms (Sugahara & Boland, 2006), and in business education courses (James, Burke, & Hutchins, 2006).
Young (2004), in a survey of 4,374 freshman and se-niors, found 48.5% of the students felt the biggest benefit of classroom technology is convenience (e.g., checking grades online), whereas only 12.7% of the students said improved learning was the greatest benefit. Some 3.7% felt IT pro-vided no benefit at all in their classrooms. Young also found most students (41.2%) preferred a moderate use of IT and agreed there is a mythology about today’s students. Although they may live online in their personal environment, very few students (2.2%) wanted entirely online courses and 2.9% even preferred courses with no use of IT (Young). Because students are exposed to technology and multimedia in el-ementary and secondary classrooms and in their personal lives, have their expectations of technology in their college learning environments changed and have their desires for technologically enhanced pedagogies changed? Specifically, the questions become the following:
Research Question 1: What are students’
expecta-tions regarding technology-enhanced pedagogical tech-niques in the college classroom, and have these expectations changed over the past decade (1996– 2006)?
Research Question 2: What type of technology-enhanced
pedagogical techniques do students want in their ideal classroom, and have these desires changed over the past decade (1996–2006)?
METHOD
From a review of the present literature of the use of multime-dia in the classroom, Snyder and Vaughan (1996) developed a student survey designed to measure student expectations of this pedagogy. The survey was arranged into four areas: anticipation of the format in which students would receive instruction, extent of student exposure to computers during the last academic year, perception of the ideal classroom, and extent of student usage of various types of software within the past year.
The survey instrument, as shown in Appendix A, con-sisted of content questions measured with a 5-point Likert-type scale with responses ranging from 1 (None at all) to
5 (Extensively [almost daily]) and seven demographic
ques-tions. Although the original survey responses were worded to reflect the quarter based academic term, the 2006 sur-vey changed the responses to a semester basis to reflect the academic terms in use at that time. Of the content ques-tions, 15 addressed student expectations regarding the use of technology-enhanced pedagogies, whereas five questions considered the extent technology was used in their class-room during their senior year of high school. Fifteen ques-tions polled students on their ideal classroom environment as it related to technology-enhanced pedagogy. The remainder of the questions addressed the extent of students’ personal computer usage. Although the terminology and available ele-ments related to technology in the classroom evolved during the 10-year study period, the survey instrument purposely kept the same terminology and elements to allow for longi-tudinal comparisons.
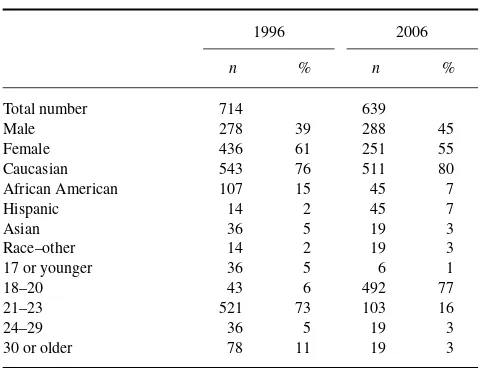
In 1996 the survey was administered to 714 students at a small southeastern private college. The student sample was 39% male and 61% female. Seventy-six percent of the sam-pled students were Caucasian, 15% were African American, 2% were Hispanic, 5% were Asian, and 2% were classified as other. The age make-up of the sample included 5% that were aged 17 years or younger, 6% that were between the ages of 18 and 20 years, 73% that were between the ages of 21 and 23 years, 5% that were between the ages of 24 and 29 years, and 11% that were aged 30 years or older.
In 2006, the same survey was administered to 639 students at three southeastern colleges in two southern states (Georgia and Tennessee) and included two public institutions and one private institution. This student sample was 45% male and 55% female. Of the sample, 80% were Caucasian, 7% were African American, 7% were Hispanic, 3% were Asian, and 3% were classified as other. The sample included 1% of the students that were aged 17 years or younger, 77% that were between the ages of 18 and 20 years, 16% that were between the ages of 21 and 23 years, 3% that were between the ages of 24 and 29 years, and 3% that were aged 30 years or older. Although the majors of the students were not measured in the survey, both student samples could be classified as convenience samples, with the majority of students having
TABLE 1
Sample Demographics, 1996 and 2006
1996 2006
n % n %
Total number 714 639
Male 278 39 288 45
Female 436 61 251 55
Caucasian 543 76 511 80
African American 107 15 45 7
Hispanic 14 2 45 7
Asian 36 5 19 3
Race–other 14 2 19 3
17 or younger 36 5 6 1
18–20 43 6 492 77
21–23 521 73 103 16
24–29 36 5 19 3
30 or older 78 11 19 3
business related majors. Also, the college included in the original study was one of the three institutions sampled in 2006.
The demographics of each sample are shown in Table 1. The Mann-Whitney-Wilcoxon (MWW) test was used to determine if there were significant differences in the two samples. Results indicated that there was a significant dif-ference in the age of the two samples. The 1996 sample was significantly older than the 2006 student sample (U=84003,
p <.000), with the largest difference being reported in the
percentage of students aged 30 years or older (11% in 1996 and 3% in 2006). However, analysis of the 1996 data indi-cated that responses were not significantly different based on the age of the respondents and, thus, the difference in the ages of the sample respondents was not considered in further analyzes.
RESULTS
The analysis was divided into three parts. The first part mea-sured the students’ exposure to and use of technology and compared the differences between the two student samples. The second part considered the components of the students’ anticipated learning environment and compared the 1996 and 2006 results. In the third part we analyzed and compared the perceptions of ideal learning environment in the two student samples.
Part 1: Use of Technology
Students’ personal usage of technology was measured by asking students to indicate “to what extent you used the fol-lowing software during the past year.” Responses were mea-sured on a 5-point Likert-type scale with responses ranging from 1 (None at all) to 5 (Extensively [almost daily]). A focus
group comprising the business school faculty was conducted to determine which of the response categories indicated ac-tual usage. It was determined that if a tool was used 6–7 times per quarter it would be perceived as being used in the course. Thus, responses of 5 ([almost daily]), 4 (once/week), and 3
(6–7 times per quarter) were operational zed as an indicator
of usage.
In the 1996 sample, 23% of the students reported having some form of presentation software, such as PowerPoint, used at least occasionally in class presentations (response items 3, 4, and 5), 86% used word-processing soft-ware, 86% used spreadsheets, 35% used e-mail, and 43% regularly accessed the Internet. Ten years later, 72% of the students reported at least occasional (6–7 times per quarter) use of presentation software, 90% use of word-processing software, 53% use of spreadsheets, 75% use of email, and 93% accessed the Internet.
Previous exposure to the use of computer technology in the classroom was measured by the student’s responses to questions regarding the extent their instructors had used com-puters at least occasionally (6–7 times per quarter) during their last academic year. Responses were measured on a 5-point Likert-type with responses ranging from 1 (None at all) to 5 (Extensively [almost daily]). Again, based on focus group input, responses of 3, 4, or 5 were included in the analysis. In 1996, the usage of computers to present course material was reported by 53% of the students and by 79% in 2006. Another aspect of computer technology used in the classroom included the use of email, which was reported by 11% of the 1996 student sample and 49% of the 2006 sample.
Part 2: Anticipated Learning Environments
The anticipated learning environment was measured by stu-dent responses to the statement, “I anticipate my professors will use the following techniques to present course informa-tion.” The statement was followed by a list of pedagogical techniques, which were scored on a 5-point Likert-type scale with responses ranging from 1 (None at all) to 5 (Extensively
[almost daily]). Responses of 3, 4, or 5 were included in the
analysis of the students’ anticipated environment as indica-tive of anticipated pedagogies. Table 1 shows the comparison of the student responses.
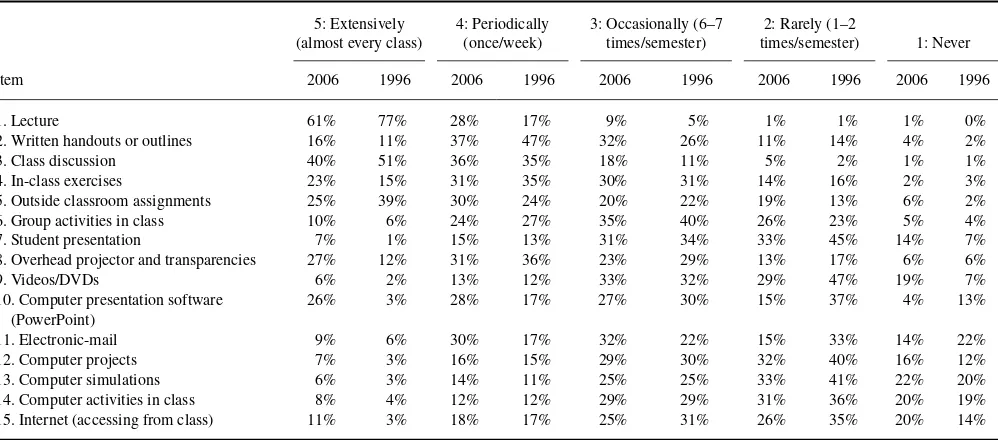
In 1996, 20% of the students anticipated that technology would be used in presenting class material extensively or pe-riodically, with 30% anticipating technology would be used occasionally. Forty-eight percent expected at least occasional computer projects and 51% anticipated at least occasional Internet access in the classroom. The use of computer simu-lations, at least occasionally, was anticipated by 39% of the students, email by 45% of the students, and video/DVD use by 46% of the students. More traditional classroom peda-gogies such as lectures and class discussions were expected extensively by 77% and 51% of the respondents, respec-tively. Written handouts or outlines were expected at least
EXPECTATIONS OF TECHNOLOGY 297
TABLE 2
Comparison Expectation of College Learning Environment, 1996 and 2006
5: Extensively (almost every class)
4: Periodically (once/week)
3: Occasionally (6–7 times/semester)
2: Rarely (1–2
times/semester) 1: Never
Item 2006 1996 2006 1996 2006 1996 2006 1996 2006 1996
1. Lecture 61% 77% 28% 17% 9% 5% 1% 1% 1% 0%
2. Written handouts or outlines 16% 11% 37% 47% 32% 26% 11% 14% 4% 2%
3. Class discussion 40% 51% 36% 35% 18% 11% 5% 2% 1% 1%
4. In-class exercises 23% 15% 31% 35% 30% 31% 14% 16% 2% 3%
5. Outside classroom assignments 25% 39% 30% 24% 20% 22% 19% 13% 6% 2%
6. Group activities in class 10% 6% 24% 27% 35% 40% 26% 23% 5% 4%
7. Student presentation 7% 1% 15% 13% 31% 34% 33% 45% 14% 7%
8. Overhead projector and transparencies 27% 12% 31% 36% 23% 29% 13% 17% 6% 6%
9. Videos/DVDs 6% 2% 13% 12% 33% 32% 29% 47% 19% 7%
10. Computer presentation software (PowerPoint)
26% 3% 28% 17% 27% 30% 15% 37% 4% 13%
11. Electronic-mail 9% 6% 30% 17% 32% 22% 15% 33% 14% 22%
12. Computer projects 7% 3% 16% 15% 29% 30% 32% 40% 16% 12%
13. Computer simulations 6% 3% 14% 11% 25% 25% 33% 41% 22% 20%
14. Computer activities in class 8% 4% 12% 12% 29% 29% 31% 36% 20% 19% 15. Internet (accessing from class) 11% 3% 18% 17% 25% 31% 26% 35% 20% 14%
Note.Prompt: “I anticipate my professors will use the following techniques to present course information.”
occasionally by 84% of the students; at least occasionally in class exercises by 81%; and outside classroom assignments by 85% (responses of 3, 4, and 5). Only 6% expected the ex-tensive use of group activities in class, whereas 73 expected these at least occasionally.
In comparison, in 2006, 81% of the students expected technology-enhanced classroom presentations at least occa-sionally, 52% computer projects, and 54% Internet access from class. In 2006, 45% anticipated computer simulations to be used at least occasionally, 71% anticipated the use of email contact at least occasionally, and 52% anticipated ex-posure to video/DVD. Table 2 shows this comparison. The more traditional pedagogies such as lectures were still ex-pected extensively by 61% of the students, with only 2% expecting these to be used rarely or not at all. Expectations of in-class exercises and written handouts or outlines still remained high, with 85% expecting exercises at least occa-sionally and at least occasional handouts also being expected by 85%. Group activities were not expected by 31% of the students (responses of 2 and 1) and 25% did not expect out-side class assignments (responses of 2 and 1).
Because the survey instrument used ordinal data or, more specific, ordinal numeric data, a nonparametric statistical test was used to determine if a significant difference existed between the two student samples. The MWW test was the test of choice because the data were not paired. The MWW does not require interval data or for the two populations to be normally distributed. The MWW does, however, determine if the two populations are identical. Hence,
H0: The two populations are identical. HA: The two populations are not identical.
If the alpha exceeds the significance value and the null hypothesis is rejected, the mean rank is utilized to determine which group had the higher or lower value.
Table 3 shows the results of the MWW test on the student responses from 1996 and 2006. The 1996 students anticipated significantly more lectures, class discussion, group activities in class, and out-of-class assignments than did their 2006 counterparts. Significant differences were found regarding the expectations of the two groups of technology enhance-ments, with the 2006 group anticipating greater use of DVDs, email, presentation software, computer projects, simulations, and Internet resources.
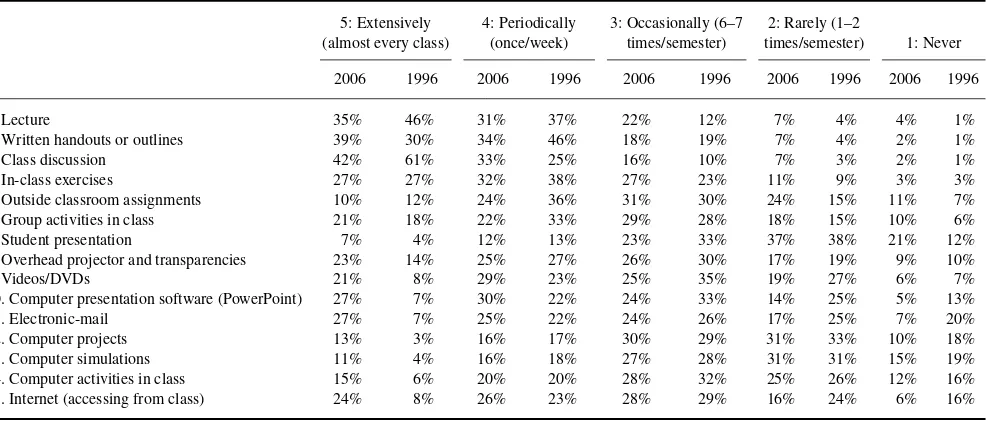
Part 3: Ideal Learning Environment
The ideal learning environment of the students was measured by student responses to the statement, “In my ideal class-room, instructors would use the following” and responses of 3, 4, and 5, indicating at least occasional use, were analyzed. The presentation of material through technology-enhanced pedagogies was included in the profile of 62% of students’ ideal classroom environments in 1996 compared to 81% in 2006. Other technology-enhanced pedagogies in their ideal learning environment included computer projects, cited by 49% of the respondents in 1996 and 59% in 2006 and com-puter simulations, and was desired by 50% of the students in 1996 and by 54% in 2006. Use of email and the Internet were a part of the ideal learning environment of 55% and 60% of the 1996 students, respectively, and 76% and 78% of the 2006 students, respectively.
Interestingly, the 1996 and the 2006 students indicated a strong desire for the more traditional pedagogy of lecture,
TABLE 3
Mann-Whitney Analysis Expectations of College Classroom
Pedagogy N U p Mrank
Lecture 1996 583 639.97
2006 636 167921 .000 582.53
Written handouts or outlines
1996 639 636.94
2006 628 198769 .761 631.01
Class discussion 1996 607 675.39
2006 636 160619 .000 571.05
In-class exercises 1996 630 610.34
2006 624 185752 .079 644.82
Outside classroom assignments
1996 602 661.35
2006 630 162631 .000 573.65
Group activities in class 1996 604 653.63
2006 633 170251 .000 585.96
Student presentation 1996 611 630.49
2006 628 185447 .282 609.80
Videos/DVDs 1996 626 562.83
2006 630 156079 .000 693.76
Computer presentation software
1996 625 518.97
2006 631 128734 .000 736.98
Electronic-mail 1996 617 521.67
2006 633 131218 .000 726.70
Computer projects 1996 619 577.82
2006 633 165777 .000 674.11
Computer simulations 1996 622 602.50
2006 632 181005 .012 652.10
Internet resources 1996 606 964.36
2006 633 138731 .000 703.83
with 46% wanting lecture extensively in 1996 and 35% in 2006. Extensive use of class discussion was viewed as a part of the ideal classroom by 61% of the students in 1996 and 42% in 2006. The extensive use of class exercises was indi-cated as ideal by 27% of the students in both 1996 and 2006, with 95% of the 1996 sample and 91% of the 2006 sample wanting at least occasional written handouts and outlines. Table 4 shows this comparison.
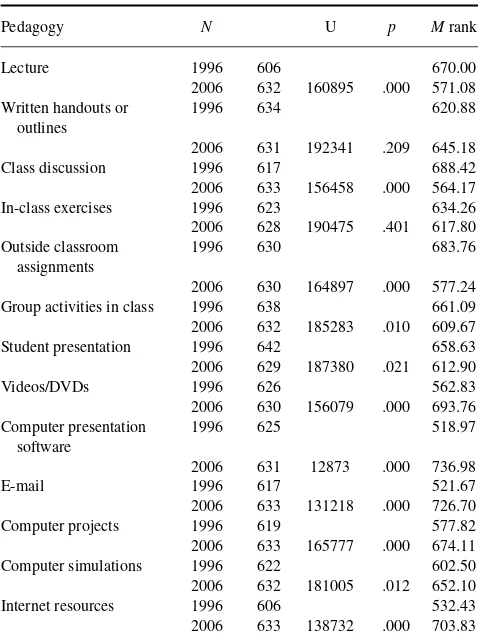
Again, the MWW test was used for the nonpaired ordi-nal numeric data. Results are shown in Table 5. Significant differences between the pedagogies in their ideal classroom were found for most of the techniques tested. Significantly fewer of the students in 2006 sample wanted lecture, class discussion, outside class assignments, or group activities in their ideal classroom. The reverse was found regarding technology-enhanced pedagogies. Significantly more of the 2006 sample wanted to see DVDs, presentation software, email, computer projects, simulations, and the use of the Internet in their ideal classroom environment.
DISCUSSION
With regard to Research Question 1 (What are students’ ex-pectations regarding technology-enhanced pedagogical tech-niques in the college classroom, and have these expectations changed over the past decade [1996–2006]?), although ex-pectations have significantly changed, the 1996 and the 2006 data show a picture of a lecture-dominated classroom, with
TABLE 4
Comparison: Ideal College Learning Environment, 1996 and 2006
5: Extensively (almost every class)
4: Periodically (once/week)
3: Occasionally (6–7 times/semester)
2: Rarely (1–2
times/semester) 1: Never
2006 1996 2006 1996 2006 1996 2006 1996 2006 1996
1. Lecture 35% 46% 31% 37% 22% 12% 7% 4% 4% 1%
2. Written handouts or outlines 39% 30% 34% 46% 18% 19% 7% 4% 2% 1%
3. Class discussion 42% 61% 33% 25% 16% 10% 7% 3% 2% 1%
4. In-class exercises 27% 27% 32% 38% 27% 23% 11% 9% 3% 3%
5. Outside classroom assignments 10% 12% 24% 36% 31% 30% 24% 15% 11% 7%
6. Group activities in class 21% 18% 22% 33% 29% 28% 18% 15% 10% 6%
7. Student presentation 7% 4% 12% 13% 23% 33% 37% 38% 21% 12%
8. Overhead projector and transparencies 23% 14% 25% 27% 26% 30% 17% 19% 9% 10%
9. Videos/DVDs 21% 8% 29% 23% 25% 35% 19% 27% 6% 7%
10. Computer presentation software (PowerPoint) 27% 7% 30% 22% 24% 33% 14% 25% 5% 13%
11. Electronic-mail 27% 7% 25% 22% 24% 26% 17% 25% 7% 20%
12. Computer projects 13% 3% 16% 17% 30% 29% 31% 33% 10% 18%
13. Computer simulations 11% 4% 16% 18% 27% 28% 31% 31% 15% 19%
14. Computer activities in class 15% 6% 20% 20% 28% 32% 25% 26% 12% 16% 15. Internet (accessing from class) 24% 8% 26% 23% 28% 29% 16% 24% 6% 16%
Note.Prompt: “In my ideal classroom, instructors would use the following.”
EXPECTATIONS OF TECHNOLOGY 299
TABLE 5
Mann-Whitney Analysis of Ideal Classroom
Pedagogy N U p Mrank
Lecture 1996 606 670.00
2006 632 160895 .000 571.08
Written handouts or outlines
1996 634 620.88
2006 631 192341 .209 645.18
Class discussion 1996 617 688.42
2006 633 156458 .000 564.17
In-class exercises 1996 623 634.26
2006 628 190475 .401 617.80
Outside classroom assignments
1996 630 683.76
2006 630 164897 .000 577.24
Group activities in class 1996 638 661.09
2006 632 185283 .010 609.67
Student presentation 1996 642 658.63
2006 629 187380 .021 612.90
Videos/DVDs 1996 626 562.83
2006 630 156079 .000 693.76
Computer projects 1996 619 577.82
2006 633 165777 .000 674.11
Computer simulations 1996 622 602.50
2006 632 181005 .012 652.10
Internet resources 1996 606 532.43
2006 633 138732 .000 703.83
multiple handouts, ample time for class discussion, minimal outside assignments or group projects, and limited student presentations. Both samples also indicated expectations of frequent email interaction with instructors and use of com-puters for information presentation.
In Research Question 2 we asked the question, “What type of technology-enhanced pedagogical techniques do students want in their ideal classroom, and have these desires changed over the past decade (1996–2006)?” Significantly more of the student respondents indicated a desire for technology-enhanced pedagogies such as presentation software, com-puter projects, simulations, and Internet usage. However, although the students’ views of the ideal classroom have significantly changed to include more technology-enhanced pedagogies, the basic picture still includes a strong desire for lecture, handouts, class discussion, group activities in class, and video/DVD material.
Although we are not proposing that students dictate how subject matter is presented in the classroom, knowledge of these expectations is beneficial. If gaps between reality and expectations exist, it may be necessary for high school teach-ers, guidance counselors, freshman-level college professors, and others to change these perceptions to more closely mirror reality. Part of a student’s first-year experience could include
a more realistic preview of the typical college classroom environment and a discussion of in- and out-of-class expecta-tions, just as realistic job previews have shown to increase sat-isfaction within some occupations and reduce turnover (see, for example, Elliott, 2002/2003; Hom, Griffeth, Palich, & Bracker, 1998; Mashburn, 2000/2001; Roszkowski & Ricci, 2004/2005). Providing students with a more realistic view of the pedagogies common to today’s college environment may also increase their satisfaction, retention, and ultimately matriculation.
Regardless of the students’ ideal and anticipated class-room learning environments, the final judge of the appro-priate pedagogies lies with the professor. Certain material may lend itself to different delivery methods. For example, students may need the reinforcement of outside class assign-ments, even though they would prefer otherwise. Also the availability of Internet access during class may divert stu-dents’ attention from the message and may hinder learning. Group projects and student presentations are not expected or preferred; however, they may be necessary to achieve the learning goals of the course.
This study provides just the beginning of exploring the changes in expectations of students as they relate to pedagog-ical techniques. Additional analysis needs to be conducted on the changes in expectations and ideal learning environments. Although exploratory analysis of the 1996 and 2006 data did not indicate differences based on demographic features, such as gender, race, and age, future researchers should consider an additional analysis with distinct demographic features. Also, the study did not capture nonclassroom exposure of students to multimedia technologies, such as those experi-enced by students with past or present employment.
A larger study of students is needed to confirm these find-ings. It may also be important to consider if the majors or in-terests of students influence their desire for and expectation of technological enhancements in learning environments. Still other studies should address whether educational institutions are providing these technologies, and what usage require-ments are suggested. Inclusion of students in the course de-sign for the type and amount of technology used should also be studied to see if such participation in the design impacts student outcomes. Additional studies should investigate the impact of technology enhancement on learning and student achievement. Researchers should consider the various learn-ing styles of students and which ones are most influenced by technology usage and if new technologies offer new learn-ing strategies for students who do not perform as effectively using traditional methods.
Also, although gap analysis indicates a disconnect be-tween reality and expectation, another avenue of study may be to consider whether satisfaction with the amount and type of technology influences overall student satisfaction which could then influence learning, retention, motivation, atten-dance, and degree completion. As colleges and universities work to increase student retention, this could be an
tant research stream. Studies could determine if students who were previously passive or disengaged in classrooms relying exclusively on the lecture-only delivery format are more en-gaged and attentive when technology is used.
Further research is needed to expand this exploratory study by confirming and considering the reality of chang-ing expectations within a first-year experience class. Future researchers should seek to explain why students indicate such a strong desire for summaries and handouts. Is this a function of their learning style? Is it due to poor study skills or note-taking ability? Is it a preference for a shorter summary rather than reading the entire textbook chapter? Could students’ attention span for reading be a function of their exposure to media? It would also be interesting to consider whether exposure to the actual college environment alters their ideal expectation over time (i.e., do sophomores and juniors main-tain the same ideal learning environment expectations or have they been conditioned to expect different?)
REFERENCES
Bradley, R. V., Mbarika, V. W. A., Sankar, C. S., Raju, P. K., & Kaba, B. (2007). Using multimedia instructional materials in MIS classrooms: A tutorial.Communications of the Association for Information Systems, 20(19), 260–281.
Debevec, K., Shih, M., & Kashyap, V. (2006). Learning strategies and performance in a technology integrated classroom.Journal of Research on Technology in Education,38, 293–308.
Elliott, K. M. (2002/2003). Key determinants of student satisfaction.Journal of College Student Retention: Research, Theory and Practice,4, 271– 279.
Hall, M., & Elliott, K. M. (2003). Diffusion of technology into the teaching process: Strategies to encourage faculty members to embrace the laptop environment.Journal of Education for Business,78, 301–307.
Herrington, J., & Kervin, L. (2007). Authentic learning supported by tech-nology: Ten suggestions and cases of integration in classrooms. Educa-tional Media InternaEduca-tional,44, 219–236.
Hom, P. W., Griffeth, R. W., Palich, L. E., & Bracker, J. S. (1998). An exploratory investigation into theoretical mechanisms underlying realistic job previews.Personnel Psychology,51, 421–451.
James, K. E., Burke, L. A., & Hutchins, H. M. (2006). Powerful or point-less? Faculty versus student perceptions of PowerPoint use in business education.Business Communication Quarterly,69, 374–396.
Kiernan, V. (2006, March 10). Spending on technology rebounds at colleges and may set record this year.The Chronicle of Higher Education,52(27), A30.
Krentler, K. A., & Willis-Flurry, L. A. (2005). Does technology enhance actual student learning? The case of online discussion boards.Journal of Education for Business,80, 316–322.
Mashburn, A. J. (2000/2001). A psychological process of college student dropout.Journal of College Student Retention: Research, Theory and Practice,2, 173–190.
Roszkowski, M. J., & Ricci, R. (2004/2005). Measurement of importance in a student satisfaction questionnaire: Comparison of the direct and indirect methods for establishing attribute importance.Journal of College Student Retention: Research, Theory and Practice,6, 251–271.
Schacter, J. (1999).The impact of education technology on student achieve-ment: What the most current research has to say. Santa Monica, CA: Miliken Exchange on Education Technology, Miliken Family Founda-tion.
Schrum, L. (2005). A proactive approach to research agenda for educa-tional technology.Journal of Research on Technology in Education,37, 217–221.
Smith, L. (2001). Content and delivery: A comparison and contrast of elec-tronic and traditional MBA Marketing planning courses.Journal of Mar-keting Education,23(1), 35–44.
Snyder, S. J., & Vaughan, M. J. (1996). Multimedia & learning: Where is the connection?Developments in Business Simulation and Experiential Exercises,23, 179–180.
Sugahara, S., & Boland, G. (2006). The effectiveness of PowerPoint presen-tations in the accounting Classroom.Accounting Education,15, 391–403. Young, J. R. (2004, August 13). Students say technology has little impact
on teaching.Chronicle of Higher Education,50(49), A28.
APPENDIX A: ACADEMIC ENVIRONMENT EXPECTATION QUESTIONNAIRE
Please circle the number that best describes your answer.
I anticipate my professors will use the following techniques to present course information:
5: Extensively
2. Written handouts or outlines 5 4 3 2 1
3. Class discussion 5 4 3 2 1
4. In-class exercises 5 4 3 2 1
5. Outside classroom assignments 5 4 3 2 1
6. Group activities in class 5 4 3 2 1
7. Student presentation 5 4 3 2 1
8. Overhead projector and transparencies 5 4 3 2 1
9. Videos/DVDs 5 4 3 2 1
10. Computer presentation software (PowerPoint) 5 4 3 2 1
11. Electronic-mail 5 4 3 2 1
12. Computer projects 5 4 3 2 1
(Continued on next page)
EXPECTATIONS OF TECHNOLOGY 301
Please circle the number that best describes your answer.
I anticipate my professors will use the following techniques to present course information:
5: Extensively (almost every
class)
4: Periodically (once/week)
3: Occasionally (6–7 times/
semester)
2: Rarely (1–2
times/ semester) 1: Never
13. Computer simulations 5 4 3 2 1
14. Computer activities in class 5 4 3 2 1
15. Internet resources (accessing the Internet from class) 5 4 3 2 1
To what extent did your instructor use computers during your last academic year? (If freshman, senior year of high school)
16. In-class assignments 5 4 3 2 1
17. Out-of-class assignments 5 4 3 2 1
18. Course material presentation 5 4 3 2 1
19. Communicate through e-mail with students 5 4 3 2 1
20. Course material computer simulations 5 4 3 2 1
Please indicate to what extend you used the following software during the past year:
21. Word-processing software 5 4 3 2 1
22. Internet 5 4 3 2 1
23. E-mail 5 4 3 2 1
24. Spread sheets (Excel, etc.) 5 4 3 2 1
25. Presentation software (PowerPoint, etc.) 5 4 3 2 1
26. Graphics software (Harvard Graphics, etc.) 5 4 3 2 1
27. Games 5 4 3 2 1
28. During the last calendar year, I used a computer an average of: (check one)
(1) 3 hours or less per week (2) 7–10 hours per week
(3) 4–6 hours per week (4) more than 10 hours per week
In my ideal classroom my instructors would use the following:
29. Lecture 5 4 3 2 1
30. Written handouts or outlines 5 4 3 2 1
31. Class discussion 5 4 3 2 1
32. In-class exercises 5 4 3 2 1
33. Outside classroom assignments 5 4 3 2 1
34. Group activities in class 5 4 3 2 1
35. Students presentations 5 4 3 2 1
36. Overhead projector and transparencies 5 4 3 2 1
37.Videos/DVDs 5 4 3 2 1
38. Computer presentation software (PowerPoint) 5 4 3 2 1
39. E-mail 5 4 3 2 1
40. Computer projects 5 4 3 2 1
41. Computer simulations 5 4 3 2 1
42. Computer activities in class 5 4 3 2 1
43. Internet resources (accessing the Internet from class) 5 4 3 2 1 44. Do you have a computer available) for your personal use
(at home, in your room, etc.)?
(1) Yes (2) No
45. Gender (1) Male (2) Female
46. Race (1) White (2) Hispanic
(3) American Indian (4)African American
(5) Asian (6) Other
47. Age (1) 17 years and younger (2) 18–20 years
(3) 21–23 years (4) 24–29 years
(5) 30–39 years (6) 40 years and older
48. Classification (1) Freshman (2) Sophomore
(3) Junior (4) Senior
(5) Other
Thank you for completing this survey.