Xiaoling Zhang, Shibo Li, Raymond R. Burke, & Alex Leykin
An Examination of Social Influence
on Shopper Behavior Using Video
Tracking Data
This research investigates how the social elements of a retail store visit affect shoppers’ product interaction and purchase likelihood. The research uses a bivariate model of the shopping process, implemented in a hierarchical Bayes framework, which models the customer and contextual factors driving product touch and purchase simultaneously. A unique video tracking database captures each shopper’s path and activities during the store visit. The findings reveal that interactive social influences (e.g., salesperson contact, shopper conversations) tend to slow the shopper down, encourage a longer store visit, and increase product interaction and purchase. When shoppers are part of a larger group, they are influenced more by discussions with companions and less by third parties. Stores with customers present encourage product interaction up to a point, beyond which the density of shoppers interferes with the shopping process. The effects of social influence vary by the salesperson’s demographic similarity to the shopper and the type of product category being shopped. Several behavioral cues signal when shoppers are in a potentially high need state and may be good sales prospects.
Keywords: social influence, video tracking, shopper marketing, path analysis, hierarchical Bayes model
Online Supplement: http://dx.doi.org/10.1509/jm.12.0106
Xiaoling Zhang is Assistant Professor of Marketing, Nanyang Business School, and Research Fellow, Institute on Asian Consumer Insight, Nanyang Technological University (e-mail: [email protected]). Shibo Li is Associate Professor of Marketing and Weimer Faculty Fellow (e-mail: shili@ indiana. edu), and Raymond R. Burke is the E.W. Kelley Professor of Business Administration and Director of the Customer Interface Labora-tory (e-mail: [email protected]), Kelley School of Business, Indiana University. Alex Leykin is a Research Associate, Kelley School of Busi-ness, and Adjunct Research Scientist, School of Informatics, Indiana Uni-versity (e-mail: oleykin@ indiana.edu). V. Kumar served as area editor for this article.
S
ocial influence plays an important role in the retail shopping process. It can affect the time shoppers spend in the store, their attitudes toward the merchan-dise, and the specific products they pick up, try on, and pur-chase (Underhill 1999). Although it may seem that retailers have little control over this process, social influence can indeed be a critical element of the firm’s selling strategy. Retailers can exert direct control over the social influence process by managing how sales associates interact with cus-tomers (Pennington 1968; Weitz 1981). Salespeople and customer service representatives can be instructed to engage shoppers in conversations, offer assistance, provide product suggestions and recommendations, and give feedback to shoppers on their product selections.The retailer can also train employees to adapt their per-sonal selling strategies to the specific social scenarios that occur spontaneously during the store’s daily operations (Franke and Park 2006; Weitz, Sujan, and Sujan 1986). Whereas product assortments, pricing, and merchandising
may be relatively stable over time, the customer’s in-store experience changes from minute to minute as people enter the store, interact with the merchandise, strike up conversa-tions with acquaintances and sales associates, and talk on their cell phones. These changes in the size, composition, and activities of social groups can moderate the influence of salesperson interactions and other marketing variables.
In addition, the retailer can indirectly manipulate the social environment through the scheduling of promotions, product assortment decisions, and the design of the physical space (e.g., Lam et al. 2001). Appealing promotions and unique products can create high levels of shopper traffic, increasing the perceived popularity of the store and encour-aging shoppers to touch and buy the merchandise. Retailers need to be cautious not to create too much traffic because shoppers may become stressed by the crowds and leave without making a purchase (Harrell, Hutt, and Anderson 1980). Similarly, the store layout can showcase a variety of attractive products, but if the aisles are too narrow, shoppers may feel that they do not have sufficient personal space and may exit the store prematurely (Underhill 1999).
(e.g., salesperson contact, group discussions, crowding con-ditions) as they navigate through the store. For example, a customer may be greeted by an employee or involved in discussions with companions while walking through a crowded store and pausing to examine merchandise. It would be valuable to know how these different types of social influence affect shoppers’ touch and purchase behav-iors, how these forces interact, and which tools are most effective at moving customers along the path to purchase. These insights have important implications for sales man-agement and the design of retail spaces.
The goals of this research are to understand how the interactions between the various social elements of the store environment affect the shopping process (shopper engage-ment, as measured by product touch and interaction, and purchase conversion) and to develop recommendations for store managers to tailor the environment to optimize store productivity. We examine social influence from the per-spective of social impact theory (SIT; Latané 1981). Using a bivariate hierarchical Bayes model of the shopping process, we study the influence of crowding, shopping group size, customer interaction, and salesperson interac-tion on product touch and purchase, controlling for in-store marketing activities, shopping path, and other environmen-tal factors.
This study uses a unique video tracking data set that records consumers’ entire shopping trips as well as outcome information in an apparel store. The video data capture crowding conditions in the store, consumers’ interpersonal contact with companions and sales associates, cell phone conversations, product touch and trial, and other activities that are important for understanding social influence on shopper behavior. Consumers and sales associates are also visually classified into demographic groups (gender, age, and ethnicity) to measure the impact of demographic simi-larity. In combination with the transactional data, the video tracking provides a comprehensive picture of the cus-tomer’s in-store shopping experience.1
We contribute to the shopper marketing literature in three ways. Theoretically, we extend SIT to explain the influence of social factors on shopper touch and purchase during the course of a retail store visit; the interplay between interactive and noninteractive social influences; and the moderating roles of product categories, shopping group size, and shopper demographics. We discover that two interactive social influences, group discussion and salesperson contact, tend to slow the shopper down, encour-age a longer store visit, and increase product interaction and purchase. In contrast, the noninteractive influence of crowding has an inverted U-shaped relationship with prod-uct touch frequency and a negative impact on customer pur-chase. The latter effect is much larger than the interactive influences, contrary to the predictions of SIT.
Substantively, our study provides several novel and actionable insights for retail store managers to help improve the customer’s in-store shopping experience and purchase
conversion rate. For example, we find that it is beneficial for sales associates to target shoppers who are shopping alone, have similar demographic characteristics, and are shopping in departments where there may be higher uncer-tainty, such as the new arrivals or clearance sections. Shop-pers who carry shopping bags, take a straighter path, walk more slowly, and shop on the gender-appropriate side of the store also seem to be promising prospects on the basis of their propensity to touch and/or purchase items. Further-more, store managers may run traffic-driving events during quiet periods to increase social density and stimulate shop-per interest, especially for new arrivals and clearance items. Methodologically, we develop a bivariate normal process model to capture shoppers’ touch frequency and purchases. This approach treats each shopper’s visit to each department or zone as a social scenario that can be mined for insights about what drives shopper engagement and purchase. In addition, we introduce a new approach for coding and ana-lyzing customer tracking videos, which can be applied to the mining of video data collected in other contexts.
The remainder of the article is organized as follows. In the next section, we review the prior literature on social influence and the shopping process, summarize our concep-tual framework, and present a set of hypotheses. Then, we describe our modeling approach and present the empirical analysis of the tracking data from an apparel store. We con-clude with a discussion of the results and managerial impli-cations of this research.
Background
Prior research has revealed that the social context can have a significant impact on shopper perceptions and behavior. In some cases, this influence is a consequence of the direct interaction between the customer and other shoppers in the store or with a salesperson or customer service representa-tive. For example, Kurt, Inman, and Argo (2011) find that men (but not women) spend more when they shop with a friend. Luo (2005) reports that when shoppers imagine being accompanied by peers, this increases impulse buying, but an imagined trip with family members reduces spend-ing. Baker, Levy, and Grewal (1992) find that the helpful-ness of salespeople in a simulated store visit heightens shopper arousal and willingness to buy.
In other cases, the influence is due to the mere presence of other shoppers in the store. For example, Argo, Dahl, and Manchanda (2005) find that a shopper in the presence of one other person tends to be happier than when shopping alone, but when the number increases to three, happiness drops and the shopper becomes annoyed. When the product category is considered “sensitive” (e.g., condoms), a novice shopper will be embarrassed by the presence of others (Dahl, Manchanda, and Argo 2001). Moreover, when shop-pers see others touching the merchandise, they may per-ceive that the product is “contaminated” and lower their evaluations (Argo, Dahl, and Morales 2006). The exception is when the product is touched by an attractive shopper of the opposite sex, which can increase product evaluations and willingness to pay (Argo, Dahl, and Morales 2008).
Recently, marketers have emphasized the importance of going beyond perceptual, attitudinal, and behavioral out-come measures and recording the customer’s actual shop-ping and purchasing activities in the store (Burke 2006; Hui, Fader, and Bradlow 2009a). Shoppers are often unable to report accurately on their behavior and the causal factors because of forgetting habitual buying, unconscious influ-ences, and social desirability biases (cf. Nesbitt and Wilson 1977). Observational methods enable the researcher to record shopping activities over time and space and measure the impact of social influence at each stage in the shopping process and physical location in the store. One might expect that in apparel, for example, the social factors influencing a shopper’s likelihood of touching a product may be different from those affecting purchase. Similarly, the social factors affecting whether a shopper buys a new product may be dif-ferent from those affecting purchase of a commodity or clearance item.
Several recent studies have used methodological inno-vations, such as radio-frequency identification (RFID) tags, computer vision, wearable video cameras, handheld bar-code scanners, and clickstream analysis, to record the cus-tomer’s observable movement in, and interaction with, a physical retail store, shopping website, or simulated shop-ping environment (Hui, Fader, and Bradlow 2009a; Hui et al. 2013; Stilley, Inman, and Wakefield 2010). In contrast with scanner panel data, the shopping path data encode the sequence of events leading up to a purchase (Montgomery et al. 2004). Path tracking research has significantly enhanced researchers’ understanding of the grocery shop-ping process. For example, studies have revealed that gro-cery shoppers tend to become less exploratory and more purposeful (shopping and buying) as their trip progresses, they are more likely to dwell in “vice” categories after pur-chasing “virtue” products, and they are drawn to areas of the store with high shopper density but spend less time vis-iting these regions (Hui, Bradlow, and Fader 2009). Shop-pers pick up their purchased products in an order that is close to ideal from the perspective of traveling salesman optimality, but they tend to deviate from the most efficient point-to-point path (Hui, Fader, and Bradlow 2009b). Shop-pers are more likely to consider making unplanned pur-chases in categories that are on promotion, have hedonic qualities, are refrigerated, and are encountered later in the trip, whereas purchase conversion is higher for products encountered earlier (while there is still “slack” in the time budget) and when shoppers stand closer to the shelf (Hui et al. 2013).2
Although recent path tracking research has generated several valuable insights about shopper behavior, it has not been as helpful in illuminating the social dynamics of retail shopping. In part, this is due to methodological constraints. Studies using RFID tags to record the location of shopping carts can measure whether shoppers and their carts tend to move toward or away from each other (e.g., attraction and
crowding effects), but they do not reveal the size of the shopping party, shopper discussions, salesperson contact, or product interactions. A second challenge is that most of this research has been conducted in grocery stores. These self-service environments tend to have more solitary shoppers, a higher percentage of planned purchases, and fewer instances of social influence than other retail formats.
The present research investigates both interactive and noninteractive social influences driving product touch and purchase using video tracking data. This provides a more complete picture of the dynamics of consumers’ in-store behavior and the store environment than self-report (e.g., survey, exit interview) or RFID-based tracking studies. Whereas previous studies have typically used grocery data, our data are from a specialty apparel retailer in a shopping mall, which allows the examination of customer–salesperson interactions, an important interactive social influence inside a store. In the next section, we introduce a conceptual framework based on SIT and derive a set of hypotheses, which we then test using a bivariate model of shopper prod-uct touch and purchase (Poisson and probit) implemented in a hierarchical Bayes framework.
Theory and Hypotheses
Latané (1981) developed a theory of social impact that pro-vides a useful foundation for understanding the influence of social factors on shopper behavior. He defines “social impact” as “the great variety of changes in physiological states and subjective feeling, motives and emotions, cogni-tions and beliefs, values and behavior, that occur in an indi-vidual, human or animal, as a result of the real, implied, or imagined presence or actions of other individuals” (p. 343). According to SIT, the degree to which a person’s behavior is influenced by another is a function of the strengthof the source of impact, the immediacyof the event, and the num-ber of sources exerting an influence on the target person. Social impact will be greater when the source of influence has higher status or a closer relationship with the target, when it has high spatial and/or temporal proximity to the target, and when there are multiple sources of influence. Social impact theory predicts that the influence the target person experiences is a multiplicative function of these three factors and increases as a power, t, of the number of sources, where t < 1. Conversely, as the number of different sources increases, the relative impact of each source on the target declines; as the number of targets increases, a source’s impact on each individual target is reduced.
Applications of SIT in psychology have typically exam-ined the influence of the social context on a person’s judg-ment or behavior at a specific time for a narrowly pre-scribed set of conditions (e.g., Latané 1981). However, in a retail context, shopping takes place over time and space, and social factors change dynamically as customers enter the store, navigate the aisles, interact with salespeople, and shop from the available selection of merchandise. In a rela-tively short period of time, there may be hundreds of unique social encounters. Interpersonal factors may play a different role in different departments and product categories, at
ferent stages in the decision process, and for different shop-per profiles.
To understand the dynamics of social influence in a retail setting, we divide the shopping trip into a series of department or zone visits and separately model the factors affecting product touch and purchase for each visit. As shoppers walk through the store, they will often stop to touch and interact with products as part of the information search and evaluation process. This physical interaction helps reduce the uncertainty and risk associated with making a choice. Touch enables the shopper to assess a product’s material properties, such as texture, hardness, temperature, and weight (Peck and Childers 2003), which are important sensory features for evaluating a variety of products, such as apparel, electronics, and automobiles (Underhill 1999). The act of touch can also increase shopper engagement, increase the perceived “ownership” of the object (Peck and Shu 2009), and stimulate impulse purchasing (Peck and Childers 2006). Retailers often encourage consumers to touch and/or try out merchandise to heighten involvement.
In this research, we define touch as any type of physical contact between the shopper and a product, except the final touch of carrying the product to the checkout counter for purchase. A customer’s frequency of product touch indi-cates the seriousness of his or her interest in, or level of engagement with, the product. Although there will be indi-vidual differences in the amount of product examination required before making a purchase decision, in general, the more often products are touched, the higher the level of consideration.
After a shopper identifies a desired product and possi-bly touches it or tries it on, he or she will decide whether to make a purchase. Purchase conversion occurs when there is a close match between consumers’ shopping needs and the available merchandise. In general, we would expect that social factors will have a greater impact on product touch than purchase because touch reflects product interest, unconstrained by the affordability of the item, whereas pur-chase requires a financial commitment. Both touch (an indi-cator of shopper engagement) and purchase conversion rate are important retail performance measures for customer experience management (Burke 2006; DeHerder and Blatt 2011).
As customers shop the store, they are subject to both interactive and noninteractive social influences. Interactive social influence occurs when a shopper holds a conversa-tion with another person in the store, such as a sales associ-ate or companion (e.g., Goff and Walters 1995; Leibowitz 2010; Underhill 1999). We anticipate that interactive social influences will slow down the shopper’s movement through the store, encourage product interaction, and (assuming a positive conversation) increase purchase likelihood. Social influence can also occur without direct interaction, such as when a shopper sees other customers in the store and observes their behavior. Again, this social influence may slow shoppers down, attract their interest, and encourage them to browse the merchandise. However, crowds may also produce a negative emotional response (Argo, Dahl, and Manchanda 2005) and cause shoppers to spend less
time in a department or store (Hui, Bradlow, and Fader 2009).
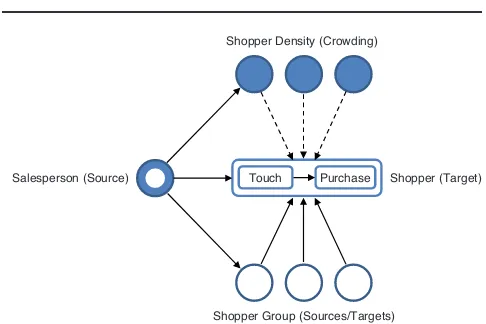
Extending SIT to the retail shopping context, we predict that the influence of other people in a store on a target shop-per’s behavior will increase as (1) the number of other people increases, (2) the immediacy of their interaction with the shopper increases (e.g., personal conversations), and (3) the strength of their relationship increases (e.g., family members). At the same time, the influence of a sales-person on a target shopper will decrease as (1) the number of other people competing for the salesperson’s attention increases and (2) the number of other people influencing the target shopper increases. Figure 1 provides a conceptual framework summarizing the influence of these factors on shopper behavior. We present individual hypotheses in the following sections.
We do not expect that the shape of the relationship between the number of sources of influence and shopper behavior will follow a power function, as predicted by SIT. In a retail store, the presence of other shoppers provides information about the desirability of products, but it also creates a physical obstruction that can interfere with navi-gation, product interaction, and purchase. We predict that the combined effects of these factors will appear as a down-ward concave function, as we discuss next. We also expect that the effects of social influence will depend on the prod-uct department and the individual characteristics of shop-pers and sales associates.
In the following subsections, we focus on three of the most common types of social influence in a retail setting: shopper density (crowding), salesperson contact, and dis-cussions with companions (e.g., friends, family). We exam-ine their impact on consumer touch frequency and purchase decisions and the moderating roles of group size and product category. We also explore the interactions between noninter-active and internoninter-active social influences because customers are often subject to multiple influences simultaneously.
Shopper Density
Shopper density is the physical density or concentration of shoppers within a given space. Social impact theory sug-gests that the larger the number of customers in the
shop-FIGURE 1
Social Influence in a Retail Context
Shopper Density (Crowding)
Shopper Group (Sources/Targets) Touch
ping area, the greater the number of sources, and thus the larger the social impact on the focal consumer. Similarly, social proof theory suggests that the presence of other shop-pers in a store zone may signal high-quality products, thus increasing shopper interest (Cialdini and Goldstein 2004)— the reasoning being that if many others are interested in a product, it must be good.
Before touching a product, consumers may be uncertain about the quality or desirability of the products and prices in the store (Bell and Lattin 1998) and thus learn informa-tion by observing other shoppers. Customers may follow the crowd, engaging in “herd behavior,” which describes how individuals in a group or crowd act together without planned direction. Herd behavior may be common in every-day decisions and works on people’s perceptions that large groups cannot be wrong (Cialdini and Goldstein 2004). In the marketing literature stream, herd behavior occurs in Internet marketing (Hanson and Putler 1996). For example, Dholakia, Basuroy, and Soltysinski (2002) show that buyers in digital auctions gravitate toward listings with existing bids and away from listings without bids, and Chen, Wang, and Xie (2011) find evidence of observational learning from others’ choices in online retailing. Similarly, the pres-ence of more customers in a department or category signals its attractiveness and product quality (Becker 1991). Hui, Bradlow, and Fader (2009) report that, in general, the pres-ence of other shoppers leads a consumer to visit a store zone. However, when the store becomes more crowded, a state of psychological stress results if a customer’s demand for space exceeds the supply (Stokols 1972). Higher shop-per density can be associated with negative feelings and coping strategies (Argo, Dahl, and Manchanda 2005; Arnold et al. 2005; Harrell, Hutt, and Anderson 1980). It can create physical and psychological barriers to shopping, reducing access to products and causing a lack of privacy. An overcrowded store area decreases customers’ demand and interest level. Therefore, we hypothesize that a cus-tomer will be more likely to touch the products when there are other shoppers present; however, as crowding increases, touch frequency will decrease. Formally,
H1a: Shopper density (crowding) has an inverted U-shaped relationship with touch frequency.
We expect that crowding has a negative impact on pur-chase because it can obstruct the shopping process and cre-ate a psychological stcre-ate of stimulus overload from inappro-priate or unfamiliar social contacts (Harrell, Hutt, and Anderson 1980). Milgram’s (1970) theory regarding adap-tation strategies to overload suggests that, in crowded con-ditions, consumers will allocate less time to each stimulus input and thus give less time to each purchase decision. Eroglu, Machleit, and Barr (2005) demonstrate a significant relationship between perceptions of crowding and the dis-ruption of the pursuit of important activities and goals. Hui, Bradlow, and Fader (2009) also find that although the pres-ence of other shoppers attracts consumers to a store zone, it reduces consumers’ tendency to shop there in a grocery store setting. Thus,
H1b: Crowding discourages consumers from buying.
Within-Group Discussions
Shopping is often a social activity, whereby consumers visit stores with friends, family, or peers and talk to others in their shopping group. Inman, Winer, and Ferraro (2009) find that shopping with others, especially members of the same household, leads to a higher incidence of need recog-nition. Shopping companions may make recommendations by pointing out or suggesting products to the lead customer, which can extend the shopping trip and result in more instances of product touch.
We also expect that discussions with fellow shoppers in the same shopping group will encourage consumers to buy because interacting with group members provides more information and reduces the perceived risk of purchase (Underhill 1999; Willis 2008). Hartmann (2010) finds that social interactions within groups have a strong impact on purchase decisions. Underhill (1999, p. 158) reports that if a store can create an atmosphere that fosters product discus-sion, the merchandise “begins to sell itself.” Willis (2008) investigates the role of conversation at or near the time of purchase and finds that the nature and context of the con-versation can change shopper behavior. Thus,
H2: A consumer who talks frequently to other shoppers in his or her shopping group will touch products more fre-quently and is more likely to make a purchase.
Salesperson Contact
Salespeople can play an important role in the shopping process (Sharma 2001). They can help customers find the desired products (Von Riesen 1974) and stimulate interest in new arrivals (Goff, Bellenger, and Stojack 1994). Sales-people help convert needs into purchases by addressing shoppers’ concerns and focusing and reinforcing customers’ desires. They are the most important factor in managing the customer experience (Smith and Wheeler 2002), and their interpersonal effort and engagement are especially impor-tant in discriminating between delightful and terrible shop-ping experiences (Arnold et al. 2005). Underhill (1999) reports that purchase conversion rates increase by 50% when salespeople initiate contact. Thus, salesperson contact should increase the incidence of product touch and purchase.
H3a: A consumer who is approached by and interacts with a salesperson will touch products more frequently and is more likely to make a purchase.
When stores become crowded, sales associates have less opportunity to interact with and influence each shopper, reducing their impact on product touch and purchase. Retail-ers attempt to address this issue by “staffing up” during busy periods, but it can be difficult to accurately predict traffic levels and sales resource requirements, which can change on an hourly basis. Therefore, we expect the following:
H3b: Store crowding reduces the impact of salesperson contact on a consumer’s frequency of product touch and likeli-hood of purchase.
The Moderating Role of Shopping Group Size
nega-tive effects of crowding (Baum, Harpin, and Valins 1975). Group membership enables people to regulate, control, or avoid exposure to the harmful effects of crowding by pro-ducing boundaries that reduce the experience of crowding (Paulus and Nagar 1989). Cohesive groups can shield group members from unwanted interactions, insulating the group from the external world (Willis 2008). Social impact theory leads to a similar prediction: as the size of the shopping group increases, the relative impact of crowds on the target shopper’s behavior will be reduced. Thus,
H4: As the shopping group increases in size, it reduces the impact of crowding on shoppers’ touch frequency and purchase.
As we discussed previously, SIT predicts that the degree of social influence is positively related to the source strength and the number of people who are the sources of influence. Because the shopping group typically includes family members, friends, or peers who have previous relationships with each other before the shopping trip, the source strength of these people is high. Furthermore, as the size of a shopping group increases, there are more sources of impact. Therefore, we expect that within-group discus-sions will have a greater impact on consumer touch and purchase decisions.
H5: The shopping group size strengthens the impact of within-group discussions on touch frequency and purchase.
According to SIT, when a group is the target of influence, the social impact will be divided among all the individual members. People feel less accountable as the number of group members increases. If a salesperson talks to a shop-ping party, as the shopshop-ping group grows larger, the amount of persuasion experienced by each shopper in the group will be smaller. Thus,
H6: The shopping group size mitigates the impact of sales-person contact on product touch frequency and purchase.
Product Type
In addition to group size, there are several other contextual and motivational factors that may affect how shoppers respond to social forces at the point of purchase. One is the type of product category being shopped. Shoppers have dif-ferent levels of familiarity with the merchandise sold in retail stores, and this will affect their sensitivity to interac-tive and noninteracinterac-tive social influences. For new items, such as seasonal apparel and consumer electronics, shop-pers typically have limited product knowledge and will be more receptive to social cues from friends, sales associates, and other shoppers to decide “what’s hot and what’s not.” Shoppers who are hunting for bargains will also rely on social cues (e.g., people congregating around a clearance rack, conversations with salespeople) to spot the best deals. In contrast, social factors will play less of a role in the pur-chase of commodity products (e.g., khakis, polo shirts) and may actually interfere with shopping for highly personal items, such as fashion accessories and underwear. To explore these relationships, we incorporate both the main effects of product category (i.e., new arrivals, accessories, and clearance items) and the interactions of category with
the key social influence variables (crowding, within-group discussions, and salesperson contact) on touch frequency and purchase to measure these effects.
Shopper and Salesperson Demographics
Another important consideration is the demographic simi-larity of the shopper and sales associate. Shoppers may be more likely to identify with, and be influenced by, sales-people who are the same gender, ethnicity, and/or age as they are (Evans 1963). To investigate this issue, we created three binary variables—gender congruence, age congru-ence, and ethnicity congruence—to capture whether the gender, age, and/or ethnicity of the salesperson matches the shopper during an interaction.
Shopper Motivation and In-Store Activities
Prior research by Hui, Bradlow, and Fader (2009) and Mont-gomery et al. (2004) reveals that a customer’s likelihood of shopping/buying may also be influenced by his or her shop-ping path through the store. We control for such effects by incorporating the shopper’s shopping path information: cumulative sinuosity (curvature of the path), distance covered, and whether the customer stays on the gender-appropriate side of the store. Furthermore, Stilley, Inman, and Wake-field (2010) demonstrate the impact of sales promotion on in-store decision making, and Inman, Winer, and Ferraro (2009) find that customer activities and characteristics can affect in-store unplanned purchases. Thus, we include in the model the impact of marketing promotions (sidewalk sales) and the shopper’s in-store activities (e.g., talking on the phone, visiting the dressing room). Finally, prior research (Goff and Walters 1995; Montgomery et al. 2004) has sug-gested that a shopper’s motivation or orientation before the store visit may affect his or her purchase behavior. There-fore, we construct two proxy variables—the shopper’s ini-tial speed of walking into the store and whether the cus-tomer carries a shopping bag when entering the store—to capture the shopper’s initial level of motivation. Walking speed may reflect the intensity of information processing and/or the urgency of the customer’s need, and the number of shopping bags may indicate whether a customer is in a “shopping mode” and thus more likely to buy (see Dhar, Huber, and Khan 2007).
Model Setup
on both touch frequency and purchase probability at the zone visit occasion level. We denote consumer i’s touch fre-quency by TFitat zone visit occasion t. We also denote con-sumer i’s zone purchase decision by Bit, which equals 1 if he or she buys at occasion t and 0 otherwise.
A consumer’s touch and purchase decisions are assumed to be determined by his or her latent product engagement and purchase utility, respectively. The con-sumer can touch products in the store without buying, and vice versa.3Furthermore, there may be unobserved environ-mental factors that drive both touch and purchase. There-fore, we define a bivariate normal latent process by allow-ing consumer product engagement (mit) and purchase utility (Uit) to be correlated. Specifically, we have
where X1 and X2 are the covariates that affect the con-sumer’s engagement and purchase utility, respectively, which we discuss in detail subsequently. biand giare vec-tors of individual-level coefficients of the covariates to be estimated. The two error terms (eit and dit) are correlated with a bivariate normal distribution of BN(0, S), where Sis a 2 ¥2 variance–covariance matrix. Because of the binary nature of the purchase decisions, we normalized the vari-ance of ditto 1 for identification purposes.
Touch Frequency
We assume that a consumer’s touch frequency at a zone visit occasion follows a Poisson distribution. A hierarchical Poisson regression is deemed appropriate to model touch frequency (Breslow 1984). Specifically, we have
As Equation 1 shows, we allow consumer engagement mitto be a function of covariates (X1) including social influence and marketing promotions. We also incorporate product category variables (i.e., new arrivals, accessories, and clear-ance), shopping path, and in-store activities to control for their impacts on touch frequency. Formally, we have
(2) P TF n exp
where bi0denotes consumer i’s intrinsic propensity to touch a product in the store. The coefficient bi1captures the influ-ence of crowding on consumer touch frequency, and bi2 models the potential curvilinear relationship with touch (H1a). The variable TalkFreqitrefers to the frequency of the consumer’s conversations with fellow shoppers, and the coefficient bi3captures the main effect of these discussions on consumer i’s touch frequency (H2).4The coefficient for SalesContactit, bi4, captures the main effect of salesperson contact on shopper i’s touch frequency (H3a), and bi6 mea-sures how crowding conditions interact with salesperson contact to determine touch frequency (H3b). The parameter bi9 captures the moderating effect of shopping group size on crowding (H4), bi10 measures its moderating effect on discussions (H5), and bi11captures its moderating effect on salesperson contact (H6).
The coefficient bi8ccaptures the impact of product cate-gories (i.e., new arrivals, accessories, and clearance) on touch frequency, where c represents different product cate-gories. Parameters bi12c, bi13c, and bi14cspecify the moder-ating effects of product category on the impact of crowding, within-group discussions, and salesperson contact on touch frequency, respectively. The coefficients bi17, bi18, andbi19 capture the effects of gender, ethnicity, and age congruence between the consumer and the salesperson during instances of salesperson contact, respectively. The term Pathit includes the consumer’s cumulative sinuosity of his or her path (path curvature), distance covered, and whether the consumer stays on the side of the store matching his or her gender; the vector of coefficients bi20estimates the effects. The coefficient bi21measures the consumer’s time spent in cell phone conversations, and bi22 indicates the impact of the store’s sidewalk sale on a consumer’s touch behavior.
To capture individual heterogeneity, we model the vec-tor of response coefficients biusing a random effects model (Rossi, McCulloch, and Allenby 1996):
where b is a vector of aggregate level means of bi. The unobservable heterogeneity component h1iis normally dis-tributed with mean 0 and variance–covariance matrix Sb.
(3) log TalkFreq Category
Purchase
We assume that the consumer’s purchase decision at a zone visit occasion is driven by his or her purchase utility (Uit), which is a function of the same classes of social influence, marketing, and other control variables used in the previous model. We build in a recursive structure in which touching leads to purchase, but not vice versa, to account for the pos-sibility that touching has a direct influence on purchase in addition to the other explanatory variables. Therefore, we add four independent variables—touch frequency during the current zone visit (TouchFreqit), cumulative touch
fre-where gi0denotes consumer i’s intrinsic preference to pur-chase. The explanatory variables are defined similarly to the counterparts in the consumer engagement function in Equation 3. The parameter gi1captures the impact of crowd-ing on consumer i’s purchase decision (H1b). The coeffi-cient gi3denotes the influence of within-group discussions on purchase (H2). The parameter gi4tests the main effect of salesperson contact (H3a), and gi6measures the interaction between crowding and personal selling (H3b). The coeffi-cient gi9measures the moderating effect of shopping group size on crowding (H4), gi10 measures its moderating effect on group discussions (H5), and gi11captures its moderating influence on salesperson contact (H6).
Similar to Equation 4, we also model the vector of the coefficients giusing a random effects approach:
where gis the aggregate mean of gi. We assume the unob-served heterogeneity component h2i to follow a multivari-ate normal distribution of MVN(0, Sg) with mean 0 and 1996). The Web Appendix presents the detailed estimation procedure and Markov chain Monte Carlo algorithm.
Data
The data were collected in a retail apparel store located in a suburban shopping mall in the Midwest region of the United States. Its customer demographics represent a diverse population on age (67% adults, 31% teenagers, and 2% children) and gender (59% female and 41% male shop-pers), with somewhat less variance on ethnicity (86% Cau-casian, 14% others). The test store belongs to a popular retail chain based in the United States, and all of the chain’s stores use a standardized floor plan and assortment of mer-chandise. The store format is typical of other specialty apparel stores in the United States, with men’s merchandise organized on one side of the store, women’s on the other side, a cash wrap area in the center, and fitting rooms in the back.
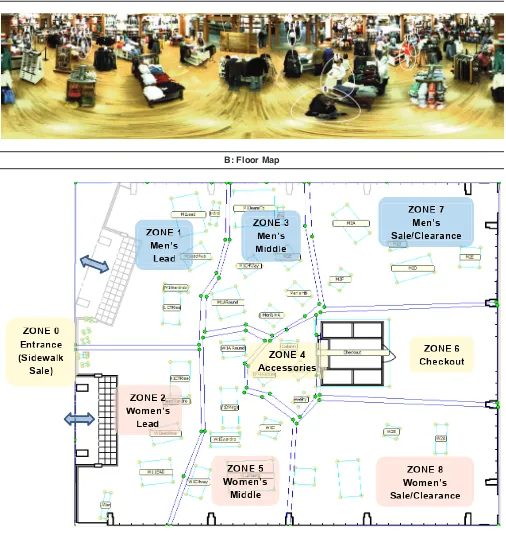
A six-lens panoramic video camera was installed in the ceiling of the store and recorded customer shopping activi-ties within the store (see Figure 2). We collected and ana-lyzed the data for three days in 2006: January 10, 12, and 19. We selected these specific dates because there was a weeklong sidewalk sale beginning on January 12, 2006, and we wanted to compare shopper behavior during the sale with behavior immediately before and after the sale (Janu-ary 10 and 19, respectively). In addition, shopping patterns and social influence processes during this period are likely to be more typical of the year than during the holiday shop-ping season. Each data set is approximately one hour, from 4:00 P.M. to 5:00 P.M., which is the peak period of customer traffic during the day. A computer program tracked cus-tomers’ movement and navigation to generate information on shopping path and store conditions (e.g., crowding).
We manually coded customer demographics and in-store activities (e.g., touching, trying on, buying products, talking to fellow shoppers) and cross-checked them at a later time. We added five time tags as well: the start and end points of product touch, phone conversations, salesperson contact, conversations with fellow shoppers, and dressing room visits. Therefore, we know whether these events occurred and the exact time and duration of the events.
We define touch as any type of zone-level physical con-tact between the shopper and a product, except the final touch of carrying the product to the checkout counter for purchase.5The measurement of touch frequency is specific to both the shopper and the visit occasion. We define group
size as the number of members in a shopping group or party. Talk frequency is measured by the number of distinct conversations between a shopper and his or her compan-ions. When there is an apparent pause between two conver-sations (longer than five seconds), we increased the fre-quency of customer discussions by 1. We define salesperson contact as verbal interaction between the shopper and a sales associate (e.g., offering help and information), FIGURE 2
Retail Store Layout
A: Panoramic Image of Store and Customer Tracking
exclusive of initial greetings. We define crowding as the number of other shoppers present in a zone 30 seconds before the consumer enters the zone.
Figure 2, Panel A, provides an example image of video tracking, with the ellipses representing projected models of each human body and the numerical labels containing a unique tracked customer ID. When we combine video data with transactional data, we can calculate overall store trip– level purchase conversion rates. It also enables us to iden-tify exactly which zone and when (in terms of zone visit occasion) a purchase occurs. From the product placement, we divided the store into eight zones or spatial clusters after consulting with the store manager and referring to the store layout. Figure 2, Panel B, presents the store floor map. The store has two large rooms divided by wing walls: Room 1 (Zones 1–5) in the front of the store and Room 2 (Zones 6– 8) in the back. At the time of data collection, all of Room 2 featured products on sale or clearance. This was a unisex store, with men’s merchandise on the left-hand side as cus-tomers enter the store (Zones 1, 3, and 7) and women’s products on the right-hand side (Zones 2, 5, and 8). We sep-arated out the accessories area (Zone 4), which includes a jewelry tower, sunglass fixture, men’s H-unit fixture (fea-turing boxers and belts), and the checkout area (Zone 6). There were no product displays at the checkout counter; customers simply completed their transactions there. We traced each purchase to the zone where the product was fea-tured and picked up by a customer.
After closer inspection of Room 1, we distinguished the lead zones (Zones 1 and 2) from the middle zones (Zones 3 and 5). A row of lead tables and wardrobes featured new arrivals displayed in the most conspicuous places. Fixtures between the lead zones and Room 2 were classified in the middle zones, and they displayed full-priced general apparel items, such as khakis, denim jeans, and polo shirts. We tracked both shopping paths and customer in-store activities at the zone visit occasion level.
In the three hours of video, there were 1,400 observa-tions (zone visits) in total, which represent the paths of 169 completely tracked customers, with 63 buyers. The sample store trip–level purchase conversion rate was 37.3%. For the three days of observation, there were 19 buyers out of 59 customers on the first day (32.2%), 22 out of 54 on the second day (40.7%), and 22 out of 56 on the third day (39.3%). The average zone-level touch frequency was .52, and the mean zone purchase probability was .07.
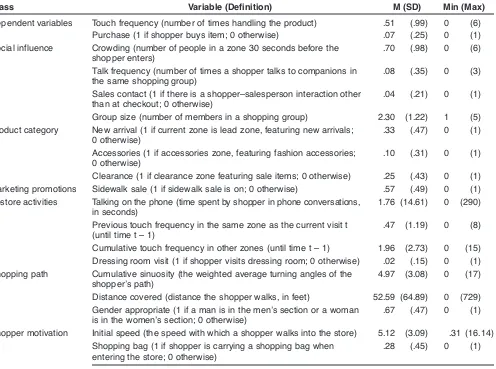
We grouped the variables derived from the data into seven classes: (1) social influence factors: crowding, frequency of speaking to fellow shoppers in the same shopping group, salesperson contact, and shopping group size; (2) product category: new arrivals (lead zone), accessories, clearance, and regular/middle zone; (3) marketing promotions: side-walk sales; (4) shopper in-store activities: talking on the phone, cumulative touch frequency in the current zone, cumulative touch frequency in other zones, and dressing room visits; (5) shopping path information: cumulative sin-uosity, distance covered, and whether the customer stays on the gender-appropriate side of the store; (6) proxies for shopper motivation: initial speed of walking into the store
and whether the customer carries a shopping bag when entering the store; and (7) demographic congruence: the match of the gender, age, and ethnicity of the customer and salesperson in the presence of salesperson contact. A list of zone-level summary statistics for these variables appears in Table 1. For model validation purposes, we use January 12 and 19 data as the estimation sample and use January 10 data as the holdout sample. In the estimation sample, we have 740 observations.
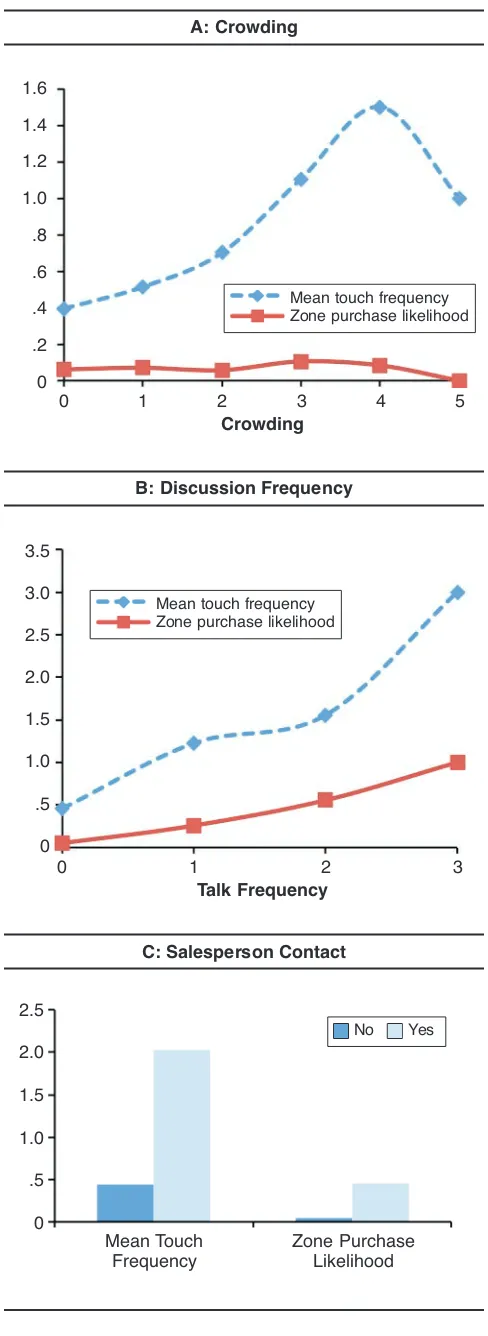
Before presenting the results of the models, we first plot touch frequency and purchases under different social conditions to determine whether the relationships are in the hypothesized directions. Panels A, B, and C of Figure 3 show the touch frequency and purchase under different crowding levels, within-group discussion levels, and salesperson contact conditions, respectively. We observe an inverted U-shaped relationship between crowding and touch frequency, a somewhat linear declining trend of the effect of crowding on purchase, and positive impacts of within-group discussions and salesperson contact on both touch frequency and purchases, which are consistent with our hypotheses.
Results and Analysis
The estimated proposed model fits the data well with the log-marginal density of –1,596.41 (Chib and Greenberg 1995; Newton and Raftery 1994). For touch frequency, the mean absolute error is .22 and the root mean square error is .33 in the estimation sample. In the holdout sample, the mean absolute error is .62 and the root mean square error is 1.05. For purchase decisions, the hit rate is 96.7% in the estimation sample and 93.0% in the holdout sample.
To test for potential problems with multicollinearity, we checked the correlations among the independent variables and the variance inflation factors for the two equations (see the Web Appendix). After dropping the TalkFreq ¥Accessories variable (highly correlated with other discussion variables), the highest correlation for the two equations is –.49, which is low. Furthermore, the variance inflation factor is 4.17 for the touch equation and 3.99 for the purchase equation, both of which are much less than 10. Therefore, we conclude that multicollinearity is not an issue in the study (Belsley, Kuh, and Welsch 1980).
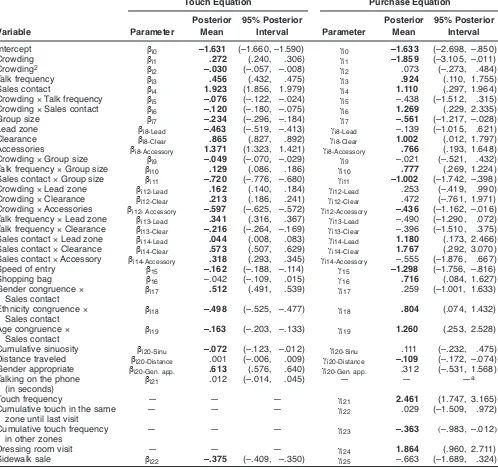
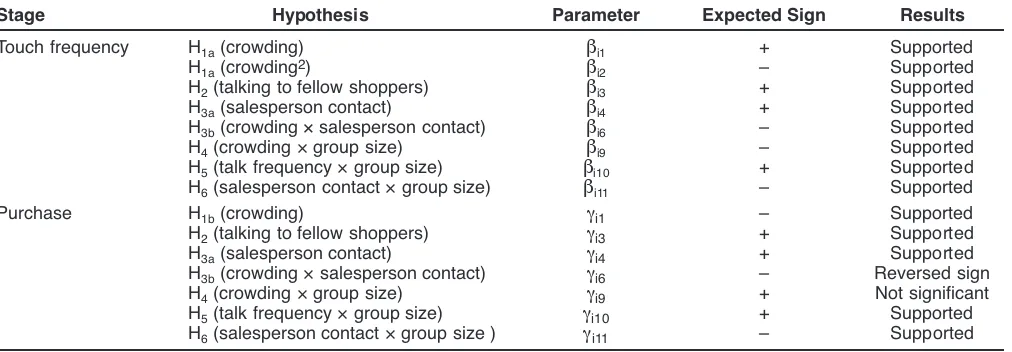
Estimation results from the proposed model appear in Table 2, and significant estimates appear in bold (i.e., zero does not lie in the 95% posterior probability interval). Table 3 summarizes the results of the hypothesis testing. Overall, the hypotheses are largely supported.
Touch Frequency
The touch frequency model reveals that both noninteractive (crowding) and interactive (within-group discussion and salesperson contact) social factors have a significant impact on shopper behavior. All of the hypotheses for touch fre-quency (H1–H6) are supported, with parameter estimates significant at the 95% probability level or higher and in the expected direction (see Table 3).
Shopper density (crowding). The presence of people in
the merchandise in these departments (bi1= .272). Shoppers seem to be attracted to the more crowded regions of the store, but there are decreasing returns for increased shopper density (bi2= –.030). The observed inverted U-shaped rela-tionship between crowding and touch frequency (Figure 3, Panel A) is consistent with H1abut departs from SIT’s pro-posed power function (Latané 1981).
Although shoppers seem to be sensitive to the presence of other patrons, this crowding effect is lower for larger shopping groups (bi9 = –.049), as H4 predicts. Shoppers who visit the store with friends or family are less likely to be drawn to crowded departments. Similarly, shoppers who are engaged in conversations with companions are less attracted to crowded departments (bi5= –.076), presumably because the focal shopper has closer relationships with companions than with the strangers in the crowd.
We also observed a main effect of shopping group size on touch frequency. As the size of the group increases, each of the members is less likely to touch products (bi7= –.234). This effect may be a consequence of group heterogeneity. As the size of the shopping party increases, members are more likely to have divergent interests, and some may just be “along for the ride,” not serious buyers.
As we expected, shoppers’ response to crowding varies across product categories. The presence of other shoppers in
lead zones and clearance areas stimulates product interactions (bi12new arrival= .162; bi12clearance= .213), but it discourages people from shopping for accessories (bi12accessories= –.597). This may be because shoppers are seeking information on the quality and popularity of new arrivals in the lead zones and the promotions in the clearance areas, and thus the herding effect in these areas may be stronger. In contrast, shoppers may require more private space to evaluate per-sonal items such as fashion accessories and underwear.
Within-group discussion. The results also reveal that
shoppers are influenced by their direct interactions with other people in the store. Shoppers who talk to their com-panions during a store visit are likely to touch more prod-ucts, as H2predicts (bi3= .456). This effect was greatest in the lead zones featuring the latest (and often most expen-sive) new arrival items (bi13new arrival= .341), whereas dis-cussions in the clearance section led to a lower incidence of product touch (bi13clearance= –.216). This could be because group discussions about new items generate more excite-ment and interest, and therefore more touching, than discus-sions about clearance items. As the size of the group increases, these discussions have an even greater positive impact on touch frequency (bi10= .129), as H5predicts. TABLE 1
Zone-Level Summary Statistics
Class Variable (Definition) M (SD) Min (Max)
Dependent variables Touch frequency (number of times handling the product) .51 (.99) 0 (6) Purchase (1 if shopper buys item; 0 otherwise) .07 (.25) 0 (1) Social influence Crowding (number of people in a zone 30 seconds before the .70 (.98) 0 (6)
shopper enters)
Talk frequency (number of times a shopper talks to companions in .08 (.35) 0 (3) the same shopping group)
Sales contact (1 if there is a shopper–salesperson interaction other .04 (.21) 0 (1) than at checkout; 0 otherwise)
Group size (number of members in a shopping group) 2.30 (1.22) 1 (5) Product category New arrival (1 if current zone is lead zone, featuring new arrivals; .33 (.47) 0 (1)
0 otherwise)
Accessories (1 if accessories zone, featuring fashion accessories; .10 (.31) 0 (1) 0 otherwise)
Clearance (1 if clearance zone featuring sale items; 0 otherwise) .25 (.43) 0 (1) Marketing promotions Sidewalk sale (1 if sidewalk sale is on; 0 otherwise) .57 (.49) 0 (1) In-store activities Talking on the phone (time spent by shopper in phone conversations, 1.76 (14.61) 0 (290)
in seconds)
Previous touch frequency in the same zone as the current visit t .47 (1.19) 0 (8) (until time t – 1)
Cumulative touch frequency in other zones (until time t – 1) 1.96 (2.73) 0 (15) Dressing room visit (1 if shopper visits dressing room; 0 otherwise) .02 (.15) 0 (1) Shopping path Cumulative sinuosity (the weighted average turning angles of the 4.97 (3.08) 0 (17)
shopper’s path)
Distance covered (distance the shopper walks, in feet) 52.59 (64.89) 0 (729) Gender appropriate (1 if a man is in the men’s section or a woman .67 (.47) 0 (1)
is in the women’s section; 0 otherwise)
Shopper motivation Initial speed (the speed with which a shopper walks into the store) 5.12 (3.09) .31 (16.14) Shopping bag (1 if shopper is carrying a shopping bag when .28 (.45) 0 (1)
Salesperson contact. The findings indicate that retailers can exert a direct influence on shopper behavior by encour-aging sales associates to approach shoppers. When a sales-person interacts with a customer, this leads to a higher fre-quency of product touch (bi4 = 1.923), as H3a predicts. Salespeople were most effective at increasing shopper engagement for products in the clearance (bi14clearance = .573), accessories (bi14accessories = .318), and new arrivals sections of the store (βi14new arrival= .044), perhaps because these items were less familiar to shoppers than the com-modity goods (e.g., khakis, polo shirts, graphic tees) sold in the center of the store.
However, the influence of salespeople on shopper engagement is reduced by the presence of other people in the store. When crowds are present, the salesperson’s interaction with the customer has less impact on product touch (bi6= –.120), in support of H3b. Shoppers may be distracted by other customers in the store and/or take cues from them about which products are most desirable. Similarly, when shop-pers are members of a larger shopping group, this reduces the salesperson’s ability to encourage product touch (bi11= –.720), in support of H6. These findings are consistent with SIT, which predicts that a source’s influence is reduced when there are multiple competing targets of influence.
The demographics of the salesperson (gender, age, and ethnicity) seem to moderate the impact of salesperson con-tact. When the gender of the salesperson matches the shop-per, this increases the shopper’s touch frequency (bi17 = .512), consistent with Evans’s (1963) theory of buyer–seller similarity. Surprisingly, ethnicity and age congruence had the opposite effect (bi18= –.498, bi19= –.163). When sales associates approached shoppers of the same ethnicity or age, shoppers were less likely to touch products. Perhaps the comments from the demographically similar sales asso-ciate were more persuasive or relevant, reducing the shop-per’s need for touch. In any case, a demographic match had a positive impact on purchase likelihood, as we report in the next section.
The findings suggest that there are behavioral clues that the salesperson can use to identify shoppers who have a higher need state and may be more responsive to a sales intervention. Shoppers are likely to touch more often if they walk into the store more slowly (b15entry speed= –.162), walk in a straighter path (bi20sinu = –.072), and/or enter a zone that is gender appropriate (i.e., men in the men’s section and women in the women’s section; bi20gender app.= .613).
Store layout. One might expect that a sidewalk sale
would increase shopper engagement, stimulating customers to enter the store and interact with the merchandise. How-ever, we observed the opposite effect: the sidewalk sale was associated with lower touch frequency inside the store (bi22= –.375). This could be due to several factors. Shoppers may have browsed the sidewalk sale racks and decided there was nothing of interest, so they never entered the store. Social influence may have also played a role in this effect. If the sidewalk sale reduced in-store shopper density, customers may have been less attracted to the in-store merchandise.
It should be noted that product category has a significant main effect on shoppers’ frequency of touching products.
0 1 2 3 4 5
1.6
1.4
1.2
1.0
.8
.6
.4
.2
0
Crowding
FIGURE 3
Touch Frequency and Purchase Under Different Social Conditions
A: Crowding
B: Discussion Frequency
Mean touch frequency Zone purchase likelihood
C: Salesperson Contact
0 1 2 3
3.5
3.0
2.5
2.0
1.5
1.0
.5
0
Talk Frequency
Mean Touch Frequency
Zone Purchase Likelihood 2.5
2.0
1.5
1.0
.5
0
No Yes Mean touch frequency
Customers touch products more often in accessories and clearance than they touch new arrivals (bi8new arrival= –.463, bi8clearance = .865, bi8accessories = 1.371), possibly because the prices of accessories and clearance items are lower and attract more attention and interest from the shopper com-pared with the new arrivals and other items in the store. Accessories may also be smaller and require closer, physi-cal examination.
Purchase
We also observe support for most of the hypotheses involv-ing product purchase (see Table 3). Parameter estimates were
significant at the 95% probability level and in the expected direction.6
Shopper density (crowding). Although crowds can
stimu-late shopper interaction with products, they have the opposite effect on purchase conversion rate. Shoppers are less likely to buy merchandise when the store is crowded, consistent with H1b(gi1= –1.859). Crowds seem to interfere most with TABLE 2
Estimation Results: Proposed Model
Touch Equation Purchase Equation
Posterior 95% Posterior Posterior 95% Posterior Variable Parameter Mean Interval Parameter Mean Interval
Intercept bi0 –1.631 (–1.660, –1.590) gi0 –1.633 (–2.698, –.850) Crowding bi1 .272 (.240, .306) gi1 –1.859 (–3.105, –.011) Crowding2 b
i2 –.030 (–.057, –.008) gi2 .073 (–.273, .484) Talk frequency bi3 .456 (.432, .475) gi3 .924 (.110, 1.755) Sales contact bi4 1.923 (1.856, 1.979) gi4 1.110 (.297, 1.964) Crowding ¥Talk frequency bi5 –.076 (–.122, –.024) gi5 –.438 (–1.512, .315) Crowding ¥Sales contact bi6 –.120 (–.180, –.075) gi6 1.269 (.229, 2.335) Group size bi7 –.234 (–.296, –.184) gi7 –.561 (–1.217, –.028) Lead zone bi8-Lead –.463 (–.519, –.413) gi8-Lead –.139 (–1.015, .621) Clearance bi8-Clear .865 (.827, .892) gi8-Clear 1.002 (.012, 1.797) Accessories bi8-Accessory 1.371 (1.323, 1.421) gi8-Accessory .766 (.193, 1.648) Crowding ¥Group size bi9 –.049 (–.070, –.029) gi9 –.021 (–.521, .432) Talk frequency ¥Group size bi10 .129 (.086, .186) gi10 .777 (.269, 1.224) Sales contact ¥Group size bi11 –.720 (–.776, –.680) gi11 –1.002 (–1.742, –.398) Crowding ¥Lead zone bi12-Lead .162 (.140, .184) gi12-Lead .253 (–.419, .990) Crowding ¥Clearance bi12-Clear .213 (.186, .241) gi12-Clear .472 (–.761, 1.971) Crowding ¥Accessories bi12- Accessory –.597 (–.625, –.572) gi12-Accessory –.436 (–1.162, –.016) Talk frequency ¥Lead zone bi13-Lead .341 (.316, .367) gi13-Lead –.490 (–1.290, .072) Talk frequency ¥Clearance bi13-Clear –.216 (–.264, –.169) gi13-Clear –.396 (–1.510, .375) Sales contact ¥Lead zone bi14-Lead .044 (.008, .083) gi14-Lead 1.180 (.173, 2.466) Sales contact ¥Clearance bi14-Clear .573 (.507, .629) gi14-Clear 1.767 (.292, 3.070) Sales contact ¥Accessory bi14-Accessory .318 (.293, .345) gi14-Accessory –.555 (–1.876, .667) Speed of entry b15 –.162 (–.188, –.114) g15 –1.298 (–1.756, –.816) Shopping bag b16 –.042 (–.109, .015) g16 .716 (.084, 1.627) Gender congruence ¥ bi17 .512 (.491, .539) gi17 .259 (–1.001, 1.633)
Sales contact
Ethnicity congruence ¥ bi18 –.498 (–.525, –.477) gi18 .804 (.074, 1.432) Sales contact
Age congruence ¥ bi19 –.163 (–.203, –.133) gi19 1.260 (.253, 2.528) Sales contact
Cumulative sinuosity bi20-Sinu –.072 (–.123, –.012) gi20-Sinu .111 (–.232, .475) Distance traveled bi20-Distance .001 (–.006, .009) gi20-Distance –.109 (–.172, –.074) Gender appropriate bi20-Gen. app. .613 (.576, .640) gi20-Gen. app. .312 (–.531, 1.568) Talking on the phone bi21 .012 (–.014, .045) — .— . —a
(in seconds)
Touch frequency — .— . — gi21 2.461 (1.747, 3.165) Cumulative touch in the same — .— . — gi22 .029 (–1.509, .972)
zone until last visit
Cumulative touch frequency — .— . — gi23 –.363 (–.983, –.012) in other zones
Dressing room visit — .— . — gi24 1.864 (.960, 2.711) Sidewalk sale bi22 –.375 (–.409, –.350) gi25 –.663 (–1.689, .324)
aDropped because it predicted failure perfectly.
Notes: Boldfaced entries indicate that the 95% posterior probability interval excludes zero.
the purchase of accessories (gi12Accessories= –.436), perhaps because of the personal nature of these products.
The size of the shopper group does not moderate the negative crowding effect, contrary to the prediction of H4. These findings run counter to SIT, which would predict that the negative feelings created by crowds (reported by Argo, Dahl, and Manchanda [2005] and others) would be diffused by the shopper’s membership in a larger shopping group. At a certain point, shopper density becomes so great that it physically interferes with the customer’s ability to touch and buy merchandise, independent of group size (see Figure 3, Panel A). Shopping group size did have a main effect on purchase, mirroring its effect on touch, with larger shopping groups having a lower likelihood of individual purchase (gi7= –.561). As noted previously, we suspect that larger groups may have more browsers and fewer serious buyers.
Within-group discussion. When shoppers interact with
their friends and family in the shopping group, this increases their purchase likelihood (gi3 = .924), and the effect is magnified with larger shopping groups (gi10 = .777). These findings support the predictions in H2and H5.
Salesperson contact. When a salesperson interacts with
a customer, this increases the shopper’s likelihood of buy-ing, consistent with H3a(gi4= 1.110). Sales contact had the greatest positive impact on the purchase of new arrival and clearance items (gi14new arrival= 1.180, gi14clearance= 1.767). When the shopper is accompanied by friends and family, this reduces the salesperson’s influence on purchase, as pre-dicted by H6(gi11= –1.002). Contrary to H3b, there was a significant positiveinteraction between salesperson contact and crowding. It seems that personal selling plays an even greater role when the store is busy, helping mitigate the negative effects of crowding on purchase (gi6 = 1.269). Salespeople may help shoppers overcome the physical and psychological barriers created by crowds, providing the desired access to product information and inventory and thereby “closing the sale.”
As we noted previously, the match of the salesperson’s gender had a significant positive impact on the shopper’s touch frequency, but this effect was not significant for
pur-chase. However, a match on ethnicity and age did increase purchase likelihood (gi18 = .804, gi19 = 1.260). All of the demographic congruence effects were in the positive direc-tion, in support of Evans’s (1963) theory of buyer–seller similarity.
Again, shoppers’ behavior provides clues about who is the best prospect. Purchase likelihood is higher for shoppers who walk more slowly (g15= –1.298) and cover shorter dis-tances (gi20distance = –.109). By far, the best predictors of purchase are shoppers’ frequency of touching products dur-ing their current visit to the department (gi21 = 2.461) and whether shoppers visit the dressing room (gi24= 1.864). In contrast, when shoppers touch more products in other zones, they are less likely to buy from the current zone (gi23= –.363), which indicates a competition effect across the departments in the store.
Product category. Shoppers were more likely to buy from
clearance and accessories (gi8clearance= 1.002, gi8accessories= .766), perhaps because these items were lower priced and accessories were easy to try on and located near the check-out counter. These categories were also most likely to be touched.
Discussion
An important goal of retail promotion is to attract qualified shoppers to the store to drive sales. Our findings suggest that it can also be beneficial for stores to attract people who are simply browsing because this will increase shopper den-sity, stimulating other shoppers to take an interest in and interact with the products. As Argo, Dahl, and Manchanda (2005, p. 211) report, “no one likes to be alone in a retail environment.” Prospective customers may feel more “at home” in a store with other shoppers, infer product desir-ability from their interaction with products (the herd effect), and be tempted to model their behavior. Shoppers may also be more comfortable shopping in a popular store because the other patrons serve as a foil to deflect the advances of aggressive salespeople. New arrivals and clearance items seem to benefit the most from nearby shopper traffic, per-TABLE 3
Hypothesis Testing Results
Stage Hypothesis Parameter Expected Sign Results