CHARACTERIZATION COMPOUND FROM EXTRACT CHLOROFORM
LEAVES
M. umbellata
(Houtt.) Stapf var. Degrabrata K. AND
TEST ANTIHYPERGLYCEMIC ACTIVITY
Imran
1, Nunuk Hariani S.
1, and Hanapi Usman
11
Chemistry Department, Science Faculty, Hasanuddin University, Makassar, South Sulawesi,
90245
Abstrak.
Penelitian karakterisasi senyawa dari ekstrak kloroform daun
M. umbellata
(Houtt.) stapf
var. degrabrata K. dan uji aktivitas antihiperglikemik telah dilakukan. Penelitian ini bertujuan
untuk mengisolasi dan mengkarakterisasi senyawa dari ekstrak kloroform serta menentukan
konsentrasi optimum dari ekstrak kloroform dalam menurunkan kadar glukosa darah. Isolasi
senyawa dari ekstrak kloroform dilakukan dengan cara maserasi, fraksinasi, dan pemurnian.
Berdasarkan hasil analisis spektroskopi IR dan NMR, senyawa yang berhasil diisolasi dari
penelitian ini adalah
β
-
sitosterol dan senyawa asam lemak yang terdiri dari 25 atom karbon.
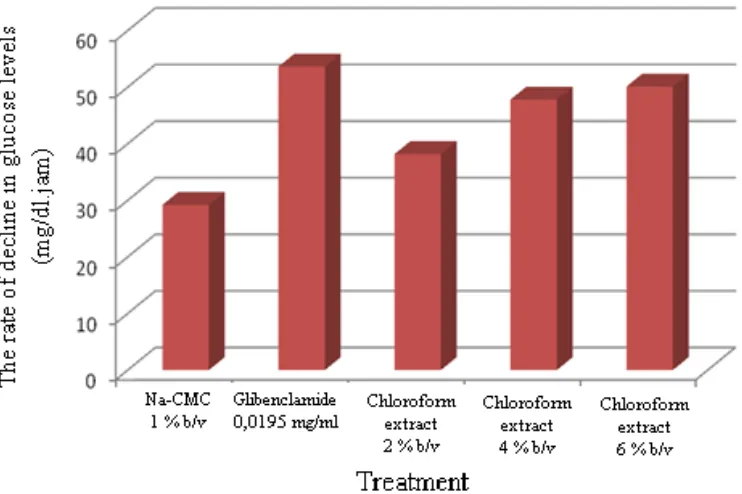
Pengujian toleransi kadar glukosa, konsentrasi 6% memperlihatkan penurunan kadar glukosa yang
hampir setara dengan obat glibenklamid yang dijadikan pembanding.
Kata kunci: β
-sitosterol, ekstrak kloroform, Melochia umbellata, Uji toleransi kadar glukosa.
Abstract
. A research about characterization of the chloroform extract of leaves of
M. umbellata
(Houtt.) stapf var. degrabrata K. and activity test as anti hyperglycemic has been done. This study
aimed to isolate and characterize compounds from chloroform extract and determine the optimum
concentration of chloroform extract in reducing blood glucose levels. Isolation compound from
chloroform extract has been done by maceration, fractionation, and purification. Based on the data
of IR and NMR spectroscopic, compounds isolated from this research were
β
-
sitosterol and fatty
acid compound consisting of 25 carbon atoms. The glucose tolerance test, concentration of 6%
showed a decrease in glucose levels almost equivalent with drug glibenclamide as comparator.
Keywords:
β
-sitosterol, chloroform extract, Glucose tolerance test, M. umbellata
1
INTRODUCTION
Exploration of medicinal plants as a
source of material have been carried out. Many
plants that have efficacy as traditional
medicine, one of which is paliasa. Paliasa is one
of the plants of the family Malvaceae used by
the society, especially in South Sulawesi as a
drug capable of treating liver disease,
hypertension, diabetes, high cholesterol, and
hepatitis by drinking boiled water leaves
(Raflizar et al., 2006).
Paliasa known in two different plant
species that
Kleinhovia hospita
L. and
M.
umbellata
(Houtt.) Stapf.
M. umbellata
(Houtt.)
Stapf consists of two varieties, namely
Stapf var. degrabarata K. showed significant
improvement of liver function. Similarly of the
toxicity against
Artemia salina
larvae, the
toxicity
of
methanol extract
of leaves
M. umbellata
(Houtt.) Stapf var. degrabata K.
showed
highest.
Bioactivity
screening
conducted by Nuvita (2006) from the methanol
extract of free radicals and BHT as controls also
showed that the leaves of
M. umbellata
(Houtt.)
Stapf var. degrabrata K. has a higher
antioxidant effect compared with the other plant
species of paliasa.
Based on the literature, chemical
compounds in the plants of
M. umbellata
(Houtt.) Stapf var. degrabrata K. are essential
oils, triterpenoids, alkaloids, and flavonoids
(Heyne, 1987); and saponin compounds and
antarkuinon. The lattest two compounds can be
prevent liver inflammation in mice (Lalo and
Tayeb, 2003).
Research on paliasa have been done.
There
are
many
secondary
metabolites
compounds that have been isolated from this
plant, either from the extract with a polar
solvent, non-polar or semi-polar solvents such
as
chloroform.
Two
quinolone
alkaloid
compounds have been isolated from the
chloroform extract
M. umbellata
(Houtt.) Stapf
var.
degrabrata
K.
namely
7,8-epoxy
melochinon (3) (Erwin, 2010) and 9,10-epoxy
melochinon (4) (Ridhay, 2012). Melochinon
was active against leukemia cancer cells P-388
with LC
50= 0.83 µg/mL. Secondary metabolites
steroids also isolated from the chloroform
extract
Kleinhovia hospita
Linn. (Soekamto,
2008) whereas for the group of terpenoid
compounds 3-hydroxy-12-oleanan-28-oats (5)
was also isolated from the chloroform extract of
K. hospita Linn. (Purwaningsih, 2010).
Further studies of bioactive compounds
contained in extracts chloroform
M. umbellata
(Houtt.) Stapf var. degrabata K. has done.
that can lower blood glucose levels.
METHOD
Collection of Plant Material
Leaves of plants
M. umbellata
(Houtt.)
Stapf var. degrabata K. collected on April 2012
were
taken
in
Hasanuddin
University,
Tamalanrea Campus, Jl. Perintis Kemerdekaan
Km. 10, Makassar, South Sulawesi. This plant
is identified by Herbarium Bogoriense, Center
of Research and Development Biology, LIPI
Bogor with specimen number BO-1912171.
Materials
To
extraction,
fractionation,
and
recrystallization used solvent with the quality of
pure analys (p.a) and technis such as
chloroform, methanol, n-hexane, ethyl acetate
and acetone. In the process of chromatography
used silica gel Merk. 7730 catalog for vacuum
column chromatography (KKV), silica gel
chromatography (KKT), silica gel Merk. 7733
catalog for gravity column chromatography
(KKG), and for thin-layer chromatography
(TLC) performed
with silica
gel-coated
aluminum plate Brand Keselgel 60 F254
scales
(O'hauss),
scissors,
oral
syringe,
distillation, rotary evaporator, UV lamps, tools
for thin layer chromatography, vacuum column
chromatography,
press
column
chromatography,
gravity
column
chromatography,
and
tools
glasses
are
commonly used in laboratories. For the
measurement of the melting point used a Fisher
John. While IR spectrometer for the analysis of
variants with Shimadzu FTIR 8501, JEOL JMN
A 5000 working on 500.0 MHz for
1H-NMR
Subsequently fractionated by liquid-liquid
extraction with n-hexane and chloroform.
Chloroform extracts were evaporated to dryness
obtained is then weighed and then fractionated
by column chromatography vacuum, press, and
gravity by using the appropriate eluent. Further
isolates obtained purified by recromatography,
crystallization, and recrystallization. Structure
determination is based on the data of IR spectra
and
1H and
13C-NMR.
Glucose Tolerance Test
Chloroform fractions obtained tested
their toxicity to mice adult male (
Mus
musculus
). The mice had been treated
previously and had been given the originator of
diabetes. Concentration varied dosage. The data
obtained and recorded for further analysis.
RESULT AND DISCUSSION
In
isolation
study
of
secondary
metabolites from chloroform extract of the
leaves
M. umbellata
(Houtt.) Stapf var.
degrabata K. obtained two compounds. The
chemical structure of the two compounds
determined by IR and NMR spectroscopic data
of the first compound is suspected
β
-sitosterol
and the second compound suspected as fatty
acid compound consisting of 25 carbon atoms.
Extraction
Dried leaves powder
M. umbellata
(Houtt.) Stapf var. degrabata K. macerated with
methanol 1 x 24 hours 4 times resulted 39.1 g
of methanol extract of dark green. Then, the
methanol extract was partitioned by
liquid-liquid extraction with n-hexane, chloroform,
and ethyl acetate that produce n-hexane
extracts, chloroform extract, and ethyl acetate
extract. Further isolation and purification of the
chloroform extract.
Isolation and Purification
15.99 g of chloroform extract was
fractionated
by
vacuum
column
chromatography
with
eluent
n-hexane,
n-hexane: ethyl acetate, ethyl acetate, acetone,
and methanol with increased the polarity. The
process
begins
with
a
search
eluent
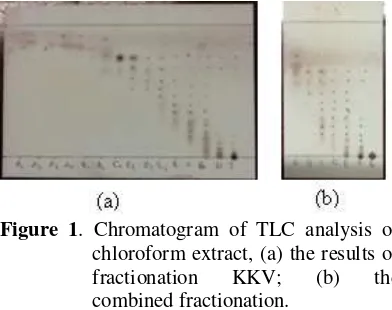
Figure 1
. Chromatogram of TLC analysis of
chloroform extract, (a) the results of
fractionation
KKV;
(b)
the
combined fractionation.
Furthermore, the purity test through
analysis with 2-dimensional TLC with eluent
[n-hexane (7): ethyl acetate (3)] also showed a
stain that appears after heated but not fluoresce
under UV light of short wave and long wave as
shown in Figure 3 which indicates that the
crystal is a pure isolate expressed as compound
1 Test groups to these compounds showed that
steroids purplish blue color after the addition of
sulfuric acid and acetic anhydride.
Figure 2.
Chromatogram of TLC analysis of
compound 1, (a) [n-heksan(9) : etil
asetat(1)];
(b)
[n-heksan(8,5)
:
CHCl
3(1)
:
metanol
(0,5)];
(c) [Aseton(2) : CHCl
3(8)].
596 mg Fraction A further fractionated
by press column chromatography with eluent
n-hexane: ethyl acetate, ethyl acetate, acetone,
and methanol yield 28 major fractions as in
Figure 4.
Figure 3.
Chromatogram of TLC analysis 2
dimention compound 1 after heated
Figure 4.
Chromatogram of TLC analysis
fraction A, [
n-
heksan(9) : etil
asetat(1)].
Fraction
4
was
followed
by
recrystallization with warm acetone. The results
were then analyzed recrystallization fraction A4
TLC with eluent ethyl acetate (2): n-hexane (8)
and showed a single stain was also supported by
the results of measurements of the melting point
of 67-69 °C (Figure 5).
Figure 5.
Chromatogram of TLC analysis
compound 2 under UV long wave
Compound 1
Compound 1 in the form of a white
powder with a weight of 10.9 mg showed a
positive steroid test with Liebermann-Burchard
reagent. This compound does not fluoresce
under UV light which indicates that these
compounds do not have conjugated double
bonds. This is consistent with the IR spectrum
of the data does not show any absorption band
in the region 3100-3000 cm
-1(Lambert et al.,
1998) as the wavelength for the aromatic group.
IR spectral data showed only aliphatic
CH absorption band area at 2956, 2926, and
2852 cm
-1which is supported by the presence
of absorption at 1462 and 1377 cm
-1for CH
2and CH
3. Absorption band at wave number
Table 1.
IR spectrum data compound 1
Groups
Function
Wavelength (cm
-1)
Compound 1
β
-sitosterol
(Sari, 2011)
Wave numbers in the IR spectrum of compound
1 did not show any significant difference with
the IR spectra of compound
β
-sitosterol
standard, so it can be concluded that compound
1 is a
β
-sitosterol.
Figure 6.
Structure compound 1 (
β
-sitosterol)
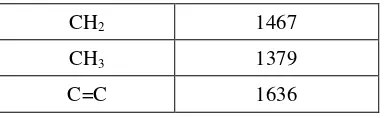
Compound 2
Compound 2 in the form of a white
powder with a weight of 29.2 mg and a melting
point of 67-69
oC. IR spectroscopy showed
absorption band at a wavelength of 3448 cm-1
which indicates the presence of OH groups
which are supported by the bending of CO at a
wavelength of 1172 cm
-1. Area 2918 cm
-1and
2848 cm
-1indicating the presence of aliphatic
CH bending backed by methylene (CH
2) and
methyl (CH
3) at a wavelength of 1467 cm
-1and
1379 cm
-1. Absorption at region 1636 cm
-1indicates the presence of an olefin group (C=C).
IR spectral data of compounds 2 can be seen in
the Table 2.
Table 2.
Data spectrum IR compound 2
Groups function
Wavelength (cm
-1)
O-H
3448
H-NMR spectroscopic data are summarized in
Table 3 shows the 5 peaks. The first peak with a
chemical shift of 0.88 ppm is a triplet form CH
3group that interacts with the binding carbon 2
protons (CH
2). Chemical slider with a
multiplicity of 1.29 ppm multiplet with a very
high intensity, demonstrating some of CH
2groups in the wave number that has the same
environmental conditions that led to the second
peak shows a very high peak. The third peak
with a chemical shift of 1.61 ppm multiplet
shaped and fourth peaks with a chemical shift
of 2.29 ppm triplet shaped carbon interacts with
oxygen binding. Fifth peak is the peak with a
chemical shift of 4.05 ppm which has a triplet
multiplicity is far away from the TMS peak is
caused by a group that binds oxygen.
13