Wind-Electric Power Potential Assessment for
Three Locations in East Java-Indonesia
Ali Musyafa’1
, I Made Yulistya Negara2, and Imam Robandi2
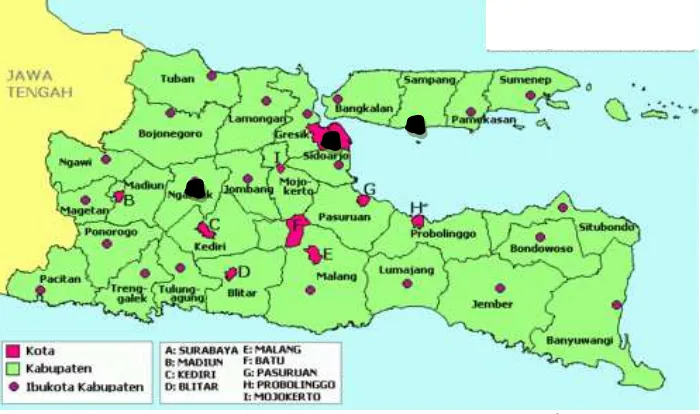
Abstract—This paper reports our effort to asses wind energy potentials for three locations in East Java. We used wind speed data over a period of almost 3 years, i.e. in period of June 2006 – August 2008. Data were taken from direct measurement in locations in East Java Province, i.e. Sampang (Madura), Juanda (Surabaya), and Sawahan (Nganjuk). The short-term of wind speed mean in monthly signifies to wind-speed value ”which parallels to the wind turbine power curve
value” were used to estimate the annual energy output for a 1 MW installed capacity wind farm on the each site 100 of 10kW rated wind turbines were used in the analysis. The short term of wind speed mean at Surabaya and Nganjuk were 2.34, 3.03 and 1.97 m/s at 2 m Above Ground Level (AGL), respectively. In both locations, wind speeds were observed during the day time between 04.00 and 18.00 and relatively smaller ones between 19.00 and 03.00 period. Meanwhile, in Sampang (Madura) the higher wind speeds were observed between 20.00 and 06.00, and relatively smaller between 07.00 and 19.00 period. The 1 MW windfarm at Sampang, Surabaya and Nganjuk can produce 1.284; 1.199 and 1.008 MWh of electricity yearly, taking into consideration of the temperature adjustment coefficien of about 6 %. The plant capacity factor at Sampang, Surabaya and Nganjuk were found to be 30.02 %, 30.00 % and 30.01 % respectively. Additionally, it is noticed that these site can contribute to the avoidance of 0.904; 0.846 and 0.709 tons/year of CO2 equivalent Green House Gases (GHG) from entering into the local atmosphere, thus creating a clean and healthy athmosphere for local inhabitants.
Keywords—electricity power assessement, wind turbine, wind speed, renewable energy, GHG
Abstrak—Makalah ini merupakan upaya untuk memetakan potensi energi angin di tiga lokasi Jawa Timur. Data yang diakses adalah data kecepatan angin dalam kurun waktu hampir 3 tahun, yaitu dalam perioda Juni 2006 – Agustus 2008. Pencuplikan data dilakukan dengan cara pengukuran langsung di tiga lokasi Jawa Timur, yaitu Sampang (Madura), Juanda (Surabaya) dan Sawahan (Nganjuk). Diketahui kecepatan angin rata-rata untuk jangka pendek dalam kurun waktu bulanan adalah memiliki nilai kecepatan angin yang signifikan. Dengan memasang turbin angin secara paralel, cakupan daya turbin angin untuk memperoleh keluaran energi listrik tahunan kapasitas terpasang 1 MW di ladang angin dicapai melalui pemasangan paralel 100 unit turbin angin dengan tiap unitnya 10 kW. Kecepatan angin rata-rata kurun waktu singkat pada permukaan tanah (2m) telah diketahui; untuk Surabaya, Nganjuk dan Sampang, masing-masing; 2,34; 3,03 dan 1,97 m/s. Pada dua lokasi Surabaya dan Nganjuk, kecepatan angin yang observasi selama kurun waktu harian antara jam 04.00 sampai dengan jam 18.00 kecepatannya relatif kecil jika dibanding saat jam 19.00 samapai jam 03.00. Sementara untuk Sampang (Madura) kecepatan angin relatif tinggi antara jam 20.00 sampai dengan jam 06.00, dan relatif kecil untuk jam 07.00 samapai dengan jam 19.00. Instalasi turbin angin 1 MW di ladang angin Sampang, Surabaya dan Nganjuk dapat menghasilkan energi listrik 1,284;1,199 dan 1,008 MW pada setiap tahun, dengan asumsi koeffiseien temperatur terjaga dikisaran 6 %. Faktor kapasitas pembangikit untuk Sampang, Surabaya dan Nganjuk masing-masing adalah : 30,02 %, 30,00 % dan 30,01 %. Dari kegiatan tersebut dapat memberikan kontribusi dapat menghindari efek gas rumah kaca 0,904; 0,846 dan 0,709 ton/tahun gas CO2 ke lingkungan atmosfir setempat. Sehingga dengan cara ini dapat menciptakan atmosfir yang bersih dan sehat untuk
penduduk di sekitarnya.
Kata Kunci—kajian tenaga listrik, turbin angin, kecepatan angin, energi terbarukan, gas rumah kaca
I. INTRODUCTION2
aintaining national energy safety has become an important issue that every contry in a world needs to consider wisely along with the mutual agreement on CO2 emission limitation that has been
determined as national long term energy policy for 2005-2025 [1-2]. Generally speaking, the policy is aimed to govern every activity in relation to energy conservation, intensification, and diversification. However, speaking about energy diserfication, the policy has settled the use of conventional energy replaced gradually by renewable sources by which the substitution will have reached up to 25% by 2025. Meanwhile, the contribution of wind energy by 2025 is expected to achieve installed capacity of 255 MW, i.e. 5 MW stand alone and 250 MW in grids
2
Ali Musyafa’ is ith D partm nt of Physics Engineering, FTI, Institut Teknologi Sepuluh Nopember, Surabaya, 60111, Indonesia. E-mail: musyafa@ep.its.ac.id.
I Made Yulistya Negara and Imam Robandi are with Department of Electrical Engineering, FTI, Institut Teknologi Sepuluh Nopember, Surabaya, 60111, Indonesia.
connected [3]. From today forward, there will be only installed capacity of 300 kW while and the installation of Wind Energy Conversion Systems (WECS) will be spreaded over nationwide [2, 4]. The success of wind turbine installation depends on the type of turbine as well as the design of farms set [5]. The evidence shows that wind energy utilizations in Indonesia are not successful due to unmatched turbine designs, which are mostly imported from abroad and only suitable for working with wind speed of 4–25 m/s (with cut-in 4 m/s). Meanwhile, typical wind turbine working range of 2.5–6 m/s (with cut-in of 2.5 m/s) might yield only 4 % conversion efficiency [6-7]. Geographic characteristics, such as surface elevation, terrain-type of plains, mountains, and beaches, will affect the installed turbine [8]. It is then important to understand the influence of geographic characteristics to the efficiency of installed turbines [9-10].
The design and construction of wind turbine prototype ALFA-IR 01 [7], taking advantage of fuzzy logic control system to control the pitch angle to follow wind speed fluctuations, may increase electrical power conversion
30 up to 40 % compared with fixed blade position of wind turbine. ALFA-IR 01 where the wind turbine is equipped with fuzzy logic control system to control the pitch angle so follow the fluctuations in wind speed, can even increase the local cut-in to play the pitch angle and to increase electrical power production up to 30-40% compared with fixes to the type of wind turbine blade as well. This kind of turbine is specifically designed for behavior of wind speed fluctuations in the order of hour, day, and even year. These measured data can be further derived into related specific energy production per unit area, gross energy production yearly, and even the reduction of Green House Gases (GHG) emissions [2].
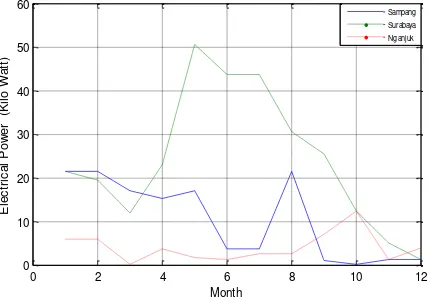
This paper describes the wind data analysis and its potential electrical power harvesting at those three locations. The electrical power potential is assessed using a hypothetical 1 MW installed capacity, which consists of 100 of 10kW rated wind turbines ALFA-IR 01.The energy yielded will be derived along with the estimated plant capacity factor. In this study, the wind energy production is extracted from wind turbines and adjusted with the installed capacity of 1 MW; as a result power curve of wind speed and wind, broad sweep of the rotor, the average temperature, pressure and height of the hub and associated with the calculation of wind power can all be produced. Thus, the wind turbine installation with the parameters associated with the turbine should be considered. In the table of calculation, it is depicted that the wind turbines begin to rotate or to generate the power when wind speeds exceed 3 m/s and increase the average up to speed 6 m/s. Furthermore, the wind speeds will behigher than the value of 10 m/s wind turbine entering the cut-off and the control system secure wind turbines Sawahan), which are completed within three years. Map of measurement sites is shown in Figure 1. Related to geographical data associated with latitude and altitude, as well as acquisition data, they are shown in Table 1. The measurements are made at a hight of 2 m above the ground with measurement intervals of 30 minutes. Each data point is repated 5 times. The average wind velocities in three locations can be depicted in Figure 2. Results show that the high wind velocity in Surabaya and Nganjuk occurres daily from 02:00 to 20:00, meanwhile the low velocity occurres between 21:00 – 01:00. Generally, the maximum peaks occur between 10:00 – 12:00; however, this velocity profile is not in line with electrical power utilization profile, since the peak of demand occurs at 17:00. Seasonal changes of wind speed also provide important information. It is useful for planning and coordinating the operation of the WECS. Measured monthly, variations can be depicted in Figure 3. The importance of local profile of wind speed data should be exploited as a reference or
information to predict the potential of wind energy, which is useful in choosing and designing suitable turbine for specific field conditions [5].
The energy yielded to hypothetical wind farm of 1 MW installed capacity is obtained from manual calculation. The calculation method requires wind turbine, wind power curve, annual average wind speed, the rotor sweep area, air density, hub of height, etc. The wind turbine-related parameters are summarized in Table 2. The wind power curve of the ALFA-IR 01 wind turbine obtained from [7] is depicted in Figure 6. It is shown that wind turbine starts to generate power at a cut-in-speed of 3 m/s, reaches its rated capacity at 7 m/s., and produces rated power up to wind speed of 8 m/s. The higher the wind speeds, the lower power will be yielded, as it can be seen in Figure 5. Transformation of mechanical power into electric power (Figure 4) by wind turbines is a complicated process, but it can be simplified through a modeling approach of its aerodynamics or aerodynamic torque, as described in Equation 1-12. The wind is the force that makes up the aerodynamic lift and give impetus to the blade. These events will produce a pressure. The Cp (Power Coefficient) is a dimensionless quantity and its value (depending on λ, θ pith) which is a representation of the coefficient of the turbine rotor. Mathematical equations in system coefficient of power is derived through relationships amongst aerodynamic torque (Ta), torque 'auxiliary' and comparison of the angular acceleration and torque generator (Tg) as follows [15-16].
Ta = J1 ’t + Bl ωl + Tg (3)
T aux = Ta - Bl ωt (4)
’t = 1/Jt (Taux - Tg ) (5)
Aerodynamic torque on the wind turbine is a nonlinear function of tip speed ratio λ and the pitch angle β. Then, the value pitch angle wind turbines can be fixed but can also be changed/controlled by following the wind speed fluctuation; if the pitch angle is constant, it produces a dynamic torque depend on the tip speed ratio:
Ta = ρ/2 { π R3 vt3 cT(λ) } (6)
With the method of linearization around the operating point by using the first term of Taylor series, then the Equation 6 can be obtained as follows;
∆ Ta= θ ∆ vt + γ ∆ ωt (7)
Closed loop the transfer function is:
The relationships between characteristics of wind power and wind speed are shown in Figure 5. and Table 3 [19-21].
III. RESULTS AND DISCUSSION
By entering the constants and data already obtained, then the mechanical power can be calculated as follows:
P = ½ ρ Cp π r2 v3, ith P = m chanical po r, Cp =
po r co ffici nt, ρ = air d nsity ρ = P / T. For 1
atmosphere pressure P = 1, 01 325 x 10 5 Pascal and R is the constant of air = 287 J / kg K, T is the ambient
t mp ratur (in K lvin), λ = Ωm / Vm and Vw = wind
speed = 5 m/s ; = radius of turbin = 0.5 m, Ω m =
ω /Pn; ω = angulai speed mechanical = 200 rpm/60s =
5, 83 rps. And Pn = number of pairs of pole-pole = 3 pairs, for that value, then λ = 20 and Cp = 0.35. As a whole, these quantities are associated with WECS, ie wind speed, position angle head, turbine shaft angular velocity, Cp the power coefficient, power mechanics, and electrical power production as shown by the Figure 7 and Figure 14.
The performances of wind speed for three locations in Sampang, Surabaya and Nganjuk have different profiles. The maximum wind speed is found to occur at 05.00-15.00 at Surabaya and Nganjuk and 20.00-05.00 at Sampang. Meanwhile, the minimum wind speed at 16.00. is shown in Figure 2. This indicates that higher electricity could be produced during 05.00-15.00. The seasonal variation of long-term wind speed mean during different months of the year has helped in planning the operation of existing power plants in coordination with the wind power plant (Figure 3). Design and prototipe of wind turbine are shown in Figure 5 and Table 2. The Wind Power curve of ALFA-IR 01 is shown in Figure 6. In the case of the wind speed 3-7 m/s, the power production increases, starting from 8 to 75 watt. On the contrary, in the other wind speed, the power production decreses, as seen in Figure 7[8].
The wind turbine control performace is shown in Figure 8, while the wind turbine control takes
steady-state time at 15 seconds and after that, the system has minimum-error 1 pulsa per second or blade pitch angle position (5.6o). The other characteristic of system, rotor speed of wind turbine, coefficient power, mechanical power of wind turbine, and electrical power of wind energy conversion system have the same-profile, as shown in Figure 9 and 12. In the peak value in the time range (200-250), the poin wind speed range can produce the wind power maximum (August to October). Mechanical power which has been transformed by wind turbine mechanical energy produces electricity through generator. Transmission system specification with ± 90% efficiency and energy conservation efficiency of generators ± 80% (from experiment) produce a total
n rgy ffici ncy ηg = 69.68%.
IV. CONCLUSION
The recent study used the energy yielded from a hypothetical wind farm consisting of 100 of 1 MW rated wind turbines from ALFA-IR 01 with the long term annual wind speed mean data at three locations, i.e., Sampang, Surabaya and Nganjuk. This study found that the the most important analysis outcomes are the higher wind speed observed in the day time between 02.00– 20.00 and the relatively lower during rest of period. The wind farms capacities of 1 MW at Sampang, Surabaya and Nganjuk could produce 1057 kWh/m2 ; 916 kWh/m2 and 826 kWh/m2 respectively. Yearly gross energy produced in three locations i.e. Sampang, Surabaya and Nganjuk were 1.835 (MWh/year); 1.718 (MWh/year) and 1.440 (MWh/year) respectively by ignoring the actual renewable energy wind turbine that is transformed at : Sampang, Surabaya and Nganjuk were 1.284 (MWh/year); 1.119 (MWh/year) and 1.008 (MWh/year) respectively. These processes could prevent 0.904; 0.846; and 0.709 ton/years of CO2
equivalent GHG from entering into the local atmosphere, thus creating a clean and healthy atmosphere for the inhabitants.
Figure 1. Map showing the locations of the wind measurement station ( )
Figure 2. Diurnal variation of long-term mean wind speed Figure 3. Seasonal variation of long-term mean wind speed
Figure 4. Transformation wind power to electric power Figure 5. Wind power curve of ALFA-IR 01 [7]
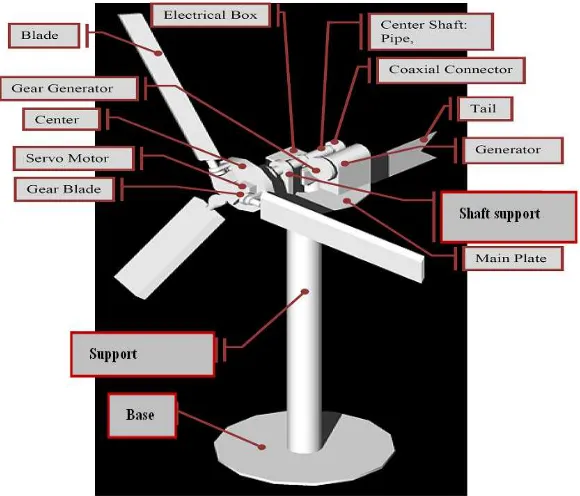
Figure 6. A prototype of wind turbine [ALFA-IR 01]
0 5 10 15 20 25
0 2 4 6 8
Hour of the Day
M
e
a
n
w
in
d
s
p
e
e
d
,
[m
/s
]
Sampang Surabaya Nganjuk
0 2 4 6 8 10 12
1.5 2 2.5 3 3.5 4
Month
M
e
a
n
w
in
d
s
p
e
e
d
,
(m
/s
)
Sampang Surabaya Nganjuk
0 2 4 6 8 10 12 14 16
0 10 20 30 40 50 60 70 80
Mean wind speed (m/s)
W
in
d
P
o
w
e
r
(W
a
tt
)
Pω
Pm P
e
Pt
ωm ωt ωe
Turbine Cp
Transmisio
ηm
Generator
Figure 7. Diurnal variation of long-term mean wind speed Figure 8. Pitch angle wind turbine position
Figure 9. Rotor speed of wind turbine Figure 10. Coefficient power (Cp)
Figure 11. Mechanical power of wind turbine Figure 12. Electrical power of WECS
Figure 13. Electrical power production Figure 14. Wind turbine monitoring
TABLE 1.
GEOGRAPHICAL COORDINATES OF THE DATA COLLECTION STATIONS USED IN THE STUDY
Location Latitute (deg) Longitude (deg) Alttute (m) Duration years Measuremet years Sampang Wind turbine model ALFA-IR 001 Rated power (kW),v=5 m/s 50 W Airfoil soiling losses (%) 2 Downtime losses(%) 2
Item Sampang Surabaya Nganjuk Annual mean wind speed (m/ s) 2,34 3,03 1,97
Trot torsional rotation at th turbin ’s rotor
[N.m] Directorate of General of Electricity and Energy, Available:http://www.esdm.org,2004.
[2] Wikipedia, “Renewable energy from wikipedia,the free encyclopedia,”Avalaibl :http://www.Renewable_energy.htm,2011.
[3] LAPAN, “K bijakan En rgi Nasional,” Available:http://www.ener gi-angin.com, 2010
[4] A. Musyafa and I. Robandi, “Local shot-term wind speed prediction in the Nganjuk city (East Java) using neural network,”
Proceeding of 6 th International conference Numerical Analysis in
[5] F. D. Bianchi, R. J. Mantz, and C. F. Christiansen, “Power regulation in pitch-controlled variable-speed WECS above rated wind speed,” Renewable Energy IEEE, vol.29, pp.1911-1922, 2004.
[6] O. Ozgener, “A small wind turbine system (SWTS) application and its performance analysis analysis,” Energy Conversion &
Management, Elsevier,vol.37, pp. 1326-133,7, 2006.
[7] A. Musyafa, A. Harika, I. M. Y. Negara, and I. Robndi, “Pitch Angle Control of Variable Low Rated Speed Wind Turbine Using Fuzzy Logic Control,” International Journal Of Engineering &
Technology IJET-IJENS, vol.10, no. 05, pp.21-24, 2010.
[8] Y. Himri, “Wind power potential -assesment for three locations in Algeria,” Elsevier-Reneable & Sustainable Enegy Reviews, vol.12 2495-2504, 2008.
[9] M.D. Arifujiyaman, “Modeling and Control of Small Wind Turbine,” CCECE/CCGEL–Saskatoon, IEEE, no.5, May, pp.778-781, 2005.
[10] R. Ata and Y. Kocyigit, “An adaptive neuro-fuzzy inference system approach for prediction on tip speed ratio in wind turbines,”Expert systems with Application, Elsevier, vol. 37, pp. 5454-5460, 2010.
[11] H. Suharta, “Enegy Data-indonesia,” B2TE-BPPT, Puspitek Serpong, Tangerang(15314), Indonesia, presented at Wind Energy Workshop JHCC.18-19 June, Jakarta, 2009.
[12] Y. El-Tous, “Pitch Angle Control of Variable Speed Wind Turbine,” American Journal of Engineering and Applied
Scciences, vol 2, pp.118-120, 2008.
[13] K. R. Ajao, “Comparation of Theoritical and Experimental Power outpus of a Small 3-bladed Horizontal-axiz Wind Turbine,”
Journal of American Science Marsland Press, vol 5, no.4, pp.
79-90, 2009.
[14] V Calderaroa, V Galdia, A. Piccoloa, and P. Sianoa, “A fuzzy controller for maximum energy extraction from variable speed wind power generation system,” DIIIE, University of
Salerno-Italy, 31 October, vol.1, pp. 84-89, 2007.
[15] A. S. Yilmas and Z. Oz r, “Pitch angle control in wind turbine above the rated wind speed by multi-layer perceptron and radial basis function neural network,” Expert System with Application, vol. 36, pp. 9767-9775, 2009.
[16] A. Kusiak, W. Li, and Z. Song, “Dynamic control of energy XXX (wind turbines, Renewable 2009)”, pp. 1-8, Elsevier, 2000. [17] E. Muljadi, “Pitch-Controlled Variable-speed Wind Turbine
Generator,”IEEE Transactions on Industry Applications, vol. 37, no. 1, January-February 2001.
[18] J. Zhang, M. Cheng, Z. Chen, and X. Fu, “Pitch Angle Control for Variable speed Wind Turbine,” pr s nt d inDRPT2008 6-9 April, Nanjing China.
[19] A. Z. Mohamed, M. N. Eskander, and F. A. Ghali, “Fuzzy logic control maximum power tracking of a wind energy system,”
Renewable energy, pp. 23- 235-245, 2001.
[20] H. Suharta, “En gy Data-Indonesia”, presented in, B2TE-BPPT, Puspitek Serpong, Tangerang(15314), Indonesia, Wind Energy Workshop JHCC.18-19 June 2009.
[21] O. Ozgener, “A small wind turbine system (SWTS) application and its performance analysis,”Energy Conversion & Management