Comparison Peer Assessment Rating Index and Index of Treatment Complexity, Outcome, and Need for Orthodontic Treatment Outcome
Arya Brahmanta, Bambang Sucahyo, Noengki Prameswari Orthodoncia Laboratory Dentistry Faculty Hang Tuah University
In order to quantify malocclusion, occlusal traits are often given a numerical weighting system and combined into mathematicalexpressions called occlusal indices. The most important advantage of using occlusal indices is to maximize consistency between and within examiners. The use of the pre- and post-treatment scores to derive an estimate of treatment improvement is familiar. Peer Assessment Rating Index (PAR index) has been developed to provide a single summary score for all the occlusal
anomalies which may be found in amalocclusion. The score provides an estimate of how
far a case deviates from normal alignment and occlusion. The difference in scores between the pre- and post-treatment cases reflects the degree of improvement and, therefore, the success of treatment. The Index of Treatment Complexity, Outcome, and
Need (ICON) has relatively lower predictive accuracy for the treatmentoutcome than for
treatment need judgements.This study showed correlation between PAR index and ICON
with respect to outcome. Twenty patients were identified who had undergone removable appliance treatment within the Orthodontics Laboratory Dentistry Faculty Hang Tuah University. Patients were included in the study if they fulfilled the following criteria: undergone removable appliance 2 years, and pre- and post-treatment study models available.
Keywords : PAR index, ICON
Correspondence : Hang Tuah Dentistry, Arif Rahman Hakim 150 Surabaya 60222. Email : [email protected]
Introduction
Occlusal indices are tools used to ascribe either numericalor categorical values to malocclusions. Various indices have been developed to enable need for treatment, severity of malocclusion,complexity of malocclusion, or added value during treatmentto be defined for an individual or population. Peer Assessment Rating Index (PAR index) has been developed to provide a single summary score for all the occlusal anomalies
which may be found in amalocclusion. The score provides an estimate of how far a case
deviates from normal alignment and occlusion. The differencein scores between the pre-
The Peer Assessment Rating Index (PAR Index)
The Peer Assessment Rating Index, or PAR Index, is a quantitative, objective method for measuring malocclusion and the efficacy of orthodontic treatment. The PAR Index provides a single score, based on a series of measurements, that represents the degree to which a case deviates from normal alignment and occlusion. PAR uses study casts to score maxillary and mandibular anterior alignment, buccal segment occlusion, overjet, overbite, and centreline discrepancies.Some aspects of occlusion are weighted, with overjet havingthe highest weighting. If pre- and post-treatment models arerated, the improvement achieved during treatment can be expressedas a percentage.2,3,4
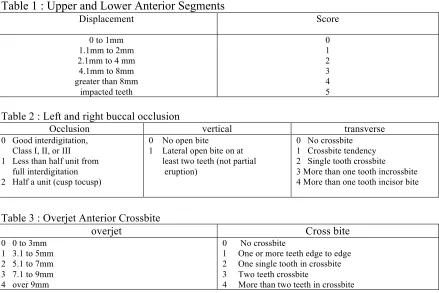
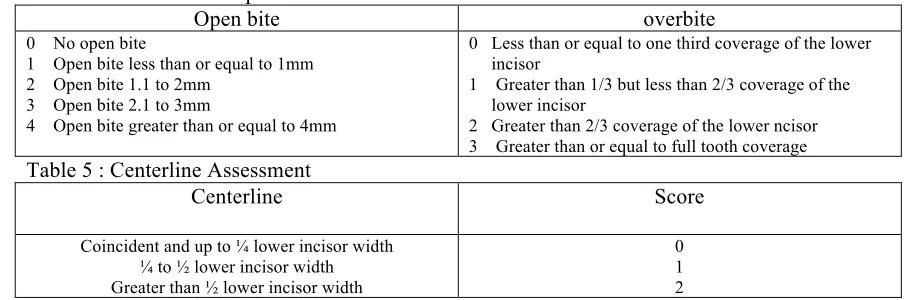
Upper and lower anterior segments is record scores for both upper and lower anterior segments from the mesial contact point of the right cuspid to the mesial contact point of the left cuspid as seen as table 1. Record crowding, spacing, and impacted teeth. Contact point displacement equals the shortest distance between contact points of adjacent teeth. The greater the contact point displacement, the greater the score. A tooth is impacted if the space between adjacent tooth is less than or equal to 4mm. Sum the scores for contact displacements, ectopic teeth, and impacted teeth to give the overall score for each anterior segment3,4,5. Left and right buccal occlusion as seen as below (table 2) concerns the fit of the teeth recorded in three planes of space. With the teeth in occlusion, the recording zone is from the canine to the last molar, either first, second, or third. sum the antero-posterior, vertical, and transverse for each buccal segment. Exclude transitional stages and submerging deciduous teeth. Then, overjet, positive overjet and anterior crossbite for all incisor teeth, the most prominent incisor and the cacine crossbite (table 3,4,5) were recorded.
Table 1 : Upper and Lower Anterior Segments
Displacement Score
Table 2 : Left and right buccal occlusion
Occlusion vertical transverse 2 Single tooth crossbite 3 More than one tooth incrossbite 4 More than one tooth incisor bite
Table 3 : Overjet Anterior Crossbite
Table 4 : Overbite and Open Bite
Coincident and up to ¼ lower incisor width ¼ to ½ lower incisor width
Greater than ½ lower incisor width
0 1 2
Various degrees of importance have been attached to the five major components of the PAR Index. Multiply the individual scores for each PAR-Index component by the weightings in the following chart and then total them to establish the weighted score.
Indexof Complexity, Outcome, and Need (ICON)
This index was designed to combine the benefits of the PAR Indexwith those of
IOTN. The Index of Complexity, Outcome, and Need (ICON) has a very high level of
validity and in comparison with PAR and IOTN it shows good correlationbetween IOTN
and ICON in terms of treatment need. There is alsoa good correlation between PAR and
ICON in respect of treatmentoutcome 5,8,9.
ICON assesses treatment need, treatment outcome acceptability, treatment complexity, and the degree of improvement. To assess treatment need the pre-treatment study models are examined and occlusal traits are scored according to the protocol below. The five occlusal trait scores are then multiplied by their respective weightings and summed. If the summary score is greater than 43, treatment is indicated. Apply the index scoring method to the post-treatment models only. If the summary score is less than 31 the outcome is acceptable. To assess treatment complexity, a five point scale is used via the cut points for the 20 percentile intervals, using the ranges given from the pre-treatment models. The degrees of improvement multiply the post-pre-treatment score by 4, and subtract the result from the pre-treatment score. Use the ranges in to assign a grade as seen as table 6, 7, 8.10
Table 6 : ICON index variables, weightings and cut-off values for treatment need and outcome decisions
Occlusal trait ICON index Weighting
IOTN aesthetic component 7
Left & right buccal 3
Antero-posterior upper arch crowding 5
Overbite 4
Crossbite 5
Treatment need cut-off 43
Table 7 : ICON index score ranges, for rating of treatment improvement
Table 8 :Protocol for occlusal trait scoring
Componenet Score 0 1 2 3 4 5
Cross bite Transverse relationship of cusp to cusp or worse
Lower incisor coverage Up to 1/3 tooth
segment interdigitation is measured (not Angle's classification). Both sides are scored then added together.10,11,12,13,14
Material and Method
Twenty patients were identified who had undergone removable appliance treatment within the Orthodontics Laboratory Dentistry Faculty Hang Tuah University. Patients were included in the study if they fulfilled the following criteria: undergone removable appliance 2 years, and pre- and post-treatment study models available.
The patients is 8-12 years old had been treated by a number of different operators within these laboratory. The pre-treatment models were taken prior to placement of removable appliances and the post-treatmentmodels at completion of active treatment, after two years treatment. The records selected for this study were representative of a range of malocclusions likely to be treated withremovable appliance. The study models were numbered and the patient names obscured to prevent recognition and therefore potential bias.
The study models were scored using the PAR and ICON indices. The
pre-treatment,post-treatment, and treatment improvementscores were recorded.This gave an
objective score for both outcome and improvement. Scoring was carried out by two examiner.
Statistical test
A paired t-test was performed on the PAR scores and ICON scores of the 20 cases for whom post treatment records were available compared with the pre-treatment sample respectively.
Result
The paired t-test on post-treatment PAR scores found that there was statistical difference (P < 0.05) between the 20 patients for whom post-treatment records were available (Table 15). The paired t-test on post-treatment ICON scores found that there was statistical difference (P < 0.05) between the 20 patients for whom post-treatment records were available (Table 16).
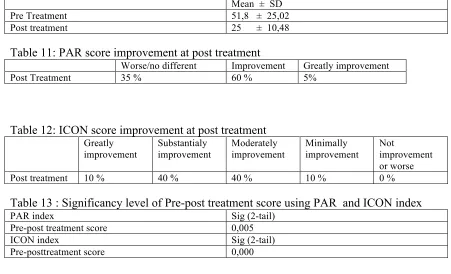
The mean PAR scores at the post treatment are shown in table 11 shows the improvement in cases using the criteria previously defined by Richmond et al12 sixty-five per cent of cases post treatment demonstrated clear benefit from orthodontic treatment. The mean ICON score are shown in table 12. The results of the orthodontic treatment using PAR index was 35% worse/no different, 60 % improved and 5 % greatly improved and the result of the orthodontic treatment. The results of the orthodontic treatment using ICON index was 10 % greatly improved, 40 % substantially improved, 40 % moderately improved, and 10 % minimally improved.
Table 9 : Mean and SD PAR score
Mean ± SD
Pre Treatment 15,30 ± 9,35
Table 10 : Mean ICON score
Mean ± SD
Pre Treatment 51,8 ± 25,02
Post treatment 25 ± 10,48
Table 11: PAR score improvement at post treatment
Worse/no different Improvement Greatly improvement
Post Treatment 35 % 60 % 5%
Table 12: ICON score improvement at post treatment
Greatly improvement
Substantialy improvement
Moderately improvement
Minimally improvement
Not
improvement or worse
Post treatment 10 % 40 % 40 % 10 % 0 %
Table 13 : Significancy level of Pre-post treatment score using PAR and ICON index
PAR index Sig (2-tail)
Pre-post treatment score 0,005
ICON index Sig (2-tail)
Pre-posttreatment score 0,000
Discussion
The general performance of the ICON index seems to be equivalent to the PAR for assessing treatment results. Both indices identified similar proportions of the most improved cases.
The significancy level of scoring shows that pre treatment and post treatment either using PAR index or using ICON index statistically significant. From the result above, we compare the procentage difference of improvement as a outcome of treatment between PAR index and ICON index. We put degree of improvement in the ICON score :substantially improvement, moderately improvement and minimally improvement to the improvement grade of PAR index.
Table 17. comparison improved between PAR and ICON
Index Greatly Improved Worse
PAR 5 % 60% 30%
ICON 10% 90% 0%
It means standard scoring scale of PAR index to reach greatly improvement is more difficult.
In our subjective, PAR does not include measurement of residual spacing in the buccal segment. It is recognized that overjet and reverse overjet are not measured directly in the ICON scoring system. ICON index also does not assess the centerline and lower anterior segment relatively in scoring.
The average time to record the PAR Index score is approximately five minutes. We noticed that when scoring the models, ICON was much quicker to apply than PAR. There is more of difference, the biggest weighting in PAR index is overjet / anterior crossbite (6), centerline (4), and overbite (2), and the biggest weighting in ICON index is aesthetic assessment (7).
Conclusion
1. ICON was much quicker to apply than PAR.
2. Standard scoring scale of PAR index to reach greatly improvement is more difficult.
Reference
1. KM Templeton*, R Powell*, MB Moore*, AC Williams** and JR Sandy*** (2006) Are the Peer Assessment Rating Index and the Index of Treatment Complexity, Outcome, and
Need suitable measures for orthognathic outcomes? The European Journal of
Orthodontics 2006 28(5):462-466; doi:10.1093/ejo/cji120
2. Richmond S, et al. (1992) The development of the PAR index (Peer Assessment Rating): reliability and validity. European Journal of Orthodontics 14:125–139.
3. DeGuzman L, Bahiraei D, Vig KWL, Vig PS, Weyant RJ, O'Brien KD. (1995) The validation of the peer assessment rating for malocclusion severity and treatment difficulty. American Journal of Orthodontics and Dentofacial Orthopedics 107:172–176.
4 Firestone AR, Beck FM, Beglin FM, Vig KWL. (2002a) Evaluation of the Peer Assessment Rating index as an index of orthodontic treatment need. American Journal of Orthodontics and Dentofacial Orthopedics 122:463–469..
5. Daniels C and Richmond S. (2000) The development of the index of complexity,
outcome and need (ICON). Journal of Orthodontics 27:149–62
6. Bergström K and Halling A. (1997) Comparison of three indices in evaluation of
orthodontic treatment outcome. Acta Odontologica Scandinavica 55:36–43
8. Firestone AR, Beck FM, Beglin FM, Vig KWL. (2002b) Validity of the Index of Complexity, Outcome and Need (ICON) in determining orthodontic treatment need.
Angle Orthodontist 72:15–20
9. Fox NA, Daniels C, Gilgrass T. (2002) A comparison of the Index of Complexity, Outcome and Need (ICON) with the Peer Assessment Rating (PAR) and the Index of
Orthodontic Treatment Need (IOTN). British Dental Journal 24:193225–230.
10. Fox NA. Measuring failure of orthodontic treatment: a comparison outcome indicators. J Orthod 2004; 31:319-22.
11. Turbill. Can ICON replace IOTN and PAR. Br Dent J 2002; 193 (4):218.
12. Richmond S, Shaw WC, O’Brien KD, Buchanan IB, Stephen CD, Andrews M. The relationship between the index of orthodontic treatment need and consensus opinion of a panel of 74 dentist. Br Dent J 1995; 178 (10):370-4.
13. McMullan RE, Doubleday B, Muir JD, Harradine NW, Williams JK. (2003) Development of a treatment outcome standard as a result of a clinical audit of the outcome of fixed appliance therapy undertaken by hospital-based consultant orthodontists in the UK. British Dental Journal 194:81–84.