APPLICATION OF TAGUCHI EXPERIMENT FOR THE COMPOSITION
OPTIMIZATION OF RAW MATERIAL IN MAKING OF TERRAZO CHAIR
Oyong Novareza1, Ishardita Pambudi Tama2, Nasir Widha Setyanto3, Lalu Tri Wijaya NataKusuma4, Petty Chynthya Nirmalasari5
1,2,3,4,5Industrial Engineering Department, Universitas Brawijaya
Email: 1[email protected], 2[email protected], 3[email protected], 4[email protected]
ABSTRACT
Sentra Sanitair Karang Besuki is one of the Small Medium Enterprises that develops in Malang city. One of the products that become observations object in this research is the terrazzo materials seat. One of the problems is the absence of raw material composition standard used for producing terrazzo materials seat. To determine the raw material composition standard, experiment is done using taguchi method. Based on the reference, compression strength should be at least comply with the standard rules by the Indonesian reinforced concrete regulation (pbi 1971 n.i.-2) that is 2nd grade of concrete with k175 standard. There are four factors that considered has impact on the compression strength of terazzo material seat, that is cement, crushed rocks, grit, and mill. The orthogonal array design used in this experiment is L9 (34). The optimal setting obtained from this experiments is 3rd level for A factor (cement: 30%), 2nd level for B factor (Crushed rocks: 22.5 %), 1st level for C factor (grit: 37.5%), and 3rd level for D factor (mill: 10%). The confident interval obtained in this taguchi experiment is 177.24+2.61 for the average value and 32.41+3.71 for the variance (SNR). While the confidence interval in the confirmatory experiments is 165.9+15.65 for the average value and 34.48+4.03 for the variance (SNR). So it is concluded that the optimal setting level of the terrazzo materials seats is acceptable because the confident interval of the confirmatory experiment is still in the optimal interval results.
Keywords: compression strength, concrete, sanitair, taguchi experiment, terrazo material seat
1. INTRODUCTION
Quality is one of the most important things that must be given and filled by the company to meet customer satisfaction, whether it is from the input / raw material, the process of production or the product output until the product it self delivered in to the customer. It is due to the facts that the quality of a product is one of the costumers considerations in choosing and consuming products for a long period of time. One of the strategy that can be done by a company is to maintain quality by doing quality control over and over again based on the standard that have been set by the company and also based on the customers need. The balance between this two, will improve the quality of products that hopefully will increase company profit as well. Sentra sanitair is one of the Small Medium Enterprises that developed in Malang city. Karang Besuki sentra sanitair is an industry that manufactures terrazzo materials like kitchen sink, bathtub, headstone, and bench. Due to the market demands that progressively increase, sentra sanitair not only make household appliances, but also make flowerpot, fountain, garden lighting, and dome for the mosque, pillars, and others. Based on the data provided by industry and trading department in Malang city in 2013, there are 14 similar potential businesses.
lacking in quality, one of these products is the terrazzo materials seat. In addition, the observation is carried out in the Universitas Brawijaya area that using terrazzo materials seat as their supporting facilities. Figure 1 is the illustration of terrazo materials seat that have been damaged.
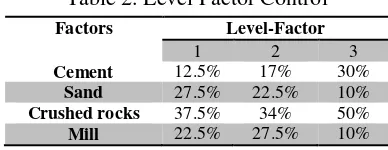
Based on the results from interview with five sentra sanitair business units, terrazzo materials seat made of several materials that are cement, grit, crushed rocks, mill, terrazzo materials, wire, and dyes. But the main raw material is cement, grit, crushed rockss, and mill. Table 2 is the composition ratio of main raw material in the five business units that produces terrazzo materials seat.
Figure 1. Terrazo seat damaged
Compression Strength that can be accepted by 3 terrazzo materials seat were different. The suspect of the problems is that the craftsmen does not aware of the quality standard. So far the quality of products only based on the estimates or based on the craftsmen. This is due to the absence of standards for quality product including the manufacturing standard and the standard of raw material composition. So far, the quality that being emphasized in the sanitair products is the attributes quality such as visual display such as no scratch, no uneven surface, no cavity due to the air bubbles; but they forget how important the variable quality, such the minimum compression strength.
Based on the reference, compression strength should be at least comply with the standard rules by the Indonesian reinforced concrete regulation (pbi 1971 n.i.-2) (Departemen Pekerjaan Umum Dan Tenaga Listrik, Direktorat Jenderal Cipta Karya, Direktorat Penyelidikan Masalah Bangunan, 1995) that is 2nd grade of concrete with k175
standard or 175 kg per cm2. 2nd class concrete is destined for structured construction that does not require high quality concrete. K175 Standard chosen because the quality of concrete is used for general structured construction that does not need high pressing strength and commonly used. With an estimated one seat can be used upto 3-4 persons, the maximum heavy that can be carried out by the chair is approximately 400 Kgs.
Therefore, we need to analyze the right combination of the level of factors that is the composition of the main raw material substances to further standardize the quality of terrazzo materials seats not only in attribute but also in a variable manner or minimum compression strength that should be carried out by terrazzo materials seats. Taguchi method is used to produce the level (composition) of each factor (raw materials).
2. RESEARCH METHODOLOGY
This research is an experimental research, by having direct experiment towards a research object. The research object is seat made from terrazzo material. The research was done in sentra sanitair, in Karangbesuki, Kecamatan Sukun, Kota Malang, on September 2015 until January 2016.
2.1. Research Procedure
3. RESULTS AND DISCUSSION
3.1. Determining Quality Characteristics
The characteristic quality used in this research is the Nominal is the best. The terrazo seats characteristic that observed in this research is the minimum compression strength using class standard and the 2nd grade of concrete quality or known as k175 (Indonesian reinforced concrete regulation PBI 1971 N.I.-2). Terrazo seats could be categorized as a structural object that does not require high compression strength. In other words, the minimum compression strength that should be carried out should be near 175 kg/cm2. Therefore, this study will produce optimal setting level.
3.2. Determining the of factors and the level of factors
The determination of influential factors and level of factors obtained from the literature study, survey and as the results from discussions with the business owner. In Figure 3 below are some of the most influential raw materials that could influence the quality of compression strength of a terrazzo materials seat.
Tabel 1. Control Factor
No Raw Materials
1 Cement
2 Sand
3 Crushed rocks
4 Mill
From the several factors control shown in figure 1, the level of factors chosen is L9 (34). The determination of the level is based on the consideration that every level consists of four factors, as shown in Table 2 below.
Table 2. Level Factor Control Factors Level-Factor
3.3. Determining Orthogonal Array
An orthogonal matrix is a matrix in which the elements are arranged based on the row (combination of the level factors in the
experiments) and columns (factors that can be changed in experiments) (Soejanto, 2008 and
Panagiotopolou et al, 2015). Table 3 is the orthogonal array table that will be used in this research.
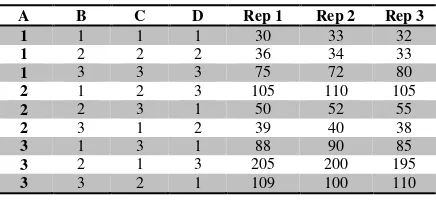
There are 4 uncontrolled factors in which each factors has three levels of factors and no interactions between factors. The number of experiment must be made is 9 experiments in accordance to the orthogonal array L9 (34) .To increase the precision of the results, each experiments will be conducted in a few replication experiment. The number of replication / trial that will be used is between 3 -5 (Ariani, 2004). In this research, the number of replication that will be used is 3 replications on each experiment so that the total observation data that will be collected is 27.
3.4. Collecting Taguchi Experiment Data
The Taguchi Experiments started by making a sample of specimens in the size of
Tabel 4. Raw Material Conversion in Kgs
Experiment Conversion to kgs Weight
The specimens were settled for 28 days to find out the quality of compression strength of each specimen. The next stage is testing compression strength in the laboratory. Table 5 shows the compression strength data of the specimen.
Table 5. Results from the measurement of Compression strength
3.5 Data Processing of Taguchi Experiments 3.5.1. Calculation of ANOVA
Firstly, conduct the data processing of the average compression strength as shown in Table 6.
Table 6. Calculation of The Average Com-pression Strength step and should be carried out by calculating to get a response table as shown in Table 7.
Table 7. Response Table
There were five steps as follow to process the ANOVA data. It began with calculating the
value of the total sum of square and followed by counting sum of square due to the mean or because the number of squared. Calculate an average sum of square due to Mean, counting sum of square due to Error were the third and fourth and finally making anova table.
Actually, during making anova table, six with calculating Percent Contribution. The Table 10 shows the anova table.
Based on the hypothesis shown in Table 10, it is known that all the factors have f-ratio > f-table (f0.05 (2;18) = 3.55). So that we could conclude that all factors have influence on the compression strength of terrazo seat. Meanwhile, based on the percent contribution (rho%) we know thatmost influential factors that has the highest percentage is A factor (cement) by 51.27%, followed by D factor (mill) by 42.24%, b factor (crushed rocks) by 3.87% and the smallest percentage is C factor (grit) with percent 2.21% contribution factor. In figure 11, known that rho % error is 0.42 i factors (crushed rocks) have less influence and C factors (grit) have the least influence against the compression strength.
Pooling is needed to make a firm design against whatever insignificant noise. By pooling insignificants factors, we assume that those factors were excluded from the experiments and the sum of square is part of the sum of the squares error.
most influential effect are cement and mill with percent contribution 51.27% and 42.24%. While grit and crushed rocks have percent contribution as many as 2.21% and 3.87%. So that two factors have to be pooled up.
Table 8. ANOVA
Table 9. ANOVA of Pooling pooled up.
Based on the hypothesis shown in Table 9, it is known that factors A and D have ratio > f-tabel (f0.05 (2;18) = 3.55). So we can conclude factors A and D have influence on the compression strength.
In table 11 it is known that factors that have significant influence is a factor A (cement) and factor D (mill). This could be seen from the percent contributions (rho%) of these two factors that are 50.71% and 41.69%. If error percent contribution is low (less than 50 percent) we could assume that there is no missing important factor from this experiment (Belavendram, 1995, Fei et al 2016). So we can conclude that there is no significant factors lost of this experiments because error percent contribution in the pooling of ANOVA is less than 50%, that is 7.6% of the sum of total squares and the percentage of the sum squares / percent contributed (rho %) from significant factors is 92.40 %.
3.5.2. Calculation analysis of variance (ANOVA) signal to the noise ratio (SNR)
Calculation of the signal to noise to ratio (ANR) aims to understand which factors affecting variance in this experiment. The concept of signal to noise ratio (SNR) is that whatsoever quality characteristic selected in an experiment; the larger SNR value is always
better (Soejanto, 2008 and Panagiotopolou et al, 2015).
The followings are steps in testing ANOVA signal to noise ratio (SNR)
1. Calculate signal to noise ratio (SNR) for each experiment (see in Table 12).
2. Make signal noise ratio (SNR) table. This table use to find the level of factors that affect variance (see in Table 10).
Table 10. Response Table Signal to Noise Ratio
Factors
A B C D
Level
1 27.87 31.06 31.62 27.69 2 31.61 30.28 29.84 31.71 3 31.29 29.42 29.31 31.37 Diff 3.73 1.64 2.31 4.01
rank 2 4 3 1
3. Processing data of ANOVA signal to the noise ratio (SNR) pooled value n (see Table 11).
Table 11. Analysis of Variance (ANOVA) Nilai SNR - Pooling
3.6. Determining Optimal Setting Level
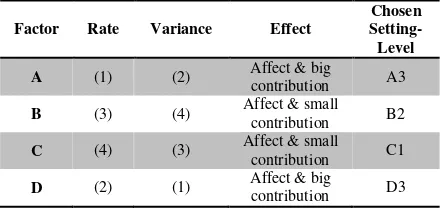
To improve quality characteristic, there are two stages that need to be done, that is reducing variance and adjust the target according to the specifications expected (Belavendram, 1995). Table 12 shows the comparison of the influence factors in taguchi experiment against characteristic quality being observed in this research.
Table 12.Setting Level-Optimal
Factor Rate Variance Effect
Chosen
Setting-Level
A (1) (2) Affect & big
contribution A3
B (3) (4) Affect & small contribution B2
C (4) (3) Affect & small contribution C1
D (2) (1) Affect & big
Table 13. Signal to Noise Ratio
A B C D Rep 1 Rep 2 Rep 3 1/n Γ μ2 (γi-μ)2 σ2 SN (NTB) 1 1 1 1 30 33 32 0,33 95,50 1013,26 5,44 1,81 27,48 1 2 2 2 36 34 33 0,33 102,91 1176,71 4,51 1,50 28,93 1 3 3 3 75 72 80 0,33 227,00 5725,44 32,67 10,89 27,21 2 1 2 3 105 110 105 0,33 320,00 11377,78 16,67 5,56 33,11 2 2 3 1 50 52 55 0,33 157,00 2738,78 12,67 4,22 28,12 2 3 1 2 39 40 38 0,33 117,00 1521,00 2,00 0,67 33,58 3 1 3 2 88 90 85 0,33 263,00 7685,44 12,67 4,22 32,60 3 2 1 3 205 200 195 0,33 600,00 40000,00 50,00 16,67 33,80 3 3 2 1 109 100 110 0,33 319,00 11306,78 60,67 20,22 27,48
Factor A and D both gave the significant influence and contribution and affect the average value and the variance. In average response table, factor A in the 1st rank and factor D on the 2nd rank which means A factors has more influence on the average compression strength than D factor. So we chose factor A 3rd level. While based on the SNR response table, factors D in the 1st rank and A factors in the 2nd rank which means that D factor have more influence on the compression strength variance than A factor. But, the difference between D factor 2nd and 3rd level in SNR response table is not too far in which the value is 31.71 and 31.37. While the D factor 2nd and 3rd levels in the average response table have a significant difference in which the value is 53.657 and 127.444. Therefore, D factor 3rd level is choosen.
While the Factor B and C both gave minor influence and contribution. The level selection for factor B and C does not give significant impact towards compression strength. Based on the average ANOVA calculation and SNR, factor B and C considered to give minor influence therefore we do pooling for this 2 factors. But the selection of level for factor B and B is conducted by referring to the rank in the response table and SNR. Therefore factor B 2nd level and factor c 1st level is selected. Table 14 is the optimal setting level.
Table 14. Setting Level-Optimal
Factor Level Interpretation A 3 Cement (30%)
B 2 Crushed rocks (22.5%)
C 1 Sand (37.5%)
D 3 Mill (10%)
3.7. Estimates The Optimal And Trust The Interval Rata-Rata And Signal To Noise Ratio (SNR)
The estimates for the optimum condition is done by comparing the predicted average means and expected signal to noise ratio (SNR) at the optimum level with the results from confirmatory experiment. While the confidence interval is aimed to know the estimation of the optimal level factor.
Based on the calculation on analysis of variance (ANOVA), the most influential factors towards the compression strength of terrazzo material seats are A3 (cement: 30%) and D3 (mill: 10%). The following are the calculation of estimated optimal condition and the confident interval :
1. Estimates the optimal condition and confident interval for the average value of all data.
2. Estimates the optimal condition and confident interval for signal to noise ratio (SNR) of all taguchi experiment data.
3.8. Confirmatory Experiment
experiment data for 10 samples with the selected optimal setting level.
Table 15. Results of Confirmatory Experiment
Experiment Result (kg/cm2)
1 167
2 166
3 170
4 169
5 170
6 171
7 178
8 165
9 167
10 169
Next step isto make average calculation that transformed into the SNR, the confident interval and comparing optimal condition of confident interval with confirmatory experiment.
1. Calculating the average value and transformed into SNR.
2. Calculating the confirmatory experiment confident interval
3. Comparing the optimal confident intervaland the confirmatory experiment
a. Comparing the optimal confident interval and the average value of confirmatory experiment (see Figure 2).
Figure 2. The comparison of confident interval from the compression strength of
terrazzo chair
b. Comparing the optimal confident interval and the confirmatory experiment for signal to the noise ratio (SNR) (see Figure 3).
Figure 3. The comparison of confident interval from SNR value of the compression strength of
terrazzo chair
Figure 2 and Figure 3 shows the result of confirmatory experiment for the average value and SNR could be accepted by the confident interval. It shows that the results from confirmatory experiment remain in the optimum interval results and decisions are accepted. It means that the result from taguchi experiments could be use and the optimal setting level of the raw materials could be use as a reference for producing terrazo material seat. Table 18 is a prediction and recapitulation of optimal condition from taguchi and confirming experiment.
Table 16. Prediction and Optimum Condition of Taguchi Experiment and Confirmation
Response Estimation Optimation
Taguchi Exp.
Rate
(mean) 177.24 177.24±12.61 Variance
(SNR) 32.41 32.41±3.71
Confirmation Exp.
Rate
(mean) 169.5 165.9±15.65 Variance
(SNR) 34.48 34.48±4.03
smaller with a smaller mixture (+6kg for specimens cube of 15 cm), so that mill and cement becomes the most influential factors towards the compression strength.
4. CONCLUSIONS
Based on the calculation using taguchi experiments, the result from ANOVA shows that the biggest percent contributions (rho %) is factor A (cement) 51.27 %, followed by factor D (mill) 42.24%. While the largest percent contributions from SNR is factor A (cement) 28.27% and factor D (mill) 34.21%. To be concluded, the factors that significant is A (cement) and D (mill).
Besides, based on data processing on taguchi experiment, the most influential factors towards the compression strength of terrazzo material seats is factor A 3rd level (cement: 30%), factor b 2nd level (crushed rocks: 22.5 %), factor c 1st level (grit: 37.5%) and factor D 3rd level (mill: 10 %). While Factor B 2nd level (koral 22.5%) and Factor C 3rd level (grit 37.5%) have less influent. Based on the confirmatory experiment, it is concluded that the optimal setting level of the terrazzo materials seats is acceptable because the confident interval of the confirmatory experiment is still in the optimal interval results.
5. REFERENCES
ARIANI, DOROTHEA WAHYU. 2004. Pengendalian Kualitas Statistik Pendekatan Kuantitatif dalam Manajemen Kualitas. Yogyakarta : Penerbit Andi Yogyakarta.
BELAVENDRAM, NICOLO. 1995. Quality
by Design Taguchi Techniques for Industrial Experimentation. London: Prentice Hall International (UK) Limited.
DEPARTEMEN PEKERJAAN UMUM DAN TENAGA LISTRIK, DIREKTORAT
JENDERAL CIPTA KARYA,
DIREKTORAT PENYELIDIKAN
MASALAH BANGUNAN. 1995.
Peraturan Beton Bertulang Indonesia 1971 N.I. -2. Bandung: Yayasan Lembaga Penyelidikan Masalah Bangunan
FEI, NG CHIN, MEHAT, NIK MIZAMUL, KAMARUDDIN, SHAHRUL, 2013. Practical Applications of Taguchi Method for Optimization of Processing Parameters for Plastic Injection Moulding: A Retrospective Review. ISRN Industrial Engineering Volume
2013 (2013),
http://dx.doi.org/10.1155/2013/462174
LUHURNEWS. 2013. Sampel Uji Kubus vs
Sampel Uji Silinder.
https://luhurnews.wordpress.com/2013/0
6/19/sampel-uji-kubus-vs-sampel-uji-silinder/ (Accesed November 14th, 2015)
SOEJANTO, IRWAN. 2008. Rekayasa Kualitas: Eksperimen dengan Teknik Taguchi. Surabaya: Yayasan Humaniora.