David Publishing Company www.davidpublishing.com P u b l i s h i n g Dav i d
Journal of Life Sciences
Publication Information
Journal of Life Sciences is published monthly in hard copy (ISSN1934-7391) and online (ISSN 1934-7405) by David Publishing Company located at 1840 Industrial Drive, Suite 160, Libertyville, Illinois 60048, USA.
Aims and Scope
Journal of Life Sciences, a monthly professional academic journal, covers all sorts of researches on molecular biology, microbiology, botany, zoology, genetics, bioengineering, ecology, cytobiology, biochemistry, and biophysics, as well as other issues related to life sciences.
Editorial Board Members
Dr. Stefan Hershberger (USA), Dr. Suiyun Chen (China), Dr. Farzana Perveen (Pakistan), Dr. Francisco Torrens (Spain), Dr. Filipa João (Portugal), Dr. Masahiro Yoshida (Japan), Dr. Reyhan Erdogan (Turkey), Dr. Grzegorz Żurek (Poland), Dr. Ali Izadpanah (Canada), Dr. Barbara Wiewióra (Poland), Dr. Valery Lyubimov (Russia), Dr. Amanda de Moraes Narcizo (Brasil), Dr. Marinus Frederik Willem te Pas (The Netherlands), Dr. Anthony Luke Byrne (Australia), Dr. Xingjun Li (China), Dr. Stefania Staibano (Italy), Dr. Wenle Xia (USA), Hamed Khalilvandi-Behroozyar (Iran).
Manuscripts and correspondence are invited for publication. You can submit your papers via Web Submission, or E-mail to [email protected] or [email protected]. Submission guidelines and Web Submission system are available at http://www.davidpublishing.com.
Editorial Office
1840 Industrial Drive, Suite 160, Libertyville, Illinois 60048 Tel: 1-847-281-9826, Fax: 1-847-281-9855
E-mail:[email protected], [email protected]
Copyright©2011 by David Publishing Company and individual contributors. All rights reserved. David Publishing Company holds the exclusive copyright of all the contents of this journal. In accordance with the international convention, no part of this journal may be reproduced or transmitted by any media or publishing organs (including various websites) without the written permission of the copyright holder. Otherwise, any conduct would be considered as the violation of the copyright. The contents of this journal are available for any citation. However, all the citations should be clearly indicated with the title of this journal, serial number and the name of the author.
Abstracted / Indexed in
Database of EBSCO, Massachusetts, USA Cambridge Scientific Abstracts (CSA), USA
Chinese Database of CEPS, American Federal Computer Library Center (OCLC), USA Ulrich’s Periodicals Directory, USA
Chinese Scientific Journals Database, VIP Corporation, Chongqing, China Summon Serials Solutions
Subscription Information
Price (per year): Print $420, Online $300, Print and Online $560
David Publishing Company
1840 Industrial Drive, Suite 160, Libertyville, Illinois 60048 Tel: 1-847-281-9826, Fax: 1-847-281-9855
E-mail: [email protected]
Dav id Publishing Company
w ww.davidpublis hing.com
Pu b li sh i ng
Dav i d
J LS
Journal of Life Sciences
Volume 5, Number 2, February 2011 (Serial Number 34)
Contents
Research Papers
81 Evaluation of Fusarium Graminearum Growth and Deoxynivalenol Content in Susceptible and
Tolerant Varieties of Triticum Aestivum
Chiara Nobili, Massimo Reverberi, Alessandra Ricelli, Valeria Scala, Gabriella Aureli, Flavia Pinzari, Anna Adele Fabbri and Corrado Fanelli
91 Genetic Diversity of the Medicinal Plant Ocimum Gratissimum L. (mint) from Kenya Based on AFLP Markers
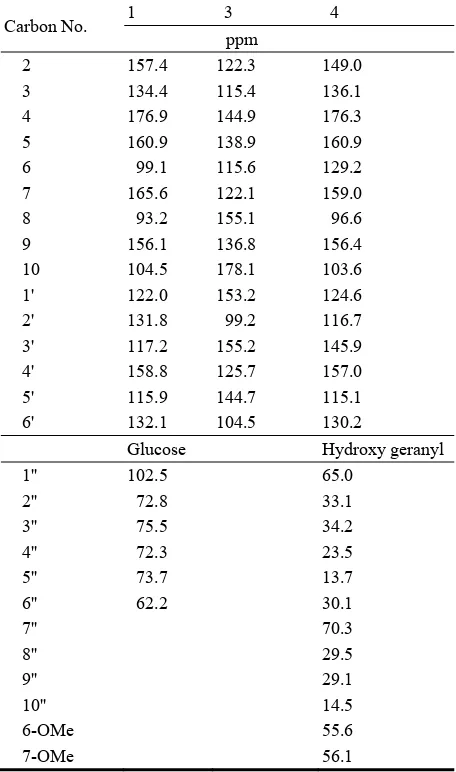
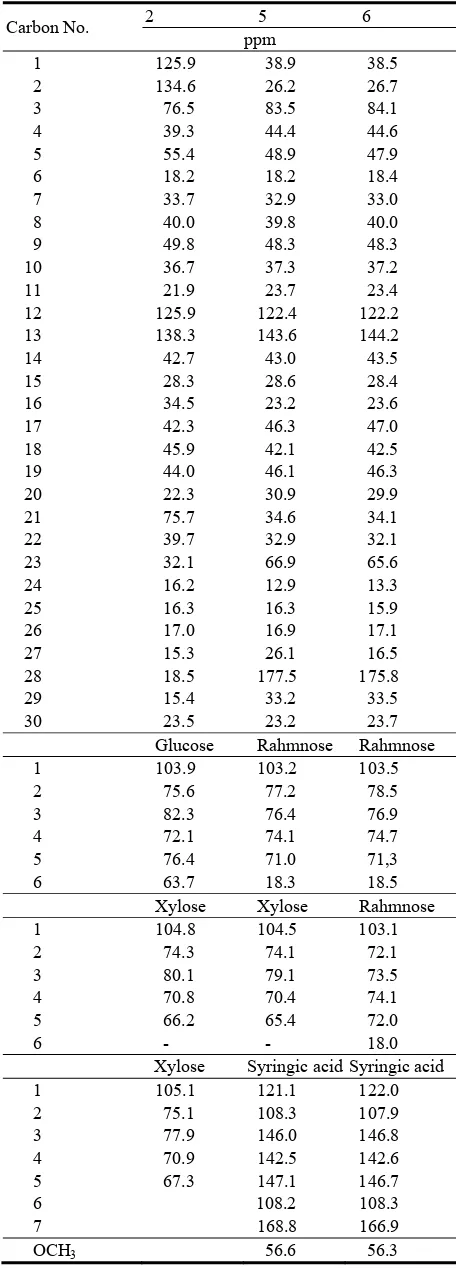
Lexa G. Matasyoh, Francis N. Wachira, Miriam G. Kinyua and Anne W. Thairu Muigai 100 Study on Flavonoids and Triterpenoids Content of some Euphorbiaceae Plants
Laila Abdel-Ghany Refahy
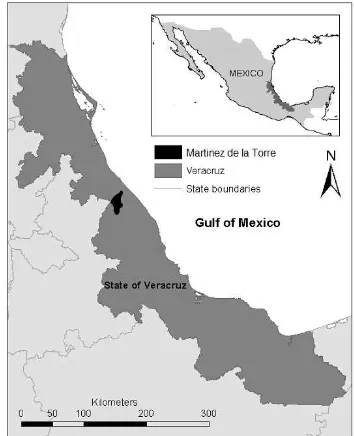
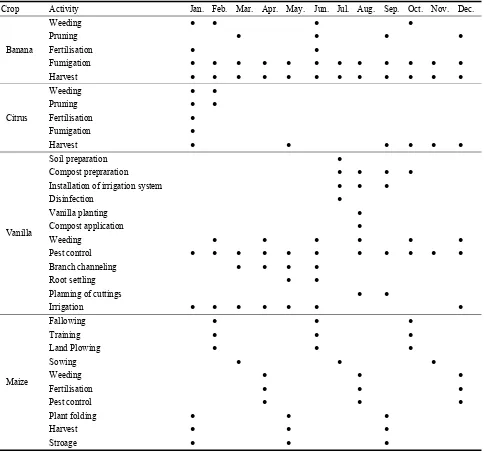
108 Agrobiodiversity for Livelihood Security: A Case Study of Agroforestry Technologies in Mexico P. Krishna Krishnamurthy and Krishnamurthy Laksmi Reddiar
120 Production of High Quality Functional Labneh Cheese Using Exopolysaccharides Producing Encapsulated Lactobacillus Bulgaricus
Kawther El-Shafei, Fayza M. Assem, Azzat B. Abd-El-Khalek and Osama M. Sharaf
129 Identification of Pathogenic Germs and Antibiotics Residues in the Raw Milk and Their Effects on Human Health
Tadjine Nacera, Tassist Amina, Bradea Maria-Stela, Tarzali Dalila and Guetarni Djamel
132 Impact of Selenium on Microtubules Polymarisation of Spermatozoa of Endosulfan Exposed Swiss Albino Mice
Ranjit Kumar, Jitendra Kumar Singh, Mohammad Ali and Arun Kumar
136 Prevalence of Muscardine Disease in Different Silkworm Hybrid, Bombyx Mori L. under
Agro-climatic Conditions in Aurangabad (M.S.), India
Bhalerao Rajendra S., Hiware Chandrashekhar J. and Avhad Sunil B.
Methods and Techniques
139 The Use of HPLC in Determination of Endogenous Hormones in Anthers of Bitter Melon Yi Tang, Li Wang, Chao Ma, Ji Liu, Bin Liu and Huanxiu Li
143 Potential of the Integrated Control of Cucumber Root Rot Using Natural, Biological and Chemical Methods
Mohamed El Khaleely Barakat, Abdel Radi Taher Bakeer and Wallaa Fathy Mostafa 157 Ethanol Production by Enzymatic Hydrolysis of Elephant Grass
Isaías Barbosa Soares, Olga Martins Marques, Mohand Benachour and César Augusto Moraes de Abreu
Reviews
Journal of Life Sciences 5 (2011) 81-90
Evaluation of
Fusarium Graminearum
Growth and
Deoxynivalenol Content in Susceptible and Tolerant
Varieties of
Triticum Aestivum
Chiara Nobili1, Massimo Reverberi2, Alessandra Ricelli3, Valeria Scala4, Gabriella Aureli4, Flavia Pinzari5, Anna
Adele Fabbri2 and Corrado Fanelli2
1. ENEA, Via Anguillarese 301, Roma 00123, Italy
2. Università degli Studi “Sapienza”, Largo Cristina di Svezia 24, Roma 00165, Italy
3. ICB-CNR, P.le Aldo Moro 5, Roma 00185, Italy
4. QCE-CRA, Via Cassia 176, Roma 00100, Italy
5. Istituto Centrale per il Restauro e la Conservazione del Patrimonio Librario, Via Milano 76, Roma 00184, Italy
Received: July 09, 2010 / Accepted: September 25, 2010 / Published: February 28, 2011.
Abstract: The aim of this work was to verify if the wheat susceptibility/tolerance phenotype to Fusarium head blight (FHB) into the field could be related to the ability of the re-activated seeds to hamper deoxynivalenol (DON) synthesis by Fusarium graminearum into non optimal (i.e. high humidity) storage conditions. On this purpose, two Fusarium graminearum strains, Fg126 and Fg8308, were separately inoculated on active but not germinating kernels of Triticum aestivum L. cv “Sagittario” (FHB-susceptible) and cv “Blasco” (FHB-tolerant). The growth of the fungal strains on wheat kernels was monitored from 0 to 15 days post inoculation through a quantitative SYBR green real-time PCR, as well as ergosterol content through HPLC for comparison. DON biosynthesis into the contaminated wheat seeds was quantified by HPLC method in the same time intervals as above. Significant differences in the ability to grow and synthesize DON, acetylated and glucosylated forms, emerged between the strains also in relation to the wheat variety on which the pathogen developed. The results obtained indicated that the wheat variety which from the epidemiological studies carried out into the field is FHB-tolerant, i.e. Blasco, resulted as the more efficient in hampering DON synthesis in both F. graminearum strains. Thus, this preliminary study could represent a contribution to find out less time consuming methods for screening the wheat varieties tolerant to DON accumulation in non optimal storage conditions.
Key words: Triticum aestivum, Fusarium graminearum, FHB-susceptible, FHB-tolerant, deoxynivalenol (DON), 15-acetyldeoxynivalenol (15-ADON), 3-acetyldeoxynivalenol (3-ADON), 3-glucosyldeoxynivalenol (3-GDON).
1. Introduction
Fungi can grow on many food commodities. Some
fungal genera, such as Fusarium include several
species which can produce, under suitable conditions, secondary metabolites, i.e. mycotoxins, which are dangerous for the health of humans and animals. As matter of fact, mycotoxigenic fungi are a real issue, especially for cereal industry.
Corresponding author: Chiara Nobili, Ph.D., research field: food diagnostic. E-mail: [email protected].
In particular, Fusarium graminearum can cause the
Fusarium head blight (FHB) of wheat [1]. This disease leads to a severe reduction of grain yield and quality. The FHB-affected wheat grains are small, light, shrivelled and sometimes covered with a blank or pink down. It has been assessed that one of the main
aggressiveness factor involved in FHB disease is F.
Evaluation of Fusarium Graminearum Growth and Deoxynivalenol Content in Susceptible and Tolerant Varieties of Triticum Aestivum
82
particular it is known that DON intoxication can affect growth (anorexia and decreased nutritional efficiency), can cause emetic effects and haemorrhagic diathesis, bone narrow aplasia and a general affection of the immune function (enhancement or suppression), and of reproduction (reduced litter size) [4, 5]. The toxicity and the high diffusion of this contaminant has induced the European Union to establish a maximum tolerable level for its presence in different food commodities (Commission Regulation No. 1881/2006).
In wheat plants, DON delays the germination and growth of wheat plants and inhibits the growth of the grain and the coleoptiles tissues. DON is probably able to circulate in the phloem, with a concentration following a descending gradient from the rachis, through lemmas and grains to the peduncle [6]. Briefly, DON presence can inhibit the expression of some proteins involved in plant defence mechanisms and it is also phytotoxic, causing chlorosis, necrosis and
apoptosis in planta [7]. FHB is influenced by different
aspects, some are related to the environmental conditions like temperature and humidity, to the attack by pests and microorganisms and to the competition dynamics between Fusaria and the other colonizers fungi [8].
However intrinsic factors like plant variety and
isolate characteristics are very important to predict the probability of the onset of disease at its extent. For instance it is already known that some wheat varieties
are more susceptible to FHB and that some F.
graminearum isolates are particularly able to cause this
disease. Moreover, the conidia of Fusarium can be
present also onto the kernels and transported into seeds storage. In non optimal storage conditions, i.e. a water activity of the seeds higher than 0.9, the conidia can germinate and secondary infections cycles occur. In these new infection cycles, the pathogen is able to produce other DON, heightening the toxin content into the seeds [9]. It is then important to know which are the FHB- and DON-susceptible plant varieties in order to limit their diffusion into environments which are
favourable to the development of Fusarium strains as
well as to early detect the most aggressive F.
graminearum strains for checking their development in both field and storage conditions. In relation to this,
there is a real need to develop in seed bio-assays able to
rapidly individuate wheat varieties tolerant to DON in order to reduce the health risks related to toxin contamination [10, 11]. Moreover a reliable analytical method in order to early identify DON producing isolates would be useful since the identification of fungi solely based on morphological features might be difficult, time-consuming and usually requires taxonomic expertise.
F. graminearum become evident only when the grains are heavily-contaminated. Recent advances in DNA-based techniques confer to real-time PCR assays an important role among molecular screening methods because of the accelerated diagnostic outcome, and of the ability to perform an early detection of the considered fungi, so that, this method is providing new tools for fungal detection and quantification in kernel, in other plant tissues and complex matrix [12-15].
The aims of this study were the set up of an in seed
post harvest assay capable of partly reproducing the in
planta in field screening of wheat varieties, i.e. individuating a DON-tolerant seeds profile in
FHB-tolerant plants, an analytical method to quantify F.
graminearum strains through a SYBR green Real-time PCR assay [16-19], and the evaluation of the relationship between fungal DNA concentrations growth and DON production by the mean of the Principal Components Analysis (PCA).
2. Materials and Methods
2.1 Fungal Strains
DON-producing Fusarium graminearum strains,
Gibberella zeae perfect stage, Fg8308 and Fg126, were supplied from the collection of CNR-ISPA Bari-Italy.
2.2 Wheat Varieties
Evaluation of Fusarium Graminearum Growth and Deoxynivalenol Content in Susceptible and Tolerant Varieties of Triticum Aestivum
83
FHB-tolerant (T) “Blasco” and the FHB-susceptible (S) “Sagittario” were supplied by CRA-QCE Roma-Italy.
2.3 Inoculation of Two Varieties of Soft Wheat with F. Graminearum
Each wheat samples (20 g) was superficially sterilized (2% chlorex solution), rinsed threefold by
sterilized distilled water, moistened up to 0.94 aW and
then inoculated with 100 μl of F. graminearum
(Fg126 and Fg8308) conidia suspension (106/ml). The
moistening did not allow an early germination of the seeds, even if moistened un-inoculated seeds are able to germinate after 15 days of incubation in the same conditions as below. As it is shown in Table 1, the wheat inoculated with the pathogen was analysed after
0, 1, 3, 7, 10 and 15 d.p.i. at 25 ℃.
2.4 DNA Extraction from Wheat Grains
DNA of contaminated wheat seeds has been extracted according to Färber method with slight modifications [20]. An amount (100 mg) of fresh wheat grains were grounded in liquid nitrogen and incubated with 500 µl of extraction buffer (Tris-HCl 200 mM pH8.0, NaCl 250 mM, EDTA 25 mM, SDS
0.5%) for 60 min at 65 ℃ in an orbital shaker. After
incubation, samples were put on ice for 10 min and
centrifuged at 12,000 rpm for 15 min at 4 ℃. The
supernatant was collected in a 2 ml tube and 3/10 volume of sodium acetate 4 M was added. This solution was placed on ice for 30 min and centrifuged
at 12,000 rpm for 10 min at 4 ℃ and the supernatant
was transferred, extracted with hand shaking phenol-chloroform-isoamylic alcohol (25:24:1 v/v/v)
and centrifuged at 12,000 rpm for 10 min at 4 ℃. The
supernatant was transferred again and added with chloroform (1:1 v/v), was shaken for 5 min, centrifuge
for 15 min at 4 ℃ and precipitated by adding 0.5
volume of cold 2-propanol. One more precipitation
step was done adding 200 µl of H2O, 20 µl of
CH3COONa (3 M pH5.2) and 440 µl of ethanol. After
20 min incubation at -20 ℃ and centrifuge at 12,000
Table 1 Wheat samples.
Sample Description Time of analysis 1 Non inoculated tolerant (T) variety /
2 Non inoculated susceptible (S)
variety /
3 T variety inoculated with Fg 126 Zero 4 T variety inoculated with Fg 8308 5 S variety inoculated with Fg 126 6 S variety inoculated with Fg 8308 7 T variety inoculated with Fg 126
1 8 T variety inoculated with Fg 8308 9 S variety inoculated with Fg 126 10 S variety inoculated with Fg 8308 11 T variety inoculated with Fg 126
3 12 T variety inoculated with Fg 8308 13 S variety inoculated with Fg 126 14 S variety inoculated with Fg 8308 15 T variety inoculated with Fg 126
7 16 T variety inoculated with Fg 8308 17 S variety inoculated with Fg 126 18 S variety inoculated with Fg 8308 19 T variety inoculated with Fg 126
10 20 T variety inoculated with Fg 8308 21 S variety inoculated with Fg 126 22 S variety inoculated with Fg 8308 23 T variety inoculated with Fg 126
15 24 T variety inoculated with Fg 8308 25 S variety inoculated with Fg 126 26 S variety inoculated with Fg 8308
rpm for 30 min at 4 ℃ the pellet was washed with
70% cold ethanol, centrifuged at 13,000 rpm for 10
min, dried at 64 ℃ and resuspended in 30 µl of sterile
water containing 20 mg/ml RNAse.
2.5 Optimization of End-Point PCR Conditions
Before starting analyses on real samples, F.
graminearum strains were tested inoculating cultures
of Potato Dextrose Broth in the dark at 25 ℃ without
shaking. For each strain, the mycelium was harvested, washed with sterile water, lyophilized, and stored at
-20 ℃. In order to ascertain if the F. graminearum
Evaluation of Fusarium Graminearum Growth and Deoxynivalenol Content in Susceptible and Tolerant Varieties of Triticum Aestivum
84
TA) and 4056-3551 primers (for_ATC CCT CAA AAA CTG CCG CT; rev_ACT TTC CCA CCG AGT ATT TC). Both primers were designed by Konietzny and Greiner [22], in the trichothecene gene cluster
intergenic region Tri5-6. According to this method, the
N1-2 primer pair designed into the tri5-tri6 sequences yielded a 200-bp fragment for high-producing strains, whereas no amplification should be observed for low-producing strains. Conversely, with the 4056-3551 primers pair, the PCR amplification yielded a 650-bp fragment for low-producing strains, whereas no amplification should be observed for high-producing
strains. End-point PCR was prepared in 25 μl reaction
mixture which contains buffer 1X (SIGMA), MgCl2 3
mM, dNTPs 0.4 mM, Taq 1 U/μl and 0.4 μM of each
primer. PCR was performed with the following cycling
conditions: 94 ℃ for 2 min, followed by 35 cycles of
94 ℃ for 1 min, 55 ℃ for 30 s and 72 ℃ for 40 s.
Thermal cycle ended with an annealing step for 8 min
at 72 ℃. PCR products were run on a 1% agarose gel
and analyzed.
2.6 Real-Time PCR Operative Conditions (Optimized
for SYBR Green)
In order to monitor fungal growth onto the wheat seeds, a specific SYBR green qPCR method was set by using N1-2 primers, mentioned above. Real-time PCR
was prepared in 20 μl reaction mixture which contains
SYBR green JumpStart Taq Ready Mix 1X (SIGMA),
MgCl2 3mM and 0.5 μM N1-2 primes. Real-time PCR
was performed in a LineGene K PCR detection systems (Bioer, Japan) with the following cycling conditions:
95 ℃ for 10 min, followed by 40 cycles of 95 ℃ for 15
s, 55 ℃ for 30 s and 72 ℃ for 1 min. Standard
calibration was performed plotting the real-time PCR
signals obtained for F. graminearum genomic DNA
extracted from both fungal strains in the concentration range 5 ng - 1 pg (data not shown). The equation describing the increase of DNA concentration were
calculated (Fg126: y = −3.47x + 29.5, R2 = 0.9972;
Fg8308: y = −3.79x + 33.7, R2 = 0.9991) and used
afterwards as a reference standard for the extrapolation of quantitative information for DNA targets of unknown concentrations. The efficiency of the PCR reaction (Fg126 = 94% and Fg8308 = 83%) was
obtained from calibration curves slope (E = 10-1/slope −
1). Real-time PCR amplification reactions were carried out in triplicate from two independent experiments and the results were expressed as ng(DNA)/g(wheat grain).
2.7 Ergosterol Extraction and Determination
In order to extract the whole of ergosterol forms present in wheat, samples were treated as described by Gessner [23]. Ergosterol analysis was carried out, on the whole set of samples, by high-pressure liquid chromatography (HPLC Agilent 1200 series) coupled to a DAD analyser (Agilent) and equipped with a
Symmetry C18 column (150 mm × 4.6 mm, 5 μm)
preceded by a pre-column of the same material (Waters). Quantitative determination was performed by analysing the signal emitted at 280 nm. Methanol
100% at 0.6 ml·min-1 was used for isocratic elution
and a volume of 20 μl sample was injected. Stock
solutions were prepared by dissolving the solid commercial molecule (SIGMA) in methanol 100% at
concentration of 2.5 ng·μl-1. This solution was used to
made a standard curve injecting 25, 50, 75, 100, 125 ng of ergosterol. The results were expressed as nanograms of ergosterol per gram of dry matter.
2.8 DON Extraction and Analysis
An amount (10 g) of fresh wheat grains were grounded in liquid nitrogen and extracted with 30 ml of
H2O: acetonitrile (84: 16) mixture by shaking for 1 min.
Evaluation of Fusarium Graminearum Growth and Deoxynivalenol Content in Susceptible and Tolerant Varieties of Triticum Aestivum
85
analyzer (Agilent) was employed for the detection. Two different methods were used to detect DON, its glucosylated (3-GDON) and acetylated (3- and 15-ADON) chemotypes. For DON and 3-GDON a volume of 25 µl sample was separated on an Symmetry
C18 column (150mm × 4.6mm, 5μm) preceded by a
pre-column of the same material (Waters). Acetonitrile: water (10:90) mixture was used for isocratic elution.
The 0.6 ml·min-1 mobile phase flow rate and 25 ℃
column temperature were found as optimal. For the acetylated forms a volume of 25 µl sample was separated on a Zorbax-C18, 150 × 4.6 mm, 5 µm column. Acetonitrile in water (10:90) (mobile phase A) was used for isocratic elution with 14% of acetonitrile
(mobile phase B). The 0.6 ml·min-1 mobile phase flow
rate and 25 ℃ column temperature were found as
optimal. For all the injected molecules, 10 ng·μl-1 stock
solutions were prepared by diluting each standard (BIOPURE) in mobile phase (A). These solutions was used to made a standard curves. The results were expressed as ng of DON (or derivatives) per gram of dry matter or as parts per billion.
2.9 Statistics
All the experiments were carried out in three replicates. The values presented in the following figures are the mean ± S.E. of 6 different results. The mean values were compared by using the
Mann-Whitney test; P values above 0.05 were
considered not significant. Principal Components Analysis (PCA) [24] was performed on the whole set of data (DON and DNA concentrations of the two fungal strains over different incubation times). PCA is a projection method for the extraction of systematic variations in a dataset. Analysis of variance (ANOVA) was applied in the comparison of the treatments, and significance of differences were tested at 95% confidence by Fisher’s LSD test which is a least significant difference (LSD) method consisting in a two-step testing procedure for pair wise com- parisons of several treatment groups. Calculations were
performed using XLSTAT Addinsoft software [25].
3. Results and Discussion
3.1 F. Graminearum Identification
As shown in Fig. 1, a discrete band is obtained only with the amplification with N1-2 primers whereas the amplification with 4056-3551 primers results in an
aspecific pattern, indicating that both F. graminearum
strains (Fg126 and Fg8308) are high-DON producers.
3.2 Detection of F. Graminearum in Contaminated Wheat: A Double Approach through Biochemical and
Molecular Markers
The wheat varieties were chosen from an in-field pre-screening. The epidemiological results indicated that “Sagittario” is a FHB-susceptibile whereas “Blasco” is a FHB-tolerant variety [26, 27]. Thus, in this study the authors intend to propose a preliminary approach for screening the seeds of wheat varieties which are resistant, i.e. able to actively hamper, to DON accumulation.
The two fungal strains showed a similar trend of growth on “Blasco” and “Sagittario”, i.e., exponential increase in ergosterol and DNA amount during the time course. In particular, Fg126 achieved the highest amount of ergosterol concentration in both wheat varieties already after 7 days of incubation (Fig. 2).
Fig. 1 Agarose 1% gel electrophoresis.
Evaluation of Fusarium Graminearum Growth and Deoxynivalenol Content in Susceptible and Tolerant Varieties of Triticum Aestivum
86
In Fig. 3, DNA quantification of Fg126 and Fg8308 partially overlap with the results obtained with ergosterol quantification, even if the DNA assay lacks in sensitiveness (i.e. no significant increase between 10 and 15 d.p.i.) in the the late times of growth. The use of primers N1-2 could be fundamental for the set up of a rapid screening test into the field. In fact, these primers are quantitative and qualitative molecular markers able to discriminate the presence of minimal amount of fungal propagula of high-DON producer
strains of F. graminearum directly onto viable kernels.
Fungal growth of the Fusarium strains on the different
Triticum varieties was compared and analysed by ANOVA for evaluating the significance of the differences. The test confirmed that Fg126 grown more than Fg8308 on both the wheat varieties (Fisher
test, P < 0.05). The results also showed an almost
precise overlap, at least up to 7 d.p.i., with the quantification of fungal growth obtained by ergosterol quantification.
3.3 Occurrence of DON and Its Derivatives in Inoculated Wheat
It has been demonstrated that, within the same species and in the same culture conditions, toxin
production by Fusarium strain may vary sharply; some
strains produce large amounts of trichothecenes, whereas others produce small or undetectable amounts [28-32]. Most important differences in DON biosynthesis are evident after 10 days of incubation onto wheat seeds. An higher DON amount is produced
by Fg126 (~ 60 μg·g-1) in comparison with Fg8308
strain (~ 20 μg·g-1) after 15 days of incubation onto the
susceptible variety (Fig. 4).
Indeed, both F. graminearum strains synthesise an
higher amount of DON onto “Sagittario” than in
“Blasco” (~ 5 μg·g-1 for Fg8308, ~ 8 μg·g-1 for Fg126).
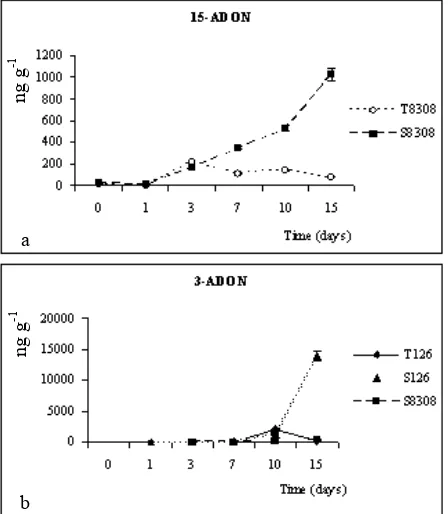
Moreover, concerning the DON acetylated forms, only Fg8308 strain produces 15-ADON (Fig. 5a), whereas 3-ADON is produced only by Fg126 (Fig. 5b).
3-ADON is usually produced by Fusarium strains in
order to avoid an auto-intoxication by the DON itself [33]. In relation to this, Fg126 strain only seems able to activate this auto-defence mechanism.
Plants either can detoxify DON by converting a part
of the toxin produced by Fusarium in the less toxic
3-GDON [34]. It was found that also the re-activated stored wheats seeds are able to convert part of the DON into 3-GDON. The concentration of this less toxic masked mycotoxin corresponds to 5 up to 10 percent of
the total DON produced by F. graminearum onto
wheat seeds (Fig. 6).
Fig. 2 Ergosterol quantification through HPLC on “blasco” (T) variety and “sagittario” (S) variety.
Fig. 3 DNA quantification (qPCR of N1-2 fragment) on “blasco” (T) variety and “sagittario” (S) variety.
Fig. 4 DON quantification through HPLC method.
ng
(er
g
) g
-1 (g
rai
n
)
n
g
(DNA
) g
-1 (g
rain)
ng
g
Evaluation of Fusarium Graminearum Growth and Deoxynivalenol Content in Susceptible and Tolerant Varieties of Triticum Aestivum
87
Fig. 5 Quantification through HPLC method of 15-ADON (a) and 3-ADON (b).
3.4 F. Graminearum Growth Related to Deoxynivalenol (DON) Levels
To evaluate if a positive correlation between fungal growth and DON synthesis may exist, the
concentration of Fusarium DNA (fungal growth) was
compared to the concentration of DON in the wheat samples at different incubation times. In PCA analysis, quite low degrees of correlation between DNA and DON concentrations were observed. This is due to the significant differences emerged in the ability to grow
and synthesize DON between the F. graminearum
strains in relation with the different varieties of wheat on which the pathogens developed. A constant increase of fungal DNA concentration in seeds with incubation time, did correspond for an equivalent increase of DON synthesis in all the combinations of fungal strain/wheat variety
The Scree plot of the PCA (Fig. 7) shows that the first four eigenvalues (F1-4) correspond to the whole percentage of the variance in the dataset.
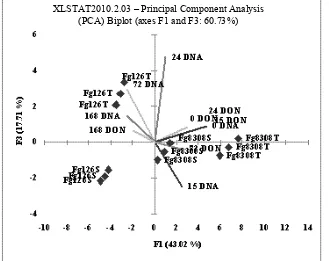
Plots of the observations and variables in the factor space were reported in Figs. 8 and 9 according to the
first two principal components F1 and F2. In the plot showing the variables (Fig. 8) a weak correlation between the variables DON and DNA at time 15 is shown, whereas DON values at 0 to 7 d.p.i. are correlated with DNA values at time 0. These results are relevant to the whole set of samples. A higher degree of correlation between DON and DNA data could be obtained considering separately the different fungal strains with single wheat variety (data not shown).
The PCA plot obtained with the components F1 and F2 accounted for the 61.81% of the variability and the observations were grouped according to both the fungal strains and the different wheat varieties (Fig. 9). On the whole, the PCA analysis showed a different growth and different degree of DON production of fungal strains on respect to the wheat variety infected. In fact, a clear cut separation was observed on the basis
Fig. 6 Quantification through HPLC method of 3-GDON.
Fig. 7 Scree plot of the PCA. The first three Eigenvalues (F1-3) correspond to a high % of the variance, and will be used to build the biplots.
n
g
g
-1
Ei
g
envalue
a
b
ng
g
-1
ng
g
-1
Cu
mu
lativ
e
v
ariab
ility
Evaluation of Fusarium Graminearum Growth and Deoxynivalenol Content in Susceptible and Tolerant Varieties of Triticum Aestivum
88
Fig. 8 Plot of the observations and variables in the factor space according to the first two Principal components F1 and F2.
Fig. 9 Plot of the observations and variables in the factor space according to the first and third Principal components F1 and F3.
of the fungal strains, which were sharply separated in the PCA plots (Fg126 all on the left, Fg8308 all on the right). A separation was observed in the plots also between the wheat varieties (S and T).
Thus, differences in DON concentration seem more related to fungal strain and wheat seeds variety typical features than to the pathogen development
per se.
XLSTAT2010.2.03 – Principal Component Analysis (PCA) Biplot (axes F1 and F2: 75.76%)
Evaluation of Fusarium Graminearum Growth and Deoxynivalenol Content in Susceptible and Tolerant Varieties of Triticum Aestivum
89
4. Conclusions
Since fungal diseases which lead to mycotoxin accumulation into feed- and foodstuff are widely diffused it is of paramount importance to establish preventive strategies aimed to restrain their diffusion. Thus, it results crucial to deepen the knowledge of plant-pathogen interactions for a subsequent application in diagnostics (i.e., quantitative, specie-specific methods) in order to develop efficient control strategies.
The preliminary results herein obtained indicate that the seeds of the FHB-susceptible variety “Sagittario” are more conducive for DON synthesis than the tolerant ones. This achievement could indicate that the seeds of an FHB-tolerant plant are more efficient in
hampering DON synthesis by F. gramineraum during
non optimal storage conditions. This rapid–compared
to the in field tests–in seed assay could represent a
helpful tool for avoiding or limiting the use of DON-conducive wheat varieties. Moreover, it was shown that it is possible to identify and quantify high
DON producing Fusarium strains through Real-time
PCR method in artificially contaminated soft wheat soon after fungal infection when no visible symptoms
can be detected (i.e., 24h post inoculation). Thus, this
RT-PCR approach could be used for further experiments directly into the field.
In this study, significant differences in the ability to
grow and synthesize DON between the F.
graminearum strains can be pointed out also in relation with the wheat variety on which the pathogens develop. These differences could reflect the existence of a complex signalling between the pathogen and its host which leads the fungus to produce more or less DON and the plant to tolerate or not its presence. Further studies are under way for elucidating these issues.
Acknowledgments
This work was partly supported by Me.Di.T.A.- “Metodologie diagnostiche avanzate per la qualità e la sicurezza dei prodotti alimentari del Mezzogiorno d’Italia” financed by MIUR under FAR. The authors
are grateful to Dr. M. Pasquini of CRA-QCE for having provided the wheat kernels of the two varieties, “Blasco” and “Sagittario” and CNR-ISPA for having provided the fungal strains.
References
[1] A. Champeil, T. Dorè, J.F. Fourbe, Fusarium head blight: epideminological origin of the effects of cultural practices on head blight attacks and the production of mycotoxins by Fusarium in wheat grains, Plant Sci. 166 (2004) 1389-1415.
[2] A. Bottalico, G. Perrone, Toxigenic Fusarium species and mycotoxins associated with head blight in small-grain cereals in Europe, Eur. J. Plant Pathol. 108 (2002) 611-624.
[3] M. Mc Mullen, R. Jones, D. Gallenberg, Scab of wheat and barley: a re-emerging disease of devastating impact, Plant Dis. 81 (1997) 1340-1348.
[4] S. Lautraite, D. Parent-Massin, B. Rio, H. Hoellinger, In vitro toxicity induced by deoxynivalenol (DON) on human and rat granulo-monocytic progenitors, Cell Biol. Toxicol. 13 (1997) 175-183.
[5] J.J. Pestka, A.T. Smolinski, Deoxynivalenol: toxicology and potential effects on humans, J. Toxicol. Env. Health 8 (1) (2004) 39-69.
[6] M.E. Savard, R.C. Sinha, S.W. Lloyd, G. Fedak, Sequential distribution of the mycotoxin deoxynivalenol in wheat spikes after inoculation with Fusarium graminearum, Can. J. Plant Pathol. 22 (3) (2000) 280-285. [7] M. Lemmens, U. Sholz, F. Berthiller, C. Dall’Asta, A.
Koutnik, R. Schuhmacher, et al., The ability to detoxify the mycotoxin deoxynivalenol colocalizes with a major quantitative trait locus for Fusarium head resistance in wheat, MPMI 18 (12) (2005) 1318-1324.
[8] S. Marın, V. Sanchis, F. Arnau, A.J. Ramos, N. Magan, Colonisation and competitiveness of Aspergillus and
Penicillium species on maize grain in the presence of
Fusarium moniliforme and Fusarium proliferatum, Int. J. Food Microb. 45 (1998) 107-117.
[9] B. Birzele, A. Prange, J. Krämer, Deoxynivalenol and ochratoxin A in German wheat and changes of level in relation to storage parameters, Food Add. Contam. 17 (12) (2000) 1027-1035.
[10] F. Berthiller, M. Sulyok, R. Krska, R. Schuhmacher, Chromatographic methods for the simultaneous determination of mycotoxins and their conjugates in cereals, Int. J. Food Micr. 119 (2007) 33-37.
Evaluation of Fusarium Graminearum Growth and Deoxynivalenol Content in Susceptible and Tolerant Varieties of Triticum Aestivum
90
[12] K. Brunner, M.P. Kovalsky Paris, G. Paolino, H. Bürstmayr, M. Lemmens, F. Berthiller, et al., A reference-gene-based quantitative PCR method as a tool to determine Fusarium resistance in wheat, Anal. Bioanal. Chem. 395 (2009) 1385-1394.
[13] O.J. Desmond, C.I. Edgar, J.M. Manners, D.J. Maclean, P.M. Schenk, K. Kazan, Methyl jasmonate induced gene expression in wheat delays symptom development by the crown rot pathogen Fusarium pseudograminearum, Physiol. Mol. Plant Pathol. 67 (2005) 171-179.
[14] Y. Yin, X. Liu, Z. Ma, Simultaneous detection of
Fusarium asiaticum and Fusarium graminearum in wheat seeds using a Real-time PCR method, Lett. Appl. Microbiol. 48 (2009) 680-686.
[15] J.G. Maciá-Vicente, H.B. Jansson, N.J. Talbot, L.V. Lopez-Llorca, Real-time PCR quantification and live-cell imaging of endophytic colonization of barley (Hordeum vulgare) roots by Fusarium equiseti and Pochonia chlamydosporia, New Phytol. 182 (1) (2009) 213-228. [16] D. Abramson, Z. Gan, R.M. Clear, J. Gilbert, R.R.
Marquardt, Relationships among deoxynivalenol, ergosterol and Fusarium exoantigens in Canadian hard and soft wheat, Int. J. Food Microbiol. 45 (3) (1998) 217-224.
[17] J.W. Muthomi, E.C. Oerke, E. De Wolf, H.W. Dehne, E.W. Mutitu, Susceptibility of Kenian wheat varieties to head blight, fungal invasion, and deoxynivalenol accumulation inoculated with Fusarium graminearum, J. Phytopathol. 150 (2002) 30-36.
[18] J. Perkowski, M. Wiwart, M. Bus´ko, M. Laskowska, F. Berthiller, W. Kandler, R. Krska, Fusarium toxins and total fungal biomass indicators in naturally contaminated wheat samples from north-eastern Poland in 2003, Food Addit. Contam. 24 (11) (2007) 1292-1298.
[19] L.M. Reid, R.W. Nicol, T. Ouellet, M. Savard, J.D. Miller, J.C. Young, et al., Interaction of Fusarium graminearum
and F. moniliforme in maize ears: disease progress, fungal biomass, and mycotoxin accumulation, Phytopathology 89 (11) (1999) 1028-1037.
[20] P. Färber, R. Geisen, W.H. Holzapfel, Detection of aflatoxinogenic fungi in figs by a PCR reaction, Int. J. Food Microbiol. 36 (2-3) (1997) 215-220.
[21] B. Bakan, C. Giraud-Delville, L. Pinson, D. Richard- Molard, E. Fournier, Y. Brygoo, Identification by PCR of
Fusarium culmorum strains producing large and small amounts of deoxynivalenol, Appl. Environ. Microb. 68 (11) (2002) 5472-5479.
[22] U. Konietzny, R. Greiner, The application of PCR in the detection of mycotoxigenic fungi in foods, Braz. J. Microbiol. 34 (2003) 283-300.
[23] M.O. Gessner, M.A. Bauchrowitz, M. Escautier, Extraction and quantification of ergosterol as a measure of fungal biomass in leaf litter, Microb. Ecol. 22 (1) (1991) 285-291.
[24] D.L. Massart, B.G.M. Vandegiste, S.M. Deming, Y. Michotte, L. Kaufmann, Chemometrics: a Textbook (Data Handling in Science and Technology 2), Elsevier Science, Amsterdam, 1988.
[25] T. Fahmy, XLSTAT-Pro 7.0 (XLSTAT), Addinsoft. Paris, France, 2003.
[26] M. Pasquini, A. Iori, A. Matere, L. Sereni, F. Casini, A. L’Aurora, et al., Sui frumenti più septoriosi e fusariosi della spiga, L’Informatore Agrario. 46 (2008) 48-52. (in Italian with English abstract)
[27] A. Iori, A. L’Aurora, A. Matere, L. Sereni, F. Casini, M. Pasquini, Frumenti biologici: prevale la septoriosi, L’Informatore Agrario. 42 (2008) 53-55. (in Italian with English abstract)
[28] Z. Atanassov, C. Nakamura, N. Mori, C. Kaneda, H. Kato, Y.Z. Jin, et al., Mycotoxin production and pathogenicity of Fusarium species and wheat resistance to Fusarium
head blight, Can. J. Bot. 72 (1994) 161-167.
[29] B.J. Blaney, R.L. Dodman, Production of the mycotoxins zearalenone, 4-deoxynivalenol, and nivalenol by isolates of Fusarium graminearum groups 1 and 2 from cereals in Queensland, Aust. J. Agric. Res. 39 (1988) 21-29. [30] M. Manka, A. Visconti, J. Chelkowski, A. Bottalico,
Pathogenicity of Fusarium isolates from wheat, rye and triticale towards seedlings and their ability to produce trichothecenes and zearalenone, Phytopathology 13 (1985) 24-29.
[31] J.D. Miller, R. Grennhalgh, Y. Wang, M. Lu, Trichothecene chemotypes of three Fusarium species, Mycologia. 83 (1991) 121-130.
[32] C.J. Mirocha, H.K. Abbas, C.E. Windels, W. Xie, Variation in deoxynivalenol, 15-acetyldeoxynivalenol, 3-acetyldeoxynivalenol, and zearalenone production by
Fusarium graminearum isolates, Appl. Environ. Microbiol. 55 (1989) 1315-1316.
[33] M. Kimura, G. Matsumoto, Y. Shingu, K. Yoneyama, I. Yamaguchi, The mystery of the trichothecene 3-O-acetyltransferase gene, FEBS Lett. 435 (1998) 163-168.
Journal of Life Sciences 5 (2011) 91-99
Genetic Diversity of the Medicinal Plant
Ocimum
Gratissimum
L. (mint) from Kenya Based on AFLP
Markers
Lexa G. Matasyoh1, Francis N. Wachira2, Miriam G. Kinyua3 and Anne W. Thairu Muigai1
1. Department of Botany, Jomo Kenyatta University of Agriculture and Technology, P.O. Box 62000, Nairobi, Kenya
2. Department of Biochemistry and Molecular Biology, Egerton University, P.O. Box 536, Egerton, Kenya
3. Moi University, Biotechnology Department, P.O. Box 1125, Eldoret, Kenya
Received: April 12, 2010 / Accepted: June 09, 2010 / Published: February 28, 2011.
Abstract: Ocimum gratissimum L. native to Africa is a shrubby essential oil containing plant with medicinal, antimicrobial and antihelminthic properties. It is an important herbal medicine not only among Kenyan communities but also in the sub-Saharan Africa. No systematic assessment of genetic variability in O. gratissimum of Kenya has been carried out. In this study, amplified fragment length polymorphism (AFLP) analysis was used to estimate genetic diversity and genetic differentiation in 139 samples from all the different provinces of Kenya. Seven primer pairs, the Eco+ACT plus Mse+CAA, Eco+ACT plus Mse+CTG, Eco+ACA plus Mse+CAA, Eco+ACA plus Mse+CTG, Eco+AGC plus Mse+CAA, Eco+ACC plus Mse+CAA, and Eco+ACC plus Mse+CAC were the best combinations and generated polymorphic 655 bands with fragment ranging in size from 50 - 473 bp in size. Populations from central Kenya had the highest levels gene diversity. Most of the variability was partitioned into within populations 71%; P < 0.001 implying that collection strategies for conservation should focus on a few populations with many individuals across the ecological amplitude of the population. Genetic differentiation was GST = 0.286, an indication of genetic variation among the populations.
Key words:Ocimum gratissimum L., AFLP, genetic diversity.
1. Introduction
Access to conventional health services in most of Africa is beyond the reach of most of the rural population. Traditional medicine provides an alternative health care system in most of Africa. Domestication of important medicinal plants is increasingly serving as an avenue for increasing household incomes as well as enhancing the availability of the curative plant products to healers and other resource users [1].
In Kenya, 2.9 million people live within 5 km of forest areas and thereby exert high pressure on forests such that out of the original closed canopy indigenous
Corresponding author: Lexa G. Matasyoh, Ph.D., research fields: botany, plant molecular biology. E-mail: lexa111@ hotmail.com.
forest cover of 1.64 million hectares, only 1.22 million hectares is left [2]. As most rural people in Kenya turn to usage of traditional medicinal plants that include important weeds, it is important to consider their genetic conservation.
Ocimum gratissimum L. is among the seven weed species identified as important medicinal herbs that merit conservation in central Kenya [3]. The species belongs to the Lamiaceae family, which has close to 252 genera and 6,700 species [4], most of which are used as medicine [5]. The essential oils found in leaves,
seeds, flowers and roots of Ocimum species are used as
medicine.
Under in vitro conditions, the oils have been
Genetic Diversity of the Medicinal Plant Ocimum Gratissimum L. (mint) from Kenya Based on AFLP Markers
92
as Candida albicans [6, 7].
Because of the biodiversity of its essential oils, O.
gratissimum has a high potential as a traditional medicine [6, 7], and its incorporation into agricultural systems would not only make the species accessible to the majority of the rural population that uses it, but also contribute to its genetic conservation. There is information based on volatile oils, flavanoids and
RAPD markers of O. gratissimum [8].
Biochemical and molecular techniques also provide an alternative approach for evaluating genetic diversity in crop plants. The application of DNA technology in agricultural research has progressed rapidly over the last twenty years, especially in the area of cultivar identification and characterization [9] as well as determination of population diversity in many plant species [10-14].
In this paper, the level and structure of genetic
diversity in wild populations of O. gratissimum was
evaluated using AFLP markers.
2. Materials and Methods
2.1 Leaf Sample Collection
Fresh leaf samples of O. gratissimum L. were
collected from 13 populations distributed throughout Kenya. Sampling was carried out in such a way as to sample different silvicultural zones across the ecological amplitude of the species. 139 samples were collected from the 13 populations (Table 3) in Western Province, Rift Valley Province, Central Province, Nyanza Province and Coast Province.
Collection sites were largely chosen in the natural habitats of the species though a few collections were also made from cultivated fields. Collection was done only on plants that had not flowered. For each population, a voucher specimen (805LG) was deposited at the Department of Botany Herbarium, Egerton University, Kenya. A population comprised of clustered plants that were delimited from another cluster. Within each population sampling was carried out from individuals that were separated by an average
distance of about five meters. The collected leaf samples were wiped dry with cotton wool and then stored in the freezer. This method of preservation allowed several months of storage without affecting the yield and quality of the extracted DNA [15].
2.2 Genomic DNA Isolation
Genomic DNA was isolated using the modified SDS method with the reducing agent dithiothreitol as described [16].
Amplified fragment length polymorphism analysis (AFLP-PCR) method was carried out following the standard procedure as described [17] and adapted in the AFLP ® Plant Mapping protocol of the Applied Biosystems (ABI), USA.
2.2.1 Template Preparation and Adaptor Ligation Before carrying out the AFLP analysis, the suitability of the restriction enzymes chosen to cut the
O. gratissimum genomic DNA was firstly tested. This was carried out by digesting the genomic DNA with
MseI (frequent-4-base cutter-TAA) and EcoRI
(rare-6-base cutter-AATTC) restriction enzymes separately and then in combination. 20 µl of the
genomic DNA was incubated for 2 hrs at 37 ℃ with 2
µl of EcoRI/MseI (1.25 U/µl each in 10 mM Tris-HCl
(pH 7.4), 50 mM NaCl, 0.1 mM EDTA, 1 mM DTT, 0.1 mg/ml bovine serum albumen (BSA), 50% glycerol
(v/v), 0.1% Triton® X-100), and 5 µl of 5× reaction
buffer (50 mM Tris-HCl (pH 7.5), 50 mM Mg-acetate, 250 mM K-acetate). 5 µl of each of the digested products sample in 5 µl of 1× blue dye was run on 1.5% agarose gel in 1× TBE to check for complete digestion with DNA size markers (100 bp ladder).
A restriction-ligation enzyme master mix was
prepared by combining 1 µl of T4 DNA ligase (1 U/µl
in 10 mM Tris-HCl (pH 7.5), 1 mM DTT, 50 mM KCl, 50% (v/v) glycerol) with 24 µl adapter/ligation solution
(EcoRI/MseI adapters, 0.4 mM ATP, 10 mM Tris-HCl
(pH 7.5), 10 Mm Mg-acetate, 50 mM K-acetate). The adapter pairs were first annealed to make them double
Genetic Diversity of the Medicinal Plant Ocimum Gratissimum L. (mint) from Kenya Based on AFLP Markers
93
for five minutes. The tubes were then cooled to room temperature over a 10-minute period. This reaction mixture was then incubated at room temperature overnight. The restriction-ligation products were then diluted by adding 18.9 µl of 1× TE to 10 µl of the reaction mixture in a 1.5 ml micro-centrifuge tube to give the appropriate concentration for subsequent PCR.
The diluted products were stored at 4 ℃ for use within
one month or – 20 ℃ for longer period.
2.2.2 Pre-selective Amplification
PCR amplification of the adapter-ligation restriction fragments was performed for subsequent selective amplification. The PCR reactions were performed in a 20 µl volume consisting of 4.0 µl diluted restriction-ligation DNA products, 1.0 µl AFLP pre-selective primer pairs and 15 µl core mix. Pre-amplification was
carried out at initial hold time of two minutes at 72 ℃
followed by 20 cycles of 20 seconds at 94 ℃, 30
seconds, at 56 ℃, and 72 ℃ and a further hold time of
30 minutes at 60 ℃.
2.2.3 Verification of Successful Amplification To check the success of the pre-selective amplification reaction, 10 µl of pre-selective amplification products was mixed with 2 µl of 10× loading dye and run on 1.5% agarose gel in 1× TBE buffer at 4 V/cm for 3.30 hrs. The gel was stained with 1 µg/ml ethidium bromide and viewed on a UV transilluminator. The presence of a smear of products from 100-1,500 bp meant that the pre-amplification was successful. For each sample, 10 µl of the pre-selective amplification product was then diluted
with 19.0 µl 1× TE buffer, and stored at 4 ℃.
2.2.4 Selective Amplification Reaction
Selective amplification was conducted using various
combinations of two AFLP primers specific for EcoRI
and MseI primer adapters on a test panel of
representative samples. These primers have three
additional 3’ nucleotides. The EcoRI primers are
florescent-labelled (Table 1). Initially, 16 primer combinations were used for screening in a representative sample of four accessions (Table 1).
Seven of the best primers (*) showing high polymorphism were then used in full analysis of the test germplasm. The selective PCR was performed in 20 µl volumes consisting of 3 µl of the diluted pre-selective amplification products, 1 µl
florescent-labeled EcoRI primer, and 1 µl of MseI
primer and 15 µl of AFLP core mix. The selective PCR amplification was programmed for an initial two
minutes at 94 ℃ followed by one cycle of 94 ℃ for 20
seconds, 66 ℃ for 30 seconds and 72 ℃ for two
minutes. This cycle was repeated 12 times with a
lowering of the annealing temperature of 1 ℃ per cycle.
This was followed by 20 cycles of 94 ℃ for 20 seconds,
56 ℃ for 30 seconds and 72 ℃ for two minutes and a
further hold time of 30 minutes at 60 ℃.
2.3 Selective Amplification Product Resolution
The ABI capillary system from Applied Biosystems-ABI (Forster City, CA, USA) located at the International Livestock Research Institute (ILRI), in Nairobi, Kenya, was used to resolve the selective amplification products in this study.
Samples were prepared for analysis on ABI 3130×l genetic analyzer from the selective amplification products. Each run consisted of 96 samples. Samples were loaded through the use of an autoloader, which transfered a small aliquot of purified sample from a 96 well plate. A loading buffer mix was prepared by adding 12 µl of Gene Scan 500 LIZ internal size standard (ABI) to 1 ml (1,000 µl) deionised formamide HiDi. 9 µL of the size standard mix was added to 1 µl of the selective amplification products in a MicroAmp
Table 1 AFLP selective amplification primers screened in
Ocimum gratissimum L..
Mse I primers
Genetic Diversity of the Medicinal Plant Ocimum Gratissimum L. (mint) from Kenya Based on AFLP Markers
94
PCR Plate. From the ABI 3130xl genetic analyzer, the sample data was directed to the GeneMapper Software version 3.0 which analysed and displayed the sizing results as electrograms and tabular data.
The Southern algorithm automatically calculated the fragment sizes using the GeneMapper Software version 3.0. The software was used to score the alleles. Category bins were created in GeneMapper to be able to group peaks based on the sizes of the allele. The category was defined by size in base pairs and an automatic standard deviation which was a maximum shift that a fragment could show across the individual capillaries and still be scored as the same allele. Athreshold of the peak height was set at 50-500 relative fluorescent units (rfu) such that any peak that was below this was treated as an artifact and was not scored by the software [18]. Category bins and peak height threshold ensured accurate allele scoring.
2.4 Data Analysis
The analysis was based on both individual and population frequency data. Arlequin software version 2.000, POPGENE Ver. 1.32 and GenA1Ex 6 were used in the study.
2.4.1 Nei’s Unbiased Diversity
Population allele frequency data and diversity values estimated assuming Hardy-Weinberg equilibrium were calculated and analysed with POPGENE Ver. 1.32 [19] using Nei’s unbiased statistic [20]:
H = n (1- ∑ [pi2])/ (n-1) (1)
Where n = number of individuals analysed, and pi is
the frequency of the ith allele.
Diversity values were averaged across loci. 2.4.2 Nei’s Genetic Distance and Cluster Analysis Genetic distance (D) between population frequency data set was generated with POPGENE 1.32 [19] from the equations of Nei [21];
D = -1n [JXY / (JXJY) ½] (2)
Where, Jx, Jy and Jxy are the arithmetic means of the
individual loci identities ∑xi2, ∑yi2 and ∑xiyi over all
loci, respectively.
Cluster analysis based on genetic distances was undertaken according to equations of Nei [21] using unweighted pair-group method with arithmetic averaging (UPGMA) [22] to generate a dendrogram showing relationships among populations. The degree of polymorphism was also quantified using Shannon’s index of phenotypic diversity [23].
The ARLEQUIN software version 2.000 [24] and GenA1Ex 6 were used to partition genetic variation into within and between populations components according to an analysis of molecular variance (AMOVA) [25] based on Euclidean distance. Significance values were assigned to variance components based on the random permutation (5000 times) of individuals assuming no genetic structure.
3. Results
3.1 Total Number of Bands Analysed
Six hundred and fifty five polymorphic AFLP bands were generated by the seven primer pairs analysed (Table 2) from 139 samples. The total number of bands
scored per primer ranged from 70 (Eco+AGC -
Mse+CAA) to 136 (Eco+ACT - Mse+CAA), with an
average of 94 bands per primer. The size of the amplified fragments ranged from 50 to 473 base pairs (bp). The number of scorable markers was highest for
primer 5’ Eco+ACT - Mse+CAA 3’ and lowest for
primer sequence 5’ Eco+AGC - Mse+CAA 3’. The
highest fragment range was in primer sequence Eco
Table 2 Sequences of primers analysed, total number of bands analysed and their fragment size.
Genetic Diversity of the Medicinal Plant Ocimum Gratissimum L. (mint) from Kenya Based on AFLP Markers
95
+ACC - Mse+CAC. The control which was a tomato
gave the least number of amplified loci in the range 12 to 32. The other control which was sterilised distilled water did not give any amplification.
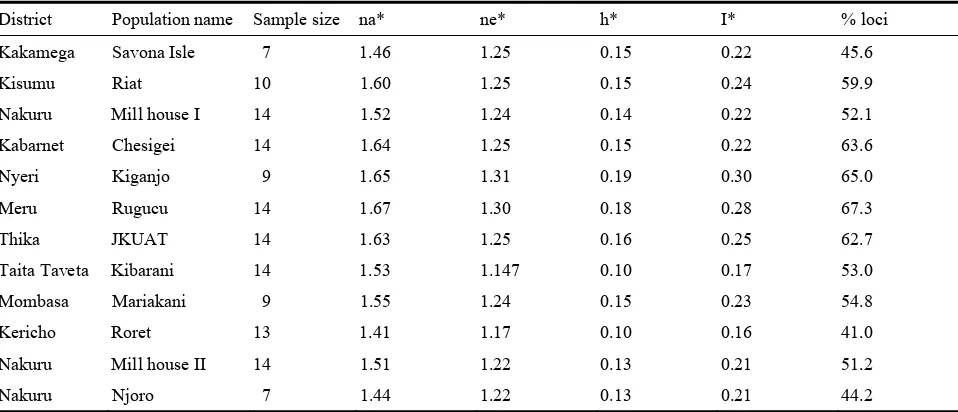
3.2 Nei’s Unbiased Genetic Diversity
Estimates of Nei’s unbiased genetic diversity are represented in Table 3. The estimates ranged from H = 0.10 to H = 0.19. The populations from Taita Taveta (Kibarani) and Kericho (Roret) were the least diverse (H = 0.10) while the Nyeri (Kiganjo) was the most diverse (H = 0.19). The same order of diversity measures was revealed by Shannon’s information index (I). There was also correspondence of percentage polymorphic loci with the diversity estimates. Populations with high diversity estimates also had high levels percentage polymorphic loci. The observed number of alleles (na) and the effective number of
alleles (ne) were high in areas with high diversity and low in those with low diversity.
3.3 Analysis of Molecular Variance
Summaries of analyses of molecular variance are represented in Table 4. The results indicated that most variation was found among individuals within
populations 71%, P < 0.001. Variations among
populations accounted for only 29 %, P < 0.001 of the
total in the species variation.
A dendrogram (Fig. 1) based on Nei’s genetic distance (D) revealed two major clusters and four sub-clusters which did not necessarily correspond to the geographical distribution of the populations. The Mombasa (Mariakani) population (coast region) clustered with the population from Nakuru and the Kericho (rift valley region). Similarly, the other coastal populations, (Taita taveta-Kibarani) clustering with
Table 3 Mean diversity estimates (h) and Shannon’s information index (I) for twelve Kenyan populations of Ocimum
gratissimum L. derived from AFLP markers.
District Population name Sample size na* ne* h* I* % loci
Kakamega Savona Isle 7 1.46 1.25 0.15 0.22 45.6
Kisumu Riat 10 1.60 1.25 0.15 0.24 59.9
Nakuru Mill house I 14 1.52 1.24 0.14 0.22 52.1
Kabarnet Chesigei 14 1.64 1.25 0.15 0.22 63.6
Nyeri Kiganjo 9 1.65 1.31 0.19 0.30 65.0
Meru Rugucu 14 1.67 1.30 0.18 0.28 67.3
Thika JKUAT 14 1.63 1.25 0.16 0.25 62.7
Taita Taveta Kibarani 14 1.53 1.147 0.10 0.17 53.0
Mombasa Mariakani 9 1.55 1.24 0.15 0.23 54.8
Kericho Roret 13 1.41 1.17 0.10 0.16 41.0
Nakuru Mill house II 14 1.51 1.22 0.13 0.21 51.2
Nakuru Njoro 7 1.44 1.22 0.13 0.21 44.2
* na = Observed number of alleles; * ne = Effective number of alleles [26]; * h = Nei's [21] unbiased measure of genetic diversity; * I = Shannon's Information index [27]; % loci = Percentage polymorphic loci.
Table 4 Summary of AMOVA by GenA1Ex 6.
Source df SS MS Est. Var. component of variation % ΦST value Prob.
Among pops 11 1,262.982 114.817 8.187 29% < 0.001**
Within pops 127 2,601.795 20.487 20.487 71% 0.286 < 0.001*** Total 138 3,864.777 135.303 28.674
Genetic Diversity of the Medicinal Plant Ocimum Gratissimum L. (mint) from Kenya Based on AFLP Markers
96
Table 5 Nei's Unbiased Measures of Genetic distance [21] between 12 populations of O. gratissimum L. sampled from Kenya.
POP ID 1 2 3 4 5 6 7 8 9 10 11 12
1 ****
2 0.0085 ****
3 0.0053 0.0170 ****
4 0.0146 0.0298 0.0057 ****
5 0.0274 0.0463 0.0232 0.0101 ****
6 0.0451 0.0697 0.0422 0.0287 0.0020 ****
7 0.0502 0.0707 0.0417 0.0268 0.0035 0.0022 ****
8 0.0430 0.0718 0.0363 0.0212 0.0166 0.0197 0.0123 ****
9 0.0904 0.1371 0.0910 0.0798 0.0604 0.0463 0.0470 0.0575 ****
10 0.1464 0.1859 0.1473 0.1332 0.1014 0.0843 0.0909 0.1066 0.0425 ****
11 0.1194 0.1611 0.1204 0.1011 0.0759 0.0622 0.0678 0.0857 0.0214 0.0283 **** 12 0.1446 0.1828 0.1502 0.1302 0.0973 0.0806 0.0914 0.1181 0.0390 0.0377 0.0167 **** Population Identity: 1-Kakamega, 2-Kisumu, 3-Nakuru, 4-Kabarnet, 5-Nyeri, 6-Meru, 7-Thika, 8-Taita Taveta, 9-Mombasa, 10-Kericho, 11-Mill House, and 12-Njoro.
populations from central Kenya (Nyeri, Meru and Thika). In this cluster, the central region populations clustered together forming a tight clade (Nyeri, Meru and Thika). Kisumu (Riat) population from western region clustered with the Kakamega and Mill House I populations.
4. Discussion
4.1 Genetic Relations in Ocimum Gratissimum L.
Populations as Revealed by AFLP-PCRs
These results presented here show that AFLP
markers can be generated at great speed in Ocimum
gratissimum. Because of the nearly unlimited number of markers that can be generated with AFLP-PCR, the use of a series of different primer combinations, will often reveal variable genome regions [17] and thus provide the necessary tool to reveal even minor genetic differences within any given group of organisms.
The AFLP assay was therefore able to provide all the information necessary for our genetic diversity study. The results on estimates of Nei’s unbiased gene diversity (H) revealed that some populations had very low and others very high gene diversity. The Shannon’s Information index (I) also gave a similar order of population diversity. This order of population diversity could be related to the origin of the seeds for
this species. Nyeri (Kiganjo) population was the most diverse, followed by the Meru (Rugucu) population. The Nyeri, Meru and Thika, populations all from the central region, had generally high genetic diversity. It
is possible that the seeds for O. gratissimum were
introduced to the other areas of Kenya from the central region. The low diversity seen in Kericho population could be because of introduced seed based on only a few cultivars or seed from a restricted source as has also been shown in other studies where crop plants have been introduced [28]. Low population densities have also been linked to reduction in the expected heterozygosity and gene diversity of populations [29] which is attributed to restricted choice of maternal plants and genetic drift. This could also be related to populations like Kericho (Roret). The Kericho (Roret) population also showed the least percentage polymorphic loci.
Genetic Diversity of the Medicinal Plant Ocimum Gratissimum L. (mint) from Kenya Based on AFLP Markers
97
Fig. 1 Dendrogram based on Nei's [21] Genetic distance: Method = UPGMA, Modified from NEIGHBOR procedure of PHYLIP Version 3.5 from 6237 AFLP markers for 12 populations of O. gratissimum L. sampled from Kenya. (Population names in paranthesis).
individuals within populations [30]. So if a population of O. gratissimum happens to be growing in a farm which is cultivated regularly like in the Kericho situation, the number of generations is reduced as
compared to an idle land which is overgrown with O.
gratissimum and other weeds.
Nested AMOVA indicated significant genetic
variation (P < 0.001) within populations. Partitioning
of the genetic diversity revealed that overall, most of the variation (71 %) resided within populations. This
finding seems to indicate that Ocimum gratissimum is a
predominantly out crossing species. Out crossing species retain considerable variability within populations [31]. Similar observations have been made in Cannabis sativa [32], Camellia sinensis [28], Ilex paraquareensis [33] etc.. Though the populations are distant from each other the low divergency among the populations could also be explained by the occurence of gene flow among populations, through exchange of
germplasm. It is likely that material in the different populations has a common origin and material has been moved from one habitat to another.
Genetic differentiation among populations is principally a function of gene flow among populations via pollen and seed dispersal. GST (which is the degree of gene differentiation among populations in terms of allele frequency) was 0.286. This study seems to reveal that even after the initial introductions of the seed from the Central region of Kenya to the other areas, there has been some degree of further exchange of germplasm resources by seed or plant material and therefore populations from different areas have largely continued to evolve in the same direction.
Indeed the dendogram showed that the populations from Nyeri, Meru and Thika clustered together. This is expected because all these populations come from the same region, the central region of Kenya. Despite the geographical proximity of Mill House I to Mill House
Kakamega (Savona Isle) Nakuru (Mill House I) Kabarnet (Chesigei)
Nyeri (Kiganjo) Kisumu (Riat)
Meru (Rugucu) Thika (JKUAT)
Taita Taveta (Kibarani) Mombasa (Mariakani) Nakuru (Mill House II)
Nakuru (Njoro) Kericho (Roret)
1
2
1a
2b 1b
2a
Genetic Diversity of the Medicinal Plant Ocimum Gratissimum L. (mint) from Kenya Based on AFLP Markers
98
II and Njoro populations (< 30 Km), the Mill House II and Njoro populations seem to be genetically closer to the Mombasa population (> 600 Km). This clustering may reflect past germplasm exchange events as earlier discussed. Therefore, not enough evolutionary time has passed to allow mutation and high differentiation among the populations.
There is a general lack of information on the
reproductive biology of O. gratissimum. By
observation, however, the species seems to be insect-pollinated (Matasyoh-Personal observation). There is also no information about its seed dispersal. As noted, the populations evaluated in this study exhibited some population differentiation though geographically isolated from each other. The geographical isolation of these populations may have
begun in the early 19th century with the colonisation by
settlers, who deforested the native habitats and became more intense when there was a reduction of natural forests to increase plantation areas intended for large-scale crop cultivation. Though it is unlikely that
forests with pioneer O. gratissimum populations were
continuous, the populations were probably geographically closer allowing gene flow between them. So the plants analysed in this study could have been remnants of the pioneer populations which were living when they were not yet isolated, or could be representative plants of only a few generations which have not accumulated significant mutations to allow very significant differentiation among the populations. It is also possible that the groupings or clustering observed in this study is as a result of long distance dispersal events and direct overland migrations facilitated by climate fluctuations [34].
On the other hand, the observed results could be due to the life history characteristics of the species which according to Refs. [31, 35] can affect the nature of genetic structuring of plant populations and also
genetic variation. By observation, O. gratissimum is a
long lived, perennial plant. In addition results from this study seem to indicate that the species is predominantly
out crossing. A positive association between these two characters and genetic variation has been established [31]. These characters allow a high within population diversity.
All this has important implications to genetic resource management and conservation of the species.
5. Conclusion
Results from this study suggest that the AFLP assay is appropriate for species which have a high amount of
secondary metabolites like O. gratissimum.
Partitioning of the total species genetic diversity revealed that overall, most of the variation resided
within O. gratissimum populations. This suggests that
sampling intensively within a few populations especially those that have a high genetic diversity (based on their level of heterozygosity) for conservation purposes would capture most of the genetic variation resident in the target populations.
Acknowledgment
The authors are thankful to the team in the molecular biology laboratory of the Tea Research Foundation of Kenya, BecA-International Livestock Research Institute and the Blin Foundation from Germany for the sponsorship.
References
[1] B.B. Dery, R. Otsyina, Indigenous knowledge and prioritization of medicinal trees for domestication in the Shinyanga region of Tanzania, in: A.B. Temu, G. Lund, R.E. Malimbwi (Eds.), Proceedings of a Workshop Held at Arusha, Tanzania in 1999, 2000, pp. 242-253.
[2] P. Wass, Kenya Indigenous Forests Status, Management and Conservation, IUCN, Cambridge, 1995.
[3] N.G. Njoroge, W.R. Bussmann, B. Gemmill, L.E. Newton, V.W. Ngumi, Utilisation of weed species as sources of traditional medicines in Central Kenya, Lyonia 7 (2004) 71-87.
[4] D.J. Mabberly, The plant book: A portable dictionary of the higher plants (second edition) useful, dictionary of genera and families of angiosperms, FREMONTIA 30 (2) (2002) 1-36.
![Fig. 1 Dendrogram based on Nei's [21] Genetic distance: Method = UPGMA, Modified from NEIGHBOR procedure of PHYLIP Version 3.5 from 6237 AFLP markers for 12 populations of O](https://thumb-ap.123doks.com/thumbv2/123dok/3955093.1898513/20.595.116.468.91.388/dendrogram-genetic-distance-modified-neighbor-procedure-version-populations.webp)