OPTIMIZATION OF PARAMETERS TO
IMPROVE SVM ACCURACY USING
HARMONY SEACRH ALGORITHM
Fronita H Girsang and Open Darnius
Abstract. This paper discusses the problem of classification of data by using the
Support Vector Machine (SVM) classification method. For classification of data with SVM required parameters capable of producing optimal performance for a clas-sification model so as to obtain better accuracy. For selection of parameter values that can produce good SVM performance. The proposed algorithm for parameter optimization in this paper is Harmony Search Algorithm (HSA).
1. INTRODUCTION
Data mining is a way of extracting information from a number of data typically stored in a repository using pattern recognition technology, statis-tics and mathematical techniques. The use of data mining HSA emerged to be applied in various fields, both from the academic field, business or medical activities in particular. In general, data mining is known by the process of extracting data [1].
Classifying data is one way to organize data, data that share the same characteristics or characteristics will be grouped into the same category. This can make it easier for people to search for information. Classification falls into the category of predictive data mining. In the classification process
Received 19-02-2017, Accepted 27-03-2017.
2016 Mathematics Subject Classification: 74P10, 03C45
Key words and Phrases: Duality, Fractional Multiobjective Program, Weir Type Duality.
is divided into two phases namely, learning and testing. In the learning phase, some data that HSA been known to the data class (training set) is used to form the model [2-4]. Furthermore, in the testing phase, the established model is tested with some other data (test set) to determine the accuracy of the model. If the accuracy is sufficient then the model can be used to predict the unknown data class. The increasing amount of data HSA encouraged the development of automatic classification methods that are capable of classifying as manual classification [5, 6, 21]. With this method, the benefits obtained are labor saving and good effectiveness.
From the difference of characteristics contained by each data gives its own challenge in doing the classification. A classification model is said to be good if it achieves the highest accuracy value and this model will be used to determine the final classification result. In addition, to create an optimal model also required a parameter value that is able to optimize the accuracy of a model.One of the most important classification methods currently considered is the Support Vector Machine (SVM) that can use for estimating Bank credit risk [8, 16] for examples. This classification method HSA been applied in several fields, such as in the introduction of the type of splice sites on the DNA line,Image retrieval system as well as in the case of DNA sequences using the Nelder-Mead method.
In this paper classification of data using the classification method of Support Vector Machine With parameter Optimization [9, 12]. For clas-sification of this data required parameters capable of producing optimal performance for a classification model. Thus, it takes an algorithm that is systematically able to determine the value of parameters to produce good performance.
2. PROBLEM STATEMENT
kernel rules. Margin is twice the distance between hyperplane and support vector. The point closest to the hyperplane is called the support vector.
Suppose the data is notified by xi ∈ Rn, for the class label of the xi
data denotedy∈ {+1,1}withi= 1,2, . . . , landlis lots of data. Separation of data linearly on the SVM method can be seen in figure.1.
Figure 1: Data are linearly separated
The example above shows that the two classes can be separated by a pair of parallel bounding plane. The first delimiter field limits the first class while the second delimiter field limits the second class, so that it is obtained:
xi.w+b≥+1 for yi= +1 (1)
xi.w+b≤ −1 for yi=−1 (2)
w = Vector weights that are perpendicular to the hyperplane (normal plane)
b = Position of the field relative to the coordinate center.
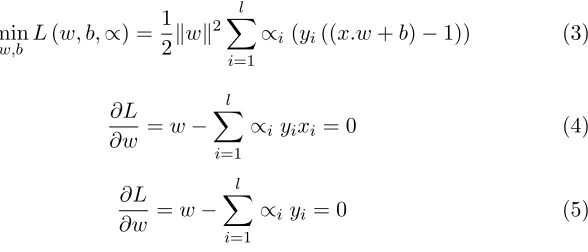
The margin value between the two classes is m = kw2k. Margin can be
maximized using Lagrangian optimization function as follows:
min
w,b L(w, b,∝) =
1 2kwk
2 l X
i=1
∝i (yi((x.w+b)−1)) (3)
∂L
∂w =w− l X
i=1
∝i yixi = 0 (4)
∂L
∂w =w− l X
i=1
The above equation can be modified as L maximization containing only αi as the equation below.
max vector while the rest have value αi = 0. After the ai value is found, then
the class from the test data xcan be determined based on the value of the decision function:
xi = Support vector
ns = Number of support vector
xd = Data to be classified.
If data can not be perfectly separated by linear separation, SVM is modified by adding variables ξi(ξi ≥ 0,∀I;ξi = 0 if xi correctly classified)
So the best divider search formula becomes:
min1
The search for the best splitter field with the addition ofξivariable is called
soft margin hyperplane. C is the parameter that determines the magnitude
of the penalty due to errors in the classification. Thus, the dual problem generated on non linear problem equals the dual problem generated by linear problem only the αi range between 0 =αi =C.
Figure 2: Soft margin hyperplane
Figure 3: The function Φ maps data to ahigher-dimensional vector space
mapped data in the new space of a higher dimension, ie ϕ(xi)ϕ(xd). Since generally this transformation ϕ(x) is unknown and very difficult to know, then dot product calculation can be replaced with Kernel function which is formulated as follows:
K(xi, xd) =ϕ(xi).ϕ(xd) (11)
So the above equation becomes as follows:
L=
i X
i=1 αi−
1 2
i X
i=1 i X
j=1
αiαjyiyiK(xi.αd) +b (12)
Thus the resulting function is:
f(xd) = N.S X
i=1
∝iyiK(xi.αd) +b (13)
xi=support vectorand NS is number ofsupport vector.
In this case γ, r, and d are kernel parameters, as well as parameter C as a penalty due to errors in the classification for each kernel. Some commonly used Kernel functions are:
2. Polynomial kernel
K(xi, x) = (γ.xTi .x+r)d, γ >0
3. Radial Basic Function K(xi, x) =exp(−γ|xi−x|2), γ >0
4. Sigmoid kernelK(xi, x) =tanh(γ.xTi .x+r)d, γ >0
3. COMPUTATIONAL ANALYSIS
This paper retrieves data from UCI Machine Learning that can be
downloaded at http://www.ics.uci.edu/∼mlearn/databases/ under the name
Statlog (Australian Credit Approval). Australia’s data credit is selected be-cause it belongs to the classification work in the field of finance that is widely used by researchers, with the amount of data and attributes that are not so great. So not too long in the process of execution.Data consists of 14 attributes with Categorical, Integer, and Real type. The amount of data is 690 lines. The data are classified into 2 classes, namely Positive (+) and Negative (-) classes. Class data + consists of 307 data or 44.5% of the total data, while the class data - consists of 383 data or as much as 55.5% of the overall data. Australian Credit Approval data does not have the value of a missing value attribute or a missing value label. So the missing value technique in pre-processing data is not done. The initial data processing done is to change the output data type from Integer type to Binomial type. This is done to clarify the work of an algorithm used, that the class output is binary (positive or negative), not a regression.
3.1 Optimization Parameter SVM
At this stage, the classification of Australian Credit Approval and SVM accuracy calculations by generating the values of parameters C, γ, r, and d automatically and randomly using the HAS algorithm.Project selection using HAS method with matlab program. The HAS parameters to be used in the test are HMS = 4; HMCR = 0.9; PAR = 0.3. Each data will be tested by the number of iterations 50, 100, 150 and 200.
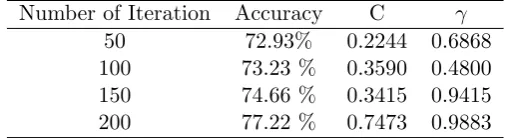
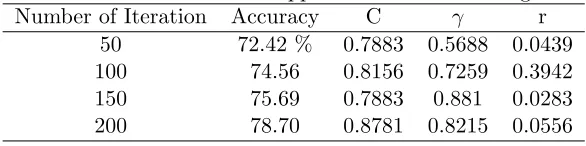
RBF the kernel yields an accuracy of 77.22% and parameters C and γ ob-tained for 0.7473 And 0.9883, while the result of execution with Sigmoid is optimum at 78.70% accuracy with parameter values C,γ, and r respectively 0.8781, 0.8215, and 0.0556. The increase in fitness value shown in Figure 1 and the best fitness for each kernel can be seen in Table 5.
Table 1: Optimized Australian Credit Approval data for Linear Kernel
Number of Iteration Optimal Accuracy Parameter C
50 80.85 % 0.7122
100 82.68 % 0.4937
150 83.53 % 0.2361
200 85.12 % 0.1503
Table 2: Optimized Australian Credit Approval data for Polynomial Kernel
Number of Iteration Accuracy C γ r d
50 73.95 % 0.5610 0.0146 0.4976 2
100 73.8719 0.7337 0.6751 0,2732 2
150 75.73 % 0.2956 0.6556 0.4976 2
200 81.76 % 0.0302 0.0146 0.5024 2
Table 3: Optimized Australian Credit Approval data forRBF Kernel
Number of Iteration Accuracy C γ
50 72.93% 0.2244 0.6868
100 73.23 % 0.3590 0.4800
150 74.66 % 0.3415 0.9415
200 77.22 % 0.7473 0.9883
Based on the results of searching the value of SVM parameter using HS algorithm, there is an increase of accuracy value on the data used. Table 5 shows the magnitude of the increase in accuracy value.
4. CONCLUSION
Table 4: Australian Credit Approval data for RBF Sigmoid
Number of Iteration Accuracy C γ r
50 72.42 % 0.7883 0.5688 0.0439
100 74.56 0.8156 0.7259 0.3942
150 75.69 0.7883 0.881 0.0283
200 78.70 0.8781 0.8215 0.0556
Figure 4: Best fitnessfor every generation of Australian CreditApprovaldata inLinear, Polynomial, RBF andSigmoid
Figure 5: Comparison of the accuracy value of each kernel
Table 5: Bestfitness Australian Credit Approvaldata forLinear, Polynomial, RBF dan Sigmoid
Kernel Best Fitnes enhancement
Linear 85.12% 5.29%
Polynomial 81.76% 8.68%
RBF 77.22% 5.89%
in accuracy. This means, increased accuracy in data classification. Table 5 shows the comparison of accuracy values that perform parameter opti-mization with the accuracy of the input of the specified parameter values. Comparison of this accuracy value, mapped in a graph, Figure 4. From the comparison results obtained accurate value indicates that the search value of SVM parameters using HS Algorithm produce greater accuracy value. This proves that the optimization of SVM parameters using HS Algorithm succeeds in achieving optimal accuracy.
The results showed that accurate value by searching the SVM param-eter values systematically using HS Algorithm resulted in a better accuracy value compared to the SVM execution accuracy value without optimization with the highest accuracy increase of 10.56%. Thus, HS Algorithm success-fully searches for SVM parameter values that optimize the accuracy value in the SVM classification method. This proves that HS Algorithm is effec-tive in increasing the accuracy value of a classification model in the SVM classification method.
References
[1] Larose, D. T. 2006. Data Mining Methods and Models. John Wiley & Sons, Inc. Hoboken.
[2] Geem, Z.W. dan Kim, J.H. (2001). A new heuristic optimization algo-rithm: harmonysearch.Simulation. Vol 76, No 2, 60-68.
[3] Yang, S.X. (2009). Harmony Search as AMetaheuristic Algorithm.
Springer, Verlag Berlin Heidelberg
[4] Sivasubramani, S. dan Swarup, K.S. (2011a). Multi-objective search
al-gorithm for optimal power flow problem. Electrical Power and Energy
System. Vol 33, No 3,745-752
[5] Sivasubramani, S. dan Swarup, K.S. (2011b). Environmental/economic dispatch usingmulti-objective harmony search algorithm.Electric Power Systems Research. Vol.81, No 9, 1778-1785
[7] Deb, K., Pratap A., Agarwal, S. dan Meyarivan T. (2002). A fast and elitist multiobjective genetic algorithm: NSGA-II.IEEE Transaction on Evolutionary Computation. Vol 6, No 2, 182-197
[8] Chiu, J.Y., Yan,Y., Xuedong, G. & Chen,R.C. 2010.A New Method for Estimating Bank Credit Risk.International Conference on Technologies and Applications of Artificial Intelligence. pp. 503 - 507. Taichung.
[9] Ilhan, I., & Tezel, G. 2013. A genetic algorithm-support vector machine method with parameter optimization for selecting the tag SNPs.Journal of Biomedical Informatics, 46(2), 32840.
[10] Li, X., Wang, L. & Sung, E. 2005. A Study of AdaBoost with SVM Based Weak Learners.Proceedings of International Joint Conference on Neural Networks. pp. 196-201. Montreal.
[11] Li, X., Wang, L. & Sung, E. 2008. AdaBoost with SVM-based compo-nent classifiers. Engineering Applications of Artificial Intelligence, vol. 21, pp. 785 - 795.
[12] Aydin, I., Karakose, M., & Akin, E. 2011. A multi-objective artificial immune algorithm for parameter optimization in support vector ma-chine. Applied Soft Computing, 11, 120129.
[13] Suganyadevi, M. V, & Babulal, C. K. 2014. Support Vector Regres-sion Model for the prediction of Loadability Margin of a Power System.
Applied Soft Computing Journal, 24, 304315.
[14] Wang, X., Wen, J., Zhang, Y. & Wang, Y. 2014. Optik Real estate price forecasting based on SVM optimized by PSO.Optik - International Journal for Light and Electron Optics, 125(3), 14391443.
[15] Wu, X., Kumar, V., Ross Quinlan, J., Ghosh, J., Yang, Q., Motoda, H., Steinberg, D. 2007. Top 10 algorithms in data mining. Knowledge and Information Systems (Vol. 14, pp. 137).
[16] Yu, H., Huang, X., Hu, X. and Cai, H. 2010. A Comparative Study on
Data Mining Algorithms for Individual Credit Risk Evaluation.
Inter-national Conference on Management of eCommerce and e-Government, Beijing, pp. 35 - 38.
systems reliability based on support vector regression with genetic algo-rithms. Reliability Engineering & System Safety, 92(4), 423432.
[18] Zhao, W., Tao, T. & Zio, E. 2015. System reliability prediction by support vector regression with analytic selection and genetic algorithm parameters selection.Applied Soft Computing, 30,792802.
[19] Sheng, W., Liu, K., Li, Y. dan Meng, X. (2014). Improved Multiob-jective Harmony Search Algorithm with Application to Placement and Sizing of Distribusi Genera-tion.Mathematical Problems in Engineering. Vol 2014, Article ID 871540, 1-8.
[20] Sivasubramani, S. dan Swarup, K.S. (2011a). Multi-objective search algorithm for optimal power flow problem.Electrical Power and Energy System. Vol 33, No 3, 745-752.
[21] Gu, J., Zhu, M., & Jiang, L. 2011. Housing price forecasting based
on genetic algorithm and support vector machine.Expert Systems with
Applications, 38(4), 33833386.
Fronita H. Girsang: Department of Mathematics, Universitas Sumatera Utara,
Medan 20155 -Indonesia.
E-mail: [email protected]
Open Darnius: Department of Mathematics, Universitas Sumatera Utara, Medan
20155 -Indonesia.