Defined Contribution Pension Plans: Sticky
or Discerning Money?
CLEMENS SIALM, LAURA T. STARKS, and HANJIANG ZHANG∗
ABSTRACT
Participants in defined contribution (DC) retirement plans rarely adjust their portfolio allocations, suggesting that their investment choices and consequent money flows are sticky and not discerning. However, participants’ inertia could be offset by DC plan sponsors, who adjust the plan’s investment options. We examine these countervailing influences on flows into U.S. mutual funds. We find that flows into funds from DC assets are more volatile and exhibit more performance sensitivity than non-DC flows, primarily due to adjustments to the investment options by the plan sponsors. Thus, DC retirement money is less sticky and more discerning than non-DC money.
MUTUAL FUND HOLDINGSin employer-sponsored defined contribution (DC) plans
are an important and growing segment of today’s financial markets. Assets in DC plans increased from $1.7 trillion in 1995 to $5.9 trillion in 2013. Further, at the end of this period, DC plans constituted 23% of total U.S. mutual fund assets and 27% of U.S. equity fund assets.1 Such holdings are expected to
∗Clemens Sialm is at the University of Texas at Austin and the NBER, Laura Starks is at the University of Texas at Austin; and Hanjiang Zhang is at the Nanyang Technological University Singapore. We thank Susan Christoffersen, Zhi Da, Magnus Dahlquist, Steve Dimmock, Nancy Eckl, Michael Halling, Campbell Harvey (the Editor), Jennifer Huang, David Musto, Veronika Pool, Jim Poterba, Jonathan Reuter, John Simon, Mikhail Simutin, Irina Stefanescu, Marno Verbeek, an Associate Editor, two referees, conference participants at the 2012 SIFR Conference on Mutual Funds in Stockholm, the 2013 Asian Bureau of Finance and Economic Research Conference in Singapore, the 2013 China International Conference in Finance in Shanghai, the 2013 Conference on Professional Asset Management at the Rotterdam School of Management, the 2014 Society for Financial Studies Cavalcade at Georgetown University, the 2014 Western Finance Association in Monterey, and seminar participants at Georgia State University, Hanken School of Economics, the Helsinki School of Economics at Aalto, New York University, Stanford University, Tilburg University, the University of Oklahoma, the University of Texas at Austin, the University of Texas at Dallas, and the University of Virginia for helpful comments. We thank Veronika Pool and Irina Stefanescu for sharing their Form 11-K data with us. The authors thank Tania Davila for research assistance. We thank the sponsors of the Kepos Capital Award for the Best Paper in Investments at the 2014 WFA meeting. Clemens Sialm thanks the Stanford Institute for Economic Policy Research for financial support during his sabbatical. Hanjiang Zhang thanks REGA Capital Management for providing a research grant for this project. Laura Starks is a trustee of mutual funds and variable annuities offered by a retirement service provider. She has also previously consulted for mutual fund management companies and 401(k) plan sponsors.
12014Investment Company Fact Bookand Investment Company Institute Report on the “U.S.
Retirement Market, First Quarter 2014.”
DOI: 10.1111/jofi.12232
remain important with the increasing number of Americans moving toward retirement and with the transition of corporations and public entities toward the use of DC plans rather than defined benefit (DB) plans.
Despite the prevalence of mutual fund holdings in employer-sponsored re-tirement accounts, little is known about the effects of DC plan sponsors (i.e., employers) and participants (i.e., employees) on mutual fund flows. Our paper analyzes the behavior of these sponsors and participants and asks whether DC pension plan investments constitute a source of sticky or discerning money for mutual funds. Conventional wisdom, based on previous studies of DC plan par-ticipants’ behavior, suggests that the DC plan assets in mutual funds should be sticky and not discerning.2However, decisions regarding the composition of DC
plan menus are made by DC plan sponsors, who might frequently delete funds with poor prior performance and add funds with superior prior performance. Which of these influences has a greater effect on fund flows is an empirical question, which we address in this paper. We further consider the implications of these influences for both plan participants and the mutual fund industry.
Although investors who own mutual funds directly can choose among the universe of mutual funds, participants in employer-sponsored DC plans typi-cally have limited choices.3 These choices arise through a two-stage process.
In the first stage, plan sponsors select the DC plan menus and adjust the in-vestment options over time by removing or adding options. In the second stage, employees allocate their individual DC account balances among the choices made available to them by the plan sponsors.
This two-stage process contributes to different investor behavior patterns for DC plan investors versus ordinary mutual fund investors. We therefore expect the fund flows from DC plans to behave differently from flows from non-DC sources. On the one hand, DC plan participants make periodic retire-ment account contributions and withdrawals, which are persistent over time. In addition, they may evaluate their present and prospective fund holdings dif-ferently from non-DC fund investors due to longer investment horizons and a different tax status.4These factors may explain the documented inertia by DC
plan participants in the previous literature whereby retirement savers have a tendency to rebalance and trade infrequently and to follow default options. This inertia in DC plan participants’ investment decisions leads to the com-monly held belief that retirement money flows should have low volatility, high autocorrelation, and low sensitivity to prior fund performance.
2See, for example, Benartzi and Thaler (2001), Madrian and Shea (2001), Choi et al. (2002),
Agnew, Balduzzi, and Sunden (2003), Duflo and Saez (2003), Huberman and Jiang (2006), Carroll et al. (2009), and Dahlquist and Martinez (2013). In contrast, evidence suggests that individual investors exhibit relatively high turnover in their traditional (directly held) brokerage accounts (e.g., Barber and Odean (2000), Grinblatt and Keloharju (2001), and Ivkovi´c and Weisbenner (2009)).
3For example, a Deloitte (2011) survey of DC plan sponsors finds that the median DC plan
includes 16 investment options.
4The tax on income to investments in DC plans is deferred until the income is distributed. See
On the other hand, the infrequent trading by individual plan participants could be offset by plan sponsors’ adjustments to plan menus—to satisfy their fiduciary responsibilities, plan sponsors monitor the available investment op-tions5and may replace poorly performing funds with investment options that
exhibit superior prior performance.6Thus, rather than being sticky, DC money
could actually act as an important disciplining mechanism for fund managers, resulting in money flows that have higher volatility, lower autocorrelation, and higher flow-performance sensitivity.
To test these competing influences regarding the effects of DC plans on mu-tual fund flows, we compare the flows of DC and non-DC mumu-tual fund investors from 1997 to 2010. We find that money flows into mutual funds by DC plan participants are more volatile and exhibit a lower serial correlation than the flows into mutual funds by other investors. Thus, DC asset flows tend to be less sticky than non-DC flows.
Furthermore, our empirical results show that DC flows are more sensitive to prior fund performance than non-DC flows. In fact, the flow-performance sensitivity of DC flows is particularly pronounced for the funds in the lowest and highest performance quintiles. Using the piecewise linear specification of Sirri and Tufano (1998), we find that a 10 percentile deterioration in prior-year performance for a bottom quintile mutual fund generates outflows of 11.9% by DC investors compared to only 3.3% by non-DC investors. In contrast, a 10 percentile improvement in prior-year performance for a top quintile mutual fund generates inflows of 17.8% by DC investors and only 4.9% by non-DC investors. Thus, contrary to the widely held conventional wisdom, we find that DC money is actually more sensitive to prior performance than non-DC money. These results suggest that plan sponsors counteract the previously docu-mented inertia of DC participants. To test the follow-on hypothesis that the high flow-performance sensitivity of DC funds is driven by the actions of the plan sponsor, we use data on a sample of 401(k) plans that have 11-K filings with the U.S. Securities and Exchange Commission (SEC). These data allow us to decompose flows following Pool, Sialm, and Stefanescu (2013) into flows re-sulting primarily from plan sponsor actions and flows rere-sulting primarily from participant actions. We find that our flow results are predominantly driven by the actions of the plan sponsors, and, consistent with previous research, we confirm that the plan participants themselves exhibit inertia and do not react sensitively to prior fund performance.
5See the U.S. Department of Labor’s Employee Benefits Services Administration
website for information on fiduciary obligations in DC plans: http://www.dol.gov/ebsa/ publications/fiduciaryresponsibility.html. Over the last decade there have been numerous lawsuits filed against plan sponsors and service providers. Most of these lawsuits al-lege that the plans are charging excessive or hidden fees; however, the complaints have also included allegations of improper monitoring of options. See http://online.wsj.com/article/ SB10001424052970204777904576651133452868572.html.
6In 2011, 43% of plan sponsors responding to a Deloitte (2011) survey of DC plans stated that
To investigate whether DC fund flows are more discerning than non-DC flows, we examine whether mutual fund flows from DC and non-DC investors can predict funds’ long-term future return performance. Berk and Green (2004) present a model with decreasing returns to scale in fund management where fund flows rationally respond to past performance. Their model implies that fund flows do not predict future fund performance. For DC flows, consistent with the Berk and Green hypothesis, we find no significant predictability for future performance. In contrast, we find that non-DC flows predict longer-term performance negatively. Overall, our results indicate that DC money is less sticky and more discerning than non-DC money.
Del Guercio and Tkac (2002), Heisler et al. (2007), and Goyal and Wahal (2008) provide important evidence regarding the effects of DB pension plan sponsors on retirement money flows. This evidence does not necessarily gener-alize to the effects of DC plan sponsors and participants on mutual fund flows for several reasons.7First, DB plans and DC plans exhibit very different asset
allocations and the investment risks are borne by different market partici-pants. In a DB plan the plan sponsors make the portfolio allocation decisions and the investment risks are borne primarily by the plan sponsors, whereas in a DC plan the allocation decisions are made by the individual participants from options selected by the plan sponsors and the investment risks are borne by the participants. Thus, DC asset allocations are the result of a joint decision made by the actions of the plan participants and the plan sponsors.8
Second, DC plan sponsors need to consider the attractiveness and appro-priateness of different investment options for their participants. The ultimate allocations of DB plans depend on the choices of the DB plan sponsors whereas the ultimate allocations of DC plans depend on the two-stage process described above, that is, the menu choices of the DC plan sponsors and the selections of the individual plan participants. Thus, the aggregate plan allocations of DB and DC plans would be expected to differ substantially.9
7Papers on the design of DC pension plans include Lakonishok, Shleifer, and Vishny (1992),
Benartzi and Thaler (2001), Madrian and Shea (2001), Choi et al. (2002,2006), Agnew, Balduzzi, and Sunden (2003), Duflo and Saez (2003), Brown, Liang, and Weisbenner (2007), Davis and Kim (2007), Elton, Gruber, and Blake (2006,2007), Huberman and Jiang (2006), Rauh (2006), Goyal and Wahal (2008), Carroll et al. (2009), Cohen and Schmidt (2009), Stewart et al. (2009), Tang et al. (2010), Brown and Harlow (2012), Balduzzi and Reuter (2013), Pool, Sialm, and Stefanescu (2013), Christoffersen and Simutin (2014), and Rydqvist, Strebulaev, and Spizman (2014).
8Further, as pointed out by Heisler et al. (2007), in a DB plan the sponsors may frequently
rebalance their asset allocations. This rebalancing will affect investor manager flows in a DB plan. In contrast, in our setting the participants of a DC plan have control over their asset allocation. Thus, the type of rebalancing suggested by these authors would only occur if the participants made the choice, not the plan sponsor.
9McFarland (2013) reports that the asset allocations for select Fortune 1000 companies differ
Third, whereas DC plans typically include mutual fund investment options, DB plans generally invest lower proportions in mutual funds. As a result, we do not have evidence on the flow-performance sensitivity of employer-sponsored retirement plan investments in mutual funds but we have no reason to believe they would follow the patterns documented for DB plans.
Finally, in the United States, DC plans have become a more important retire-ment vehicle than DB plans. According to the Employee Benefit Research Insti-tute and the Bureau of Labor Statistics, the percentage of full-time employees at medium and large private establishments who participated in DB and DC plans in 1993 equaled 56% and 49%, respectively. By 2012, the percentage of DB participation of employees at medium and large private establishments de-clined to 28%, whereas the participation in DC plans increased to 54%.10Thus,
as DC plans have increased in prominence relative to DB plans, it has become more important to analyze the behavior of DC plan sponsors and participants as well as their effects on the mutual fund industry.
Having a better understanding of the impact of DC plans on fund flows and their sensitivity to fund performance is important for several reasons. First, fund flows can affect the resource allocation of capital markets through their effects on asset prices. They can thus influence which sectors and compa-nies obtain financial resources.11Second, performance-based compensation in
the mutual fund industry occurs primarily through fund flows. That is, high-performing funds obtain more assets and receive higher remuneration, since management fees are typically a fixed percentage of assets. It is important to understand the determinants of fund flows since portfolio managers are incen-tivized primarily through fund flows.12Finally, fund flows exert externalities
on the remaining fund investors. For example, fund flows can require fund managers to adjust their portfolios, incur trading and tax costs, and change their investment strategies.13
The remainder of this paper is organized as follows. SectionIdescribes the data sources and provides summary statistics. SectionII compares the stan-dard deviations and autocorrelations of fund flows in DC and non-DC environ-ments. SectionIIIanalyzes the flow-performance relation for DC and non-DC fund assets. Section IV contrasts the impact of plan sponsors and plan par-ticipants on the flow-performance relation of DC assets. SectionVstudies the performance predictability of DC and non-DC fund flows. Finally, SectionVI
concludes.
10The 1993 data are available athttp://www.bls.gov/ncs/ebs/sp/ebbl0024.pdfand the 2012 data
are available athttp://www.bls.gov/ncs/ebs/benefits/2012/ownership/private/table02a.pdf.
11See, for example, Wermers (2003), Coval and Stafford (2007), and Lou (2012).
12See, for example, Brown, Harlow and Starks (1996), Chevalier and Ellison (1997), Sirri and
Tufano (1998), Del Guercio and Tkac (2002,2008), Berk and Green (2004), Huang, Wei, and Yan (2007,2012), Ivkovich and Weisbenner (2009), and Del Guercio and Reuter (2014).
13See, for example, Barclay, Pearson, and Weisbach (1998), Edelen (1999), Khorana and Servaes
I. Data
A. Data Sources
We employ several different data sources for our analysis. First, we obtain data from annual surveys of mutual fund management companies conducted by
Pensions & Investmentsover the 1997 to 2010 time period.14In these surveys
companies are asked to report the dollar amount of mutual fund assets held in DC retirement accounts (as of December 31stof the year prior to the survey
date) for the mutual funds most used by DC plans.15 Mutual fund families
are asked to report the DC plan assets for the 12 funds with the largest DC assets in each of several broad investment categories (Domestic Equity Funds, Domestic Fixed Income Funds, International Equity Funds, Balanced Funds, Money Market Funds). We focus on domestic equity funds because they are the most commonly used mutual funds in DC plans over our sample period and because doing so allows us to abstract from changes in asset classes across the plans.16
Second, we obtain data from the CRSP Survivorship Bias Free Mutual Fund database, which contains information on mutual fund characteristics such as fund returns, total assets under management, fees, and investment objectives. To avoid the incubation bias described by Evans (2010), we exclude funds which in the previous month managed less than $5 million, funds with missing fund names in the CRSP database, and funds for which the year for the observation is the same year or earlier than the reported fund starting year. For funds with multiple share classes, we combine the classes into one observation per fund and compute the fund-level variables by aggregating across the different share classes. We merge the CRSP data with the survey data using the funds’ ticker symbols and names. We also merge the CRSP database with the Thomson Fi-nancial CDA/Spectrum holdings database and the CRSP stock price database using the MFLINKS file based on Wermers (2000) and available through Whar-ton Research Data Services (WRDS).
To shed light on the generalizability of our analysis, we compare the domestic equity funds listed in the Pensions & Investmentsdata set to those included
14We thank David Klein fromPensions & Investmentsfor providing us the survey data.
Addi-tional information about the survey can be obtained from the website athttp://www.pionline.com. Earlier surveys from the same data source have been used previously by Christoffersen et al. (2006) and Sialm and Starks (2012). In a contemporaneous paper Christoffersen and Simutin (2014) investigate the risk-taking incentives of mutual funds with different investor clienteles.
15The sample includes 401(k), 403(b), 457, profit sharing, and other DC plan assets. This
specifically excludes other tax qualified investment vehicles that could be held in mutual funds such as Individual Retirement Accounts (IRAs), Keoghs, and SARSEPs. The sample also does not include other retirement assets under administration by the fund family such as sponsoring company stock.
16Specifically, we eliminate balanced, bond, international, and money market funds, as well as
in the CRSP database. We find that thePensions & Investmentsdata set has wide coverage—the fund families in our sample control over 77% of the total value of equity funds included in CRSP. In addition, although we do not have the level of DC assets for all funds in families that have many mutual funds, the information on the level of assets that we do have indicates that the excluded funds tend to have relatively low DC assets. In particular, the funds in our database (with noncensored DC assets) account for 85% of the total equity assets of the surveyed fund families.
Our final data set comes from plan sponsors’ required annual Form 11-K filings with the SEC.17These filings are only required when an employer offers
company stock as part of its DC plan. Included on the Form 11-K are the asset values in each of the plan’s investment options along with the name of the mutual fund or other plan provider. This data set allows us to decompose the fund flows from the plan into flows driven primarily by the actions of plan sponsors and flows driven primarily by plan participants.
B. Flow Definitions
Using thePensions & Investments data, we divide the flows into DC flows and non-DC flows as follows:
DC Flowf,t=
DC Assetsf,t−DC Assetsf,t−11+Rf,t
DC Assetsf,t−11+Rf,t
, (1)
NonDC Flowf,t=
NonDC Assetsf,t−NonDC Assetsf,t−11+Rf,t
NonDC Assetsf,t−11+Rf,t
, (2)
whereDC Flowf,tdenotes the DC flows to fundfin yeartbased on the difference
between the end-of-year DC assets in the fund less the product of the beginning-of-year DC assets and one plus the fund’s return in that year. The denominator ensures that the fund flows never fall below –100%. We defineNonDC Flowf,t
analogously, where NonDC Assetsf,t is fundf ’s total assets at timetless the
fund’s DC assets at timetadjusted for the fund returns.
The 11-K data give us the assets of planpinvested in mutual fundfat timet
(Assetsp,f,t). We aggregate across all plans invested in fundfat timestandt−1.
That is, to obtain the plan flow of fundfat timetusing the 11-K data, we sum the estimated dollar flows across all plans that offer the fund and divide this aggregate flow by the aggregate initial plan value adjusted for the fund return. We only compute the plan flow for a fund if at least one 401(k) plan in the 11-K
17We thank Veronika Pool and Irina Stefanescu for providing us the data. Additional
data offers that specific mutual fund in the prior year. More specifically, we compute
Plan Flowf,t=
p
Assetsp,f,t− p
Assetsp,f,t−11+Rf,t
p
Assetsp,f,t−11+Rf,t
. (3)
Although we cannot observe the individual allocation decisions of plan par-ticipants and sponsors, we do observe whether a new investment option is included in a plan or whether an old option is excluded by comparing the asset allocations from one year to the next. Since the plan sponsor determines the changes in the menu, we term the flows due to fund additions and deletions as
Plan Sponsor Flow, which we compute according to
Plan Sponsor Flowf,t=
p∈Additions
Assetsp,f,t− p∈Deletions
Assetsp,f,t−11+Rf,t
p
Assetsp,f,t−11+Rf,t
.
(4)
The residual flows are termedPlan Participant Flows,because plan partici-pants can generally allocate their retirement funds freely between the various investment options provided in the plan’s menu:18
Plan Participant Flowf,t=Plan Flowf,t−Plan Sponsor Flowf,t. (5)
C. Summary Statistics
Our primary sample of merged data from the CRSP andPensions & Invest-mentsdatabases covers 1,078 distinct equity funds and 5,808 fund-year obser-vations over the period 1996 and 2009. Panel A of TableIreports the summary statistics. The equal-weighted mean of the proportion of assets in the mutual funds held in DC plans is 25.4%. This ratio is 8.5% for the first quartile and rises to 35.5% for the third quartile. However, some large actively managed funds have very high DC ratios. For example, in 2010, Fidelity’s Contrafund had a DC ratio of 65.9%, Vanguard’s Primecap Fund had a DC ratio of 53.4%,
18Plan sponsors might also influence the residualPlan Participant Flowsdue to incremental
Table I
Summary Statistics
This table provides summary statistics for the sample of mutual funds over the 1996 to 2009 period. DC ratio is the percentage of fund assets held by DC accounts at the end of the year. Fund size (total net assets), family size, age, expenses, turnover, and fund returns are obtained from the CRSP mutual fund database. Annual DC flow is the percentage flow of DC assets based on the annual surveys byPensions & Investments, and annual non-DC flow is the percentage flow based on the difference between total net assets and DC assets. Annual plan, plan sponsor, and plan participant flows are based on annual Form 11-K filings by corporate DC plans.
Panel A: Variable Distributions
Name Mean Std. Dev. Quartile 1 Median Quartile 3
DC Ratio (in % of Fund Size) 25.38 22.00 8.50 19.85 35.52
Fund Size (in M$) 3,931 10,289 269 967 3,122
Family Size (in M$) 57,242 113,605 5,746 14,594 41,176
Age (in Years) 16.33 15.46 7.00 11.00 19.00
Expense Ratio (in % per Year) 1.16 0.45 0.90 1.16 1.42
Turnover (in % per Year) 78.26 82.60 30.51 61.00 103.00 Fund Returns (in % per Year) 6.76 24.96 −9.06 9.59 21.87 DC Flow (in % per Year) 32.00 119.34 −20.78 −0.23 32.76 Non-DC Flow (in % per Year) 6.65 44.37 −16.14 −3.96 14.06
Plan Flow (% per Year) 22.27 84.76 −15.86 3.56 36.85
Plan Sponsor Flow (% per Year) 9.68 74.12 −12.27 0.00 7.30 Plan Participant Flow (% per Year) 12.59 25.88 −1.85 3.35 17.35 Number of Observations 5,808
Panel B: Correlations
Variable (1) (2) (3) (4) (5) (6) (7) (8) (9) (10) (11)
(1) DC Ratio 1.00
(2) Fund Size 0.12 1.00
(3) Family Size 0.26 0.54 1.00
(4) Age −0.11 0.29 0.18 1.00
(5) Expense Ratio −0.32 −0.29 −0.35 −0.13 1.00 (6) Turnover −0.10 −0.08 −0.07 −0.02 0.15 1.00 (7) Fund Return 0.00 0.01 0.02 −0.01 0.00 −0.01 1.00 (8) DC Flow −0.02 −0.07 −0.08 −0.13 0.10 0.01 0.03 1.00 (9) Non-DC Flow −0.07 −0.04 −0.02 −0.15 0.00 0.03 0.06 0.23 1.00 (10) Plan Flow −0.03 −0.03 −0.03 −0.09 0.02 0.03 0.02 0.26 0.26 1.00 (11) Plan Sponsor Flow −0.02 −0.01 −0.01 −0.07 0.00 0.03 0.01 0.22 0.23 0.95 1.00 (12) Plan Participant Flow −0.05 −0.07 −0.07 −0.12 0.08 0.03 0.05 0.21 0.19 0.54 0.26
and American Fund’s Growth Fund of America had a DC ratio of 42.5%. TableI
To reduce the impact of outliers, we winsorize the extreme fund flows at the 2.5% level. TableIshows that the annual growth in DC assets for the average fund in our sample has been much larger than the annual growth in non-DC assets at 32.0% compared to 6.7%. Part of this difference is due to the fact that DC assets start on average from a smaller base.
The data from the annual Form 11-K filings indicate that this sample’s 401(k) plans include on average 9.8 equity mutual funds over the 1999 to 2009 period. The average number of equity mutual fund options has increased from 5.9 in 1999 to 12.2 in 2009. The 11-K filings indicate that plan sponsors adjust their investment menus frequently. On average, plans delete 1.2 domestic equity fund options and include 1.9 new domestic equity fund options every year. Table I shows that plan flows into the mutual funds on the menu average around 22.3% with a median of 3.6%, indicating that a substantial proportion of flows concentrate on a relatively small number of funds. Dividing these flows between sponsors and participants shows that sponsor decisions result in an average annual inflow of 9.7% and plan participants’ actions lead to an average annual flow of 12.6%. The standard deviation of plan sponsor flows is around three times higher than the standard deviation of plan participant flows, indicating that most fund flows in 401(k) plans are caused by the addition and deletion decisions of plan sponsors.
Panel B of TableIsummarizes the correlations between the key variables. While the DC ratio for a fund is positively correlated with fund and family size, it is negatively correlated with fund age, expense ratio, and fund turnover. Thus, DC plans tend to focus on large but relatively younger mutual funds with lower expense ratios and lower portfolio turnover. Finally, the various flow measures are all positively correlated, suggesting that the flows of different market participants follow similar signals.
II. Standard Deviation and Autocorrelation of Fund Flows
The documented inertia of DC plan participants leads to the commonly held belief that DC flows into mutual funds should have lower volatility than other investor flows. Moreover, given the stability of contributions and with-drawals into DC plan retirement accounts over time, one would also expect a higher autocorrelation of flows from DC plans than from non-DC plans. TableI, however, provides preliminary evidence against these hypotheses in that DC flows tend to be substantially more volatile than non-DC flows. Since plan sponsors and participants can reallocate their DC assets across different mu-tual funds, their actions could create more volatile flows for funds with high DC assets. The tests in this section are designed to evaluate these alternative hypotheses in more detail.
Table II
Relation between Flow Variability and Fund Characteristics
This table summarizes a regression of moments of flows on fund characteristics. The dependent variables are the standard deviation and the autocorrelation of the annual DC and non-DC flows over the lifetime of a fund, requiring that funds have at least five annual observations. The independent variables include an indicator variable for DC or DC flows, the initial DC or non-DC size, and other initial fund characteristics. All continuous independent variables are demeaned. Standard errors are reported in parentheses.*,**, and***denote estimates that are statistically
different from zero at the 10%, 5%, and 1% significance levels.
Standard Deviation of Flow Autocorrelation of Flow
Constant 0.332*** 0.549*** 0.439*** 0.093*** 0.080*** 0.063*
(0.012) (0.023) (0.018) (0.023) (0.029) (0.036) DC Indicator 0.522*** 0.212*** 0.310*** −0.138*** −0.127*** −0.114***
(0.033) (0.031) (0.031) (0.026) (0.034) (0.041)
Log Size −0.163*** −0.077*** 0.005 0.018
(0.014) (0.009) (0.011) (0.019)
Log Family Size 0.035*** 0.021*** 0.027* 0.014
(0.012) (0.008) (0.014) (0.017)
Log Age 0.033 −0.039*** −0.026 −0.023
(0.026) (0.015) (0.022) (0.033)
Expense Ratio 1.071** 0.290 −0.471 −0.252
(0.460) (0.261) (0.501) (0.656)
Turnover −0.006 0.015 0.029*** 0.011
(0.014) (0.010) (0.011) (0.016)
DC x Log Size −0.117*** −0.020
(0.018) (0.021)
DC x Log Family Size 0.005 0.026
(0.018) (0.019)
DC x Log Age 0.091** −0.012
(0.040) (0.038)
DC x Expense Ratio 1.338* −0.532
(0.785) (0.875)
DC x Turnover −0.038** 0.036
(0.019) (0.024)
Observations 1,032 987 987 1,032 987 987
R2 0.162 0.390 0.420 0.018 0.030 0.035
our sample.19 In the regressions we pool the DC and non-DC flows together
and regress the moments against an indicator variable for DC investor flows along with control variables evaluated at the beginning of the respective time periods. We report the results in Table II. In the first and fourth columns of the table, the indicator variable is the sole independent variable. In the second and fifth columns we add control variables for fund characteristics, such as the logarithm of fund size, the logarithm of family size, the logarithm of fund age, the expense ratio, and portfolio turnover. The continuous control variables are
19For this part of the analysis, to compute these moments we require that funds have at least
demeaned so we can interpret the constant as the fitted moment for non-DC funds evaluated at the means of the control variables. Finally, in the third and sixth columns we also include interaction effects between the DC indicator variable and the demeaned control variables.
Regardless of the specification, we find significant differences in the behavior of the DC flows as compared to the other flows. First, the standard deviation of DC flows exceeds the corresponding moment of non-DC flows. For example, the standard deviation of annual DC flows exceeds the standard deviation of non-DC flows by between 21.2% and 52.2% per year depending on whether we adjust for other fund characteristics. After adjusting for fund characteristics, the difference in standard deviations is reduced, but still highly significant. The reason for the reduction is primarily due to the fact that the level of DC assets in a fund tends to be smaller than the level of non-DC assets. Second, we find that the autocorrelation of DC flows is significantly lower than that for non-DC flows in all specifications. These results support the hypothesis that DC flows are not stickier than non-DC flows. In fact, counter to conventional wisdom, the DC flows are actually significantly more volatile and less autocorrelated than non-DC flows. These results support the hypothesis that DC plans have significant effects on the mutual funds in which their assets are invested. We explore the extent of these effects in more detail in the following section.
III. Flow-Performance Relation for DC and Non-DC Assets
We next test hypotheses regarding the flow-performance sensitivity of DC versus non-DC assets by examining the percentage flows by DC and non-DC assets separately. We posit that the flow-performance sensitivity in the two en-vironments could differ because the actions of plan sponsors and participants could be different from those of direct mutual fund investors. These differences can be explained by two alternative hypotheses. The first hypothesis states that a lower flow-performance sensitivity for DC assets would be expected if plan sponsors and their participants exhibit inertia by not changing their DC account portfolio allocations as frequently as non-DC investors in directly held mutual fund accounts. The second hypothesis considers the possibility that DC plan sponsors or participants actively adjust their plan choices based on prior fund performance. In this case, DC assets would exhibit more flow-performance sensitivity.20Moreover, heightened sensitivity would be expected
under both low and high performance if it were due to the plan sponsor replacement process. That is, when plan sponsors adjust their investment option menus by moving participants’ assets from a poorly performing fund to a replacement fund, this should induce flow-performance sensitivity in the lower performance range. Further, since the plan sponsors’ replacement process typically restricts the replacement fund to a set of better-performing funds in
20Plan sponsors and participants may behave differently in such situations. We expect the
the same investment objective group as the previous fund, this process should also induce flow-performance sensitivity in the higher performance range.
A. Estimation Method
In this section we compare the flow-performance relation for DC and non-DC assets. For each fund in our sample we employ the Pensions & Investments
data to identify DC and non-DC assets and compute the annual percentage flows (growth rates) of DC and non-DC assets according to equations (1)and
(2).
To capture the flow-performance sensitivity, we relate the annual flows to the relative fund performance rank (Rank) over the prior year while controlling for other lagged fund characteristics, such as the logarithms of total DC and non-DC assets (DC Size and NonDC Size), the logarithm of family total net assets (Fam Size), the logarithm of the amount of time since fund initiation (Age), the lagged expense ratio (Exp), the lagged annual turnover of the fund (Turn), the monthly return volatility over the prior year (Vol), the average contemporaneous flow of funds in the same style category(SFlow), and year fixed effects (β):
Flowf,t = fRankf,t−1+β1DC Sizef,t−1+β2NonDC Sizef,t−1
+β3Fam Sizef,t−1+β4Agef,t−1+β5Expf,t−1+β6Turnf,t−1
+β7Volf,t−1+ β8SFlowf,t+βt+εf,t. (6)
We define the fund performance measure Rankf,t as the percentile
perfor-mance rank a particular fundfobtains across all equity funds in the sample during a specific performance evaluation period. Funds in the worst perfor-mance percentile obtain a rank of 0.01 and funds in the best perforperfor-mance percentile obtain a rank of 1.00.21
To capture nonlinearities in the flow-performance relation, we use two dif-ferent functional forms forf(Rankf,t). The first nonparametric functional form
simply estimates separate effects for each percentile:
f1Rankf,t
= 100
j=1
γjI
100×Rankf,t= j
, (7)
where I(100×Rank=j) is an indicator variable that equals one if the perfor-mance rank of a specific fund falls in thejthpercentile and zero otherwise. The
coefficientγjcaptures the average flow of funds in thejthpercentile if all other
covariates of equation(4) are equal to zero. In this specification we estimate 100 different performance-sensitivity coefficientsγ.
21We also present robustness tests in which the performance rank is computed within objective
-0.4 -0.2 0 0.2 0.4 0.6 0.8 1
0 0.2 0.4 0.6 0.8 1
Fund Flo
w
Performance Rank DC Flow Non-DC Flow
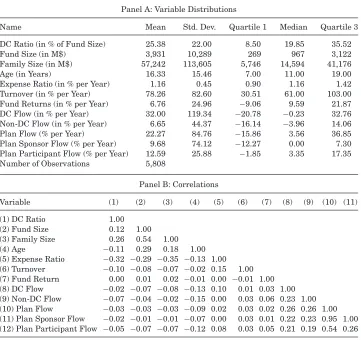
Figure 1. Flow-performance relation for percentile performance portfolios of DC and non-DC assets.This figure shows the flow-performance relation for DC and non-DC assets. The dots represent the average flows for 100 performance groups, where the remaining covariates are evaluated at their sample means. Diamonds correspond to DC flows and circles correspond to non-DC flows. The solid curves show the least-squares cubic relations.
A second functional form follows Sirri and Tufano (1998) and estimates a piecewise linear specification:
f2Rankf,t=γLLowf,t+γMMidf,t+γHHighf,t, (8)
whereLowf,t=min(Rankf,t, 0.2),Midf,t=min(Rankf,t–Lowf,t, 0.6), andHighf,t =(Rankf,t–Lowf,t–Midf,t). The performance coefficientsγL,γM, andγHcapture
the marginal flow-performance sensitivities in the bottom quintile, in the three middle quintiles, and in the top quintile, respectively. For example, a fund in the 15thpercentile would experience flows of 0.15×γ
Lif all the other covariates
were equal to zero. On the other hand, a fund in the 85th percentile would
experience flows of 0.2×γL + 0.6×γM + 0.05×γH if all the other covariates
were zero. This specification estimates a continuous piecewise linear function.
B. Percentile Flows
and non-DC environments, for each fund we calculate two asset growth rates corresponding to DC assets and non-DC assets. Thus, the fund composition of the various performance rank percentiles between DC and non-DC portfolios are identical and the flow differences between DC and non-DC assets cannot be explained by differences in fund characteristics.
We observe that DC assets on average experience larger fund flows than non-DC assets due to the significant growth of tax-qualified retirement accounts over our sample period. Funds with performance ranks in the middle 10% (i.e., funds with performance ranks between the 46th and 55th percentiles)
experience inflows of 23.7% for DC assets and 2.1% for non-DC assets.
Whereas the flow-performance relation is close to linear for non-DC assets, the relation is clearly nonlinear for DC assets. Further, the flow-performance relation is particularly steep for DC assets corresponding to funds in the top and bottom performance groups. For example, funds in the bottom decile of performance experience an average outflow of 8.3% of their DC assets and funds in the top decile experience an average inflow of 53.6% of their DC assets. On the other hand, funds in the bottom decile experience an average outflow of 11.8% of their non-DC assets and funds in the top decile experience an average inflow of 17.9% of their non-DC assets. Although bottom decile funds experience similar DC and non-DC flows, the low growth of DC assets of poorly performing funds is meaningful given the substantial growth of DC assets over our sample period.22
C. Piecewise Linear Specification
The nonparametric flow-performance relation from Figure 1 justifies the piecewise linear specification suggested by Sirri and Tufano (1998), who estimate different flow-performance sensitivities for the top and bottom performance quintiles. The results of these alternative panel regressions are summarized in Table III. The first three columns are based on the fund performance over the prior year, whereas the last three columns are based on fund performance over the prior five years. For each horizon, we report the coefficient estimates for DC and non-DC percentage flows and the coefficient estimates for a regression in which the dependent variables equal the difference between the DC and the non-DC percentage flows. The standard errors of the coefficients are reported in parentheses and adjust for clustering at the fund level. The regressions include time fixed effects.
Consistent with Figure 1, Table III indicates an economically and statis-tically significant flow-performance relation for the extreme performance quintiles using the DC flows for both the one-year and five-year performance
22Tests using the first three polynomials of fund performance ranks indicate that only the cubic
Table III
Piecewise Linear Panel Regressions of DC and Non-DC Flows
This table summarizes a piecewise linear panel regression of DC and non-DC asset flows on fund variables.Low,Mid, andHighrepresent the funds’ ranked return performance, whereLowf,t= min(Rankf,t, 0.2),Midf,t=min(Rankf,t–Lowf,t, 0.6), andHighf,t=(Rankf,t–Lowf,t–Midf,t). The other variables are fund characteristics. Standard errors are reported in parentheses and adjusted for clustering at the fund level. The regressions also include time fixed effects.*,**, and***denote
estimates that are statistically different from zero at the 10%, 5%, and 1% significance levels.
1-Year Prior Performance
5-Year Prior Performance
DC Non- DC
Non-Flow DC Flow Difference Flow DC Flow Difference
Low Performance 1.194*** 0.328** 0.866** 0.845** 0.096 0.749**
(0.377) (0.142) (0.374) (0.334) (0.166) (0.330) Mid Performance 0.236*** 0.284*** −0.049 0.421*** 0.281*** 0.140*
(0.086) (0.037) (0.090) (0.082) (0.036) (0.083) High Performance 1.776*** 0.487*** 1.289*** 0.619* 0.102 0.517
(0.497) (0.180) (0.476) (0.329) (0.154) (0.334) Log DC Size −0.136*** 0.007 −0.143*** −0.125*** 0.006 −0.132***
(0.017) (0.006) (0.016) (0.018) (0.006) (0.016) Log Non-DC Size 0.041** −0.070*** 0.111*** 0.020 −0.069*** 0.089***
(0.016) (0.009) (0.018) (0.014) (0.010) (0.016) Log Family Size 0.039*** 0.039*** 0.000 0.042*** 0.032*** 0.010
(0.014) (0.007) (0.013) (0.014) (0.007) (0.013) Log Age −0.037 0.003 −0.040* −0.005 0.020* −0.025
(0.024) (0.010) (0.022) (0.024) (0.011) (0.024) Expense Ratio −0.471 −0.223 −0.248 −0.152 −0.380* 0.229
(0.551) (0.219) (0.511) (0.509) (0.227) (0.481) Turnover −0.026 −0.018** −0.007 −0.042** −0.019* −0.023
(0.019) (0.008) (0.016) (0.018) (0.011) (0.018)
Volatility 1.026 0.009 1.017 0.499 −0.567 1.066
(0.870) (0.317) (0.857) (0.963) (0.477) (0.951)
Style Flow 0.359 0.282** 0.077 0.051 0.248* −0.197
(0.324) (0.132) (0.295) (0.319) (0.138) (0.300)
Observations 3,851 3,851 3,851 3,249 3,249 3,249
R2 0.098 0.124 0.064 0.081 0.089 0.054
-0.2 -0.1 0 0.1 0.2 0.3 0.4 0.5 0.6 0.7
0 0.2 0.4 0.6 0.8 1
Fund Flo
w
Performance Rank DC Flow Non-DC Flow
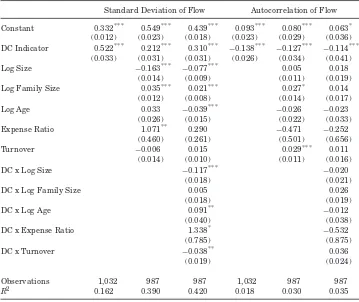
Figure 2. Piecewise linear flow-performance relation for percentile performance port-folios of DC assets and non-DC assets.This figure shows the flow-performance relation for DC and non-DC assets. The lines represent the piecewise linear relation following Sirri and Tufano (1998), as summarized in TableIII.
regression in Figure2, which depicts the flow-performance relation for DC and non-DC flows evaluated at the means of the remaining covariates.23
Consistent with Sirri and Tufano (1998), we find that the sensitivity to one-year performance is generally stronger than the sensitivity to longer-term performance measures. This difference in sensitivity is less pronounced for DC flows than for non-DC flows. Although the DC flows are the result of a joint decision by plan sponsors and participants, and, as explained earlier, the role of plan sponsors in DC plans is fundamentally different from that of DB plan sponsors, it can still be instructive to compare our results to those of studies on DB plan sponsors. In particular, Del Guercio and Tkac (2002) and Heisler et al. (2007) document that DB pension clients do not flock disproportionately to recent winners, which varies from our results for DC plans. However, our results are consistent with those of Goyal and Wahal (2008), who find that DB plan sponsors hire investment managers after they earn large positive excess returns.
Important remaining explanatory variables for fund flows in TableIIIare the size of the DC and non-DC assets invested in the fund and the size of the fund family. The fund’s DC asset size has a negative effect on DC flows for both the
23The results are not affected qualitatively if we use the Fama-MacBeth (1973) estimation
one- and the five-year horizon and the fund’s non-DC asset size has a negative effect on non-DC flows. These negative effects are expected because the growth rates of fund flows tend to decline with the size of assets under management. The positive effects of family size capture positive spillovers between non-DC and DC clienteles, which is also reflected in the positive coefficient on non-DC size for DC flows. Thus, funds from larger fund families tend to attract both DC and non-DC assets with no significant difference between the two.
The flow-performance relation for DC assets in mutual funds differs substan-tially from the relation reported in the literature for mutual funds in general. (See, for example, Chevalier and Ellison (1997), Sirri and Tufano (1998), Huang, Wei, and Yan (2007), and Kim (2011), among others.) These studies typically find a convex flow-performance relation for total mutual fund assets. Our re-sults instead show thatas a group, DC savers and their sponsors appear to be monitoring their mutual funds more closely than traditional mutual fund investors, resulting in a more sensitive flow-performance relation for extreme performers.
D. Alternative Performance Benchmarks
Defined
Contribution
P
ension
Plans
823
This table summarizes a piecewise linear panel regression of DC and non-DC asset flows on fund variables.Low,Mid, andHighrepresent the funds’
ranked return performance, whereLowf,t=min(Rankf,t, 0.2),Midf,t=min(Rankf,t–Lowf,t, 0.6), andHighf,t=(Rankf,t–Lowf,t–Midf,t). The other
variables are fund characteristics. The performance measures correspond to the objective code-adjusted performance, style-adjusted performance, and Carhart-adjusted performance. Standard errors are reported in parentheses and adjusted for clustering at the fund level. The regressions also
include time fixed effects.*,**, and***denote estimates that are statistically different from zero at the 10%, 5%, and 1% significance levels.
Objective Code- Style-Adjusted Carhart-Adjusted
Adjusted Performance Performance Performance
DC Flow Non-DC Flow Difference DC Flow Non-DC Flow Difference DC Flow Non-DC Flow Difference
Low Performance 1.040*** 0.379** 0.661* 1.219*** 0.088 1.130** 0.927** 0.073 0.854**
(0.389) (0.150) (0.394) (0.420) (0.161) (0.448) (0.406) (0.168) (0.426)
Mid Performance 0.237*** 0.273*** −0.036 0.189* 0.275*** −0.086 0.138 0.281*** −0.143
(0.090) (0.036) (0.095) (0.097) (0.035) (0.100) (0.100) (0.037) (0.106)
High Performance 1.736*** 0.504*** 1.232*** 1.390*** 0.415** 0.975** 1.625*** 0.290 1.336***
(0.473) (0.181) (0.455) (0.470) (0.180) (0.475) (0.504) (0.188) (0.474)
Log DC Size −0.136*** 0.006 −0.142*** −0.144*** 0.004 −0.148*** −0.130*** 0.011* −0.142***
(0.017) (0.006) (0.016) (0.018) (0.006) (0.017) (0.018) (0.006) (0.017)
Log Non-DC Size 0.041** −0.070*** 0.111*** 0.037** −0.074*** 0.111*** 0.030* −0.073*** 0.103***
(0.017) (0.009) (0.018) (0.0 18) (0.009) (0.019) (0.017) (0.009) (0.019)
Log Family Size 0.039*** 0.039*** 0.000 0.045*** 0.044*** 0.002 0.040*** 0.037*** 0.003
(0.014) (0.007) (0.013) (0.015) (0.007) (0.013) (0.015) (0.007) (0.014)
Log Age −0.037 0.004 −0.041* −0.047* −0.006 −0.041* −0.036 −0.001 −0.035
(0.024) (0.010) (0.023) (0.024) (0.010) (0.022) (0.027) (0.010) (0.026)
Expenses −0.401 −0.191 −0.210 −0.416 −0.171 −0.245 −0.108 0.076 −0.185
(0.547) (0.218) (0.506) (0.556) (0.221) (0.513) (0.579) (0.226) (0.536)
Turnover −0.024 −0.018** −0.006 −0.030 −0.022*** −0.008 −0.029 −0.016* −0.014
(0.019) (0.008) (0.016) (0.019) (0.008) (0.017) (0.020) (0.008) (0.018)
Volatility −0.099 −0.506 0.408 0.096 −0.857* 0.953 −0.017* −0.016*** −0.001
(1.304) (0.468) (1.284) (1.914) (0.506) (1.881) (0.008) (0.003) (0.008)
Style Flow 0.499 0.389*** 0.111 0.788*** 0.661*** 0.127 0.439 0.332** 0.107
(0.322) (0.132) (0.293) (0.229) (0.089) (0.214) (0.331) (0.131) (0.301)
Observations 3,851 3,851 3,851 3,780 3,780 3,780 3,408 3,408 3,408
E. Different Subperiods
The structure of DC pension plans has evolved substantially over our sample period. Possible drivers of this evolution include regulatory changes, partici-pant lawsuits, and pressure from employees and the public. For example, some of the structural changes include the broadening of the available investment choices, the movement toward a more open architecture in which the plan menus include investment options from different providers, the adoption of automatic enrollment, whereby new funds are directed into the default fund specified by the plan, and the movement away from fixed income default funds to target date default funds.24
Beyond the changes in plan structure, the behavior of fund investors could also vary across different market environments. For example, Kim (2011) does not find convexity in the flow-performance relation during the 2000s when markets are volatile and there is less dispersion in performance across funds.
To investigate whether changes in the plan structure and market environ-ment have affected the flow-performance relation over our sample period, we divide our sample into two equal subperiods (1996 to 2002 and 2003 to 2009). TableVreports the results of the piecewise linear specification over the two sub-periods. For the non-DC assets we find a significant convex flow-performance relation between 1996 and 2002 that disappears between 2003 and 2009. On the other hand, for the DC assets we find strong flow-performance sensitivity for both the bottom and the top performance quintiles over the later period (2003 to 2009). Interestingly, the sensitivity of flows to bottom-quintile performance for DC assets is relatively weak over the earlier period (1996 to 2002) and strengthens significantly during the subsequent period (2003 to 2009). Thus, DC plans become more sensitive to poor performance over the recent time pe-riod, which may be due to participant lawsuits, pressure from employees and the public, and regulatory changes.
F. Interactions with Asset Size and Age
The flow-performance sensitivity might vary with the size and age of the mutual funds. Although we control for the logarithms of DC and non-DC as-set size and for the logarithm of the age of the funds, these specifications do not allow the flow-performance relation to differ by asset size or fund age. In this section we consider these potential factors since DC and non-DC asset size is related to the distribution of flows. In Table VI we use the one-year performance specifications from Table III and add controls for the interac-tions between the fund performance variables and the demeaned fund size and age. The results show that none of the interaction coefficients is significant at a 5% significance level. Furthermore, the estimated coefficients on the three
24See Campbell et al. (2011) for an analysis of recent changes in DC accounts. The Pension
Defined
Contribution
P
ension
Plans
825
This table summarizes a piecewise linear panel regression of DC and non-DC asset flows on fund variables.Low,Mid, andHighrepresent the funds’
ranked return performance, whereLowf,t=min(Rankf,t, 0.2),Midf,t=min(Rankf,t–Lowf,t, 0.6), andHighf,t=(Rankf,t–Lowf,t–Midf,t). The other
variables are fund characteristics. Standard errors are reported in parentheses and adjusted for clustering at the fund level. The regressions also
include time fixed effects.*,**, and***denote estimates that are statistically different from zero at the 10%, 5%, and 1% significance levels.
1996–2002 2003–2009
DC Flow Non-DC Flow Difference DC Flow Non-DC Flow Difference
Low Performance 0.660 0.318 0.343 1.546*** 0.410** 1.136**
(0.630) (0.223) (0.649) (0.473) (0.196) (0.462)
Mid Performance 0.416*** 0.333*** 0.083 0.120 0.259*** −0.140
(0.141) (0.051) (0.148) (0.111) (0.053) (0.113)
High Performance 2.484*** 1.234*** 1.250* 1.296** −0.031 1.327**
(0.733) (0.297) (0.717) (0.650) (0.208) (0.625)
Log DC Size −0.163*** 0.008 −0.171*** −0.114*** 0.010 −0.123***
(0.028) (0.008) (0.028) (0.017) (0.008) (0.016)
Log Non-DC Size 0.046 −0.077*** 0.122*** 0.036** −0.066*** 0.103***
(0.029) (0.013) (0.032) (0.015) (0.011) (0.017)
Log Family Size 0.039* 0.049*** −0.010 0.034** 0.028*** 0.006
(0.023) (0.010) (0.022) (0.015) (0.008) (0.014)
Log Age 0.015 −0.001 0.016 −0.078** 0.012 −0.090***
(0.034) (0.013) (0.034) (0.032) (0.015) (0.031)
Expense Ratio 0.362 0.125 0.238 −0.435 −0.208 −0.227
(0.815) (0.331) (0.772) (0.673) (0.284) (0.619)
Turnover 0.000 −0.016* 0.017 −0.065*** −0.023* −0.042*
(0.027) (0.009) (0.024) (0.023) (0.013) (0.025)
Volatility 1.423 0.540 0.883 −1.865 −1.845** −0.020
(1.104) (0.354) (1.110) (1.803) (0.726) (1.756)
Style Flow −0.118 0.061 −0.179 0.400 0.417** −0.017
(0.596) (0.186) (0.612) (0.375) (0.171) (0.345)
Observations 1,759 1,759 1,759 2,092 2,092 2,092
The
Journal
of
Finance
R
Table VI
Piecewise Linear Panel Regressions of DC and Non-DC Flows with Size and Age Interaction Effects
This table summarizes a piecewise linear panel regression of DC and non-DC asset flows on fund variables.Low,Mid, andHighrepresent the
funds’ ranked return performance, whereLowf,t=min(Rankf,t, 0.2),Midf,t=min(Rankf,t–Lowf,t, 0.6), andHighf,t=(Rankf,t–Lowf,t–Midf,t). The
performance ranks are interacted with the logarithms of DC and non-DC size and with the logarithm of the age of the funds. All the continuous control variables are demeaned to facilitate interpretation of the economic magnitude of the results. The other variables are fund characteristics.
Standard errors are reported in parentheses and adjusted for clustering at the fund level. The regressions also include time fixed effects.*,**, and
***denote estimates that are statistically different from zero at the 10%, 5%, and 1% significance levels.
Size Interactions Age Interactions
DC Flow Non-DC Flow Difference DC Flow Non-DC Flow Difference
Low Performance 0.970*** 0.252* 0.718* 1.147*** 0.287** 0.860**
(0.370) (0.151) (0.372) (0.381) (0.141) (0.379)
Mid Performance 0.258*** 0.294*** -0.036 0.252*** 0.302*** -0.050
(0.089) (0.038) (0.092) (0.092) (0.039) (0.095)
High Performance 1.492*** 0.365** 1.128*** 1.639*** 0.373** 1.266***
(0.418) (0.159) (0.414) (0.489) (0.171) (0.476)
Low Performance* −0.317 −0.154* −0.163
Log DC Size (0.218) (0.091) (0.223)
Mid Performance* −0.065 −0.002 −0.063
Log DC Size (0.083) (0.034) (0.081)
High Performance* −0.271 0.071 −0.342
Log DC Size (0.389) (0.138) (0.379)
Low Performance* 0.162 0.251 −0.089
Log Non-DC Size (0.307) (0.165) (0.313)
Mid Performance* 0.033 −0.034 0.067
Log Non-DC Size (0.074) (0.047) (0.085)
High Performance* 0.149 −0.311 0.460
Log Non-DC Size (0.451) (0.221) (0.481)
Defined
Contribution
P
ension
Plans
827
Size Interactions Age Interactions
DC Flow Non-DC Flow Difference DC Flow Non-DC Flow Difference
Low Performance* −0.023 −0.034 0.011
Log Age (0.445) (0.146) (0.458)
Mid Performance* −0.055 −0.078* 0.023
Log Age (0.135) (0.046) (0.141)
High Performance* −0.702 −0.446 −0.256
Log Age (0.686) (0.279) (0.641)
Log DC Size −0.052 0.035** −0.086*** −0.135*** 0.008 −0.142***
(0.033) (0.014) (0.033) (0.017) (0.006) (0.016)
Log Non-DC Size −0.003 −0.101*** 0.098* 0.040** −0.071*** 0.111***
(0.054) (0.028) (0.054) (0.016) (0.009) (0.018)
Log Family Size 0.040*** 0.039*** 0.001 0.039*** 0.039*** 0.000
(0.014) (0.007) (0.013) (0.014) (0.007) (0.013)
Log Age −0.034 0.004 −0.038* −0.002 0.041* −0.044
(0.023) (0.010) (0.022) (0.068) (0.021) (0.069)
Expense Ratio −0.486 −0.273 −0.213 −0.520 −0.257 −0.263
(0.540) (0.218) (0.500) (0.556) (0.217) (0.519)
Turnover −0.023 −0.019** −0.004 −0.026 −0.018** −0.007
(0.018) (0.008) (0.016) (0.018) (0.008) (0.016)
Volatility 0.891 0.036 0.855 1.052 0.049 1.004
(0.854) (0.320) (0.842) (0.873) (0.317) (0.865)
Style Flow 0.391 0.307** 0.084 0.351 0.281** 0.070
(0.325) (0.132) (0.294) (0.324) (0.133) (0.296)
Observations 3,851 3,851 3,851 3,851 3,851 3,851
piecewise linear performance segments remain very similar to the results re-ported in TableIII.25,26
G. Sample Selection
One potential concern regarding our analysis is whether selection bias could be affecting our results. We typically observe the amount of DC assets for a fund family’s 12 domestic equity funds that have the largest amount of DC assets. Since some mutual fund families have more than 12 domestic equity funds, we might not observe the DC assets for smaller funds within that family or for funds with relatively small proportions of DC assets.27 This sample
selection could be problematic because of our inability to compute DC and non-DC flows for funds that enter and exit our sample, and thus these funds would be missing from our analysis. Furthermore, this sample selection issue could be more problematic for small funds, since large funds are more likely to consistently remain in the sample.
To analyze the relevance of this sample selection issue, we examine the like-lihood of fund exit and entry according to fund-level characteristics, including performance. Thus, we consider funds that listed DC assets in the prior period and have missing DC assets in the current period (exit funds) and funds that had missing DC assets in the prior period and have available DC assets in the current period (entry funds).28
TableVIIreports the coefficient estimates of a multinomial logit regression for fund entry and exit decisions. The base group corresponds to funds that have nonmissing DC assets for two consecutive time periods. We find that funds with poor prior performance have a higher probability of exiting the sample and funds with superior prior performance have a higher probability of entering the sample.
These results are consistent with our earlier finding regarding the flow-performance sensitivity of DC assets. The results indicate that DC assets are more likely to flee poorly performing funds (and thus, become missing from the data set) if the fund experiences poor prior performance. Similarly, DC assets in a fund are more likely to increase and cause the fund to enter the data
25For the interaction effects we use the demeaned logarithm of DC size, the demeaned logarithm
of non-DC size, and the demeaned logarithm of age, so that the coefficients on the piecewise linear performance ranks can be interpreted as the coefficients of funds at the means of the logarithms of the corresponding variables.
26In additional robustness tests, we replace the percentage DC and non-DC flows with the
percentiles of DC and non-DC flows. Consistent with our base-case specification in TableIII, we find that the percentile DC flows are more sensitive to top- and bottom-quintile performance than the middle three performance quintiles. Furthermore, the relation is close to linear using the percentile of non-DC flows. The results are available in the Internet Appendix.
27It should be noted, however, that some fund families provide the information on more than
12 funds.
28Since we are interested in the entry and exit of individual funds in thePensions & Investments
Table VII
Multinomial Logit for Entry and Exit Decisions
This table summarizes a multinomial logit specification for fund entry and exit decisions. The exit (entry) indicator variable equals one if funds have nonmissing (missing) DC assets in the past year and missing (nonmissing) DC assets in the current year. The base group consists of all funds in the sample that have nonmissing DC assets for two consecutive years. Standard errors are reported in parentheses and adjusted for clustering at the fund level. The regressions also include time fixed effects.*,**, and***denote estimates that are statistically different from zero at the 10%, 5%, and
1% significance levels.
Exit Entry
Performance −0.958*** 0.485**
(0.221) (0.203)
Log Fund Size −0.644*** −0.653***
(0.060) (0.063)
Log Family Size 0.594*** 0.549***
(0.058) (0.057)
Log Age 0.071 −0.202**
(0.107) (0.099)
Expenses 3.193* 0.953
(1.828) (1.607)
Turnover 0.065 −0.020
(0.058) (0.055)
Volatility 2.368 1.184
(2.734) (2.906)
Style Flow −3.161** −1.050
(1.289) (1.169)
Observations 5,006 5,006
set if the fund experiences superior prior performance. These selection effects likely attenuate the flow-performance relation for DC assets in our base-case specifications, and likely increase the sensitivity of DC flows to performance.
IV. Plan Sponsor versus Plan Participant Decisions
-0.6 -0.4 -0.2 0 0.2 0.4 0.6
0 0.2 0.4 0.6 0.8 1
Fund F
low
Performance Rank Sponsor Flow ParƟcipant Flow
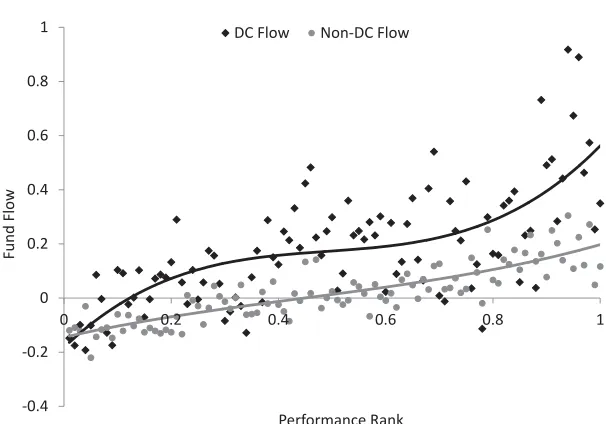
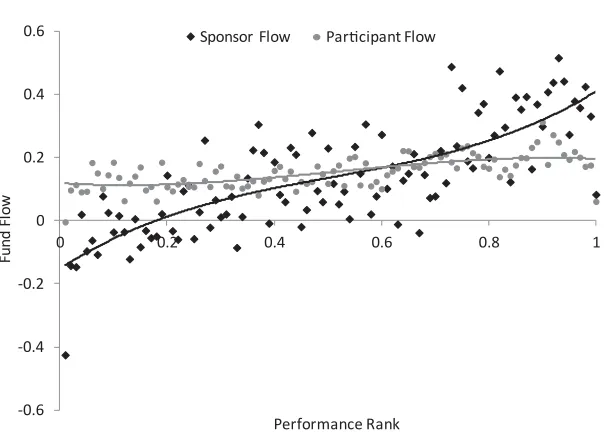
Figure 3. Plan flows and participant flows by performance percentiles.This figure shows the flow-performance relation for sponsor flows and participant flows based on 11-K filings of 401(k) plans. The dots represent the average flows for 100 performance groups, where the remaining covariates are evaluated at their sample means. Diamonds correspond to sponsor flows and circles correspond to participant flows. Participant flows are computed as the difference between total flows and sponsor flows (i.e., flows driven by addition and deletion decisions in 401(k) menus). The solid curves show the least-squares cubic relations.
primarily to decisions by the plan sponsors. The annual flows at other times can be attributed primarily to participants.
The differences in flow-performance sensitivity of the flows attributed to plan sponsors versus plan participants are striking as is illustrated in Figure 3, where we evaluate the covariates of equation (6) at their sample means. Figure 3 depicts the sponsor and participant flows for percentile portfolios formed according to the prior-year fund return, where plan flow is computed based on equation (3) and captures the total growth of fund assets held in 401(k) plans. The participant flows are based on equation(5)and capture the fund flows not driven by addition and deletion decisions by plan sponsors.
Figure3illustrates that most of the flow-performance sensitivity is driven by addition and deletion decisions of plan sponsors. In contrast, participant flows are only weakly related to prior fund performance.
Defined
Contribution
P
ension
Plans
831
This table summarizes a piecewise linear panel regression of total plan as well as estimated plan sponsor and plan participant asset flows on fund
variables based on 11-K filings of 401(k) plans.Low,Mid, andHighrepresent the funds’ ranked return performance over the prior year, whereLowf,t
=min(Rankf,t, 0.2),Midf,t=min(Rankf,t–Lowf,t, 0.6), andHighf,t=(Rankf,t–Lowf,t–Midf,t). The other variables are fund characteristics. Standard
errors are reported in parentheses and adjusted for clustering at the fund level. The regressions also include time fixed effects.*,**, and***denote
estimates that are statistically different from zero at the 10%, 5%, and 1% significance levels.
Pensions and InvestmentsSample of Funds 11-K Sample of Funds
Total Flows Sponsor Flows Participant Flows Total Flows Sponsor Flows Participant Flows
Low Performance 1.046*** 1.050*** −0.004 0.773*** 0.786*** −0.013
(0.399) (0.376) (0.111) (0.299) (0.274) (0.100)
Mid Performance 0.465*** 0.310*** 0.156*** 0.516*** 0.380*** 0.135***
(0.091) (0.083) (0.024) (0.068) (0.062) (0.021)
High Performance 1.584*** 1.389*** 0.194 0.744** 0.718** 0.026
(0.482) (0.427) (0.136) (0.324) (0.291) (0.101)
Log Plan Size −0.089*** −0.063*** −0.026*** −0.092*** −0.065*** −0.027***
(0.010) (0.009) (0.003) (0.006) (0.005) (0.002)
Log Fund Size 0.047** 0.036* 0.011* 0.048*** 0.048*** −0.001
(0.021) (0.019) (0.006) (0.012) (0.011) (0.004)
Log Family Size 0.006 0.005 0.002 0.016** 0.010* 0.006**
(0.017) (0.015) (0.005) (0.007) (0.006) (0.003)
Log Age −0.056* −0.040 −0.016* −0.076*** −0.053*** −0.023***
(0.033) (0.029) (0.009) (0.023) (0.021) (0.007)
Exp. Ratio −1.473*** −1.136** −0.336** −0.741* −0.531 −0.210
(0.528) (0.478) (0.165) (0.420) (0.353) (0.142)
Turnover 0.032 0.038 −0.006 −0.030* −0.011 −0.020***
(0.025) (0.025) (0.007) (0.018) (0.018) (0.005)
Volatility 1.061 0.277 0.783** 0.536 −0.037 0.573**
(1.056) (0.919) (0.354) (0.746) (0.647) (0.254)
Style Flow 0.811** 0.461 0.350*** 0.873*** 0.685*** 0.188**
(0.341) (0.303) (0.087) (0.280) (0.254) (0.082)
Observations 2,815 2,815 2,815 8,268 8,268 8,268