KEYWORDS
ABSTRACT
JURNAL KEDOKTERAN YARSI (16 (2) : 073-082 (2008)
Body mass index and predicted percent body fat of Yogyakarta
and Flores Pygmy populations
Janatin Hastuti, Neni T Rahmawati, Rusyad A Suriyanto, Koeshardjono*), T
Jacob*)
Laboratory of Bioanthropology and Phalaeoanthropology, Faculty of Medicine Gadjah Mada University Yogyakarta
*)Late author
body mass index; percent body fat; Yogyakarta populations; Flores Pygmy population
Body mass index and percent body fat are two parameters used to assess human body composition, which has several advantages for clinical practice, sport, growth, and normal population as well. There are many populations distributed in the wide Indonesian area that have various geographical characteristics. As evidence, plateau environments are inhabited by many populations whose physical and physiological traits are vary. This study was aimed to investigate body mass index (BMI) and predicted percent body fat (%BF) between Yogyakarta populations and Flores pygmy population in East Nusa Tenggara Province residing on a similar plateau environment. The present study was done on 105 people (51 males and 54 females) of Samigaluh Kulon Progo (Yogyakarta), 87 people (40 males and 47 females) of Gunung Kidul (Yogyakarta) and 75 pygmy people of Manggarai, Flores (East Nusa Tenggara). Height and weight were measured in all participants of this study. BMI was calculated from height and weight measurements and %BF was predicted based on BMI value using formula of Guricci et al (1998). Then, t-student test, linear regression, and chi square test were performed to analyze the data. The results indicated that Samigaluh and Gunung Kidul populations in Yogyakarta have considerably greater average of height and weight compare to Flores Pygmy population. However, differences in BMI and %BF were only significant between Flores Pygmy and Yogyakarta males population. Despite majority of both populations being under normal category, nutritional category based on BMI showed significant difference between Flores Pygmy and Yogyakarta population. In addition, more underweight individuals were also observed in Flores Pygmy. In conclusion, Yogyakarta population was considerably taller and heavier than Flores Pygmy population, however, in terms of %BF and BMI, they were nearly the same lean and body constitution. It is suggested that lower BMI and %BF represented by small body constitution and leanness in populations living on plateau in Yogyakarta and Flores are likely due to significant adaptation to their environment.
Numerous methods are available to assess human body composition, which is one of important indicator of nutritional status and health state (Kupper et al., 1998; Heyward, 2004; Idema et al., 1998; Tanphaichitr et al., 1995; Fürst & Leweling, 1995). Concerning to measurement of body composition in population, anthropometric method is one of the preferable method, which has several advantages (Davies, 2005; Lasker, 2005; Sephard, 2005; Heyward, 2004; Abernethy, 1996). Commonly used field-applicable method, which is also suitable in clinical practice, is body mass index (BMI). There are several reasons of using BMI as a practical anthropometric parameter to assess nutritional status
especially in adults (Tanphaichitr et al., 1995). Firstly, BMI can simply be calculated from height and weight of any adult. Secondly, it has the least possibility of dependency on height. Thirdly, it relates to total body fatness, especially on BMI value more than 20 (Tanphaichitr et al., 1995). Fourthly, it correlates with mortality and some diseases (Allison et al., 2002). Lastly, BMI can be applied as a guideline to therapy in patients with underweight as well as overweight
Corepondence:
(Tanphaichitr et al., 1995). Body mass index has been widely used to assess human body constitution in the worldwide populations (Deurenberg et al., 1998; Tanphaichitr et al., 1995; Rutishauser et al., 1995; Schultink & Raaij, 1995). Some studies also reported BMI of Indonesian in different areas, ethnicities, and socioeconomic backgrounds (Guricci et al., 1988, 1999; Küpper et al., 1998).
Percent body fat is a term used to classify the levels of body fatness. It is also known as relative body fat, which is the fat mass expressed as a percentage of total body weight (%BF= fat mass/body weight x 100). Men, women, children, and physically active adults have each recommended %BF standard (Heyward &Wagner, 2004). Body fatness views the body mass at molecular level in two-component model. Basically, the two-component model illustrates the human body as fat mass (FM) or fat body (FB) and fat free mass (FFM) or fat free body (FFB). While fat mass is the absolute amount of body fat including all extractable lipids from adipose and other tissues, fat free mass consists of all residual chemicals and tissues including water, muscle, bone, connective tissues, and internal organs (Heyward &Wagner, 2004). Presently, the two-component model is one of the most widely used models in body composition studies to obtain reference measures of body composition to validate the laboratory and field methods and to develop prediction equations (Heyward & Wagner, 2004; Shen et al., 2005). It was reported that percent body fat and fat mass were significantly correlated with BMI in black and white female populations (Gallagher et al., 1996). A study in Caucasians reported that higher body fat had a contribution to elevate the prevalence of cardio-vascular risk factor in normal weight males (Tanaka et al., 2002). Fat mass and fat free mass as the compo-nents of BMI were suggested to have a relationship with mortality rate in USA (Allison et al., 2002).
Relationship between BMI and body fat is known to depend on age and sex (Durnin & Womersley, 1974; Daurenberg et al., 1991; Daurenberg et al., 1998; Gallagher et al., 1996). Some studies indicate that there were differences in the relationship between body fat and BMI in some different populations or ethnicities (Guricci et al., 1998; Küpper et al., 1998; Wang et al., 1994; Prijatmoko and Strauss, 1995; Gallagher et al., 1996), which is addressed to the differences in body build (Guricci et al., 1999; Deurenberg et al., 1999), or differences in energy consumed and physical activity as well. There are several factors which might contribute to dependency of the relationship between
%BF and BMI on ethnicity or populations in general such as, differences in physical activity level between populations. Populations with higher activity level might have a higher proportion of muscle mass in the body at the same weight (Deurenberg et al., 1999). Asians have been reported to have greater %BF at the same BMI in comparison to Caucasians (Wang et al., 1994). It has also been reported that Indonesian have higher percent body fat at lower BMI values in comparison to Caucasians (Guricci et al., 1998; Deurenberg et al., 1998).
Yogyakarta has wide range topography from beach to highland plateau. One famous plateau lies in Gunung Kidul Regency the southern part of Yogyakarta and the other plateau lies in Menoreh Plateau under Samigaluh District of Kulon Progo the northwest part of Yogyakarta. The people living in both regions have nearly normal stature of the average adult male stature. There is a considerable difference between Yogyakarta population and people of Rampasasa in Manggarai Flores whose average height (of adult males) is less than 150 cm and therefore called pygmy population. Interestingly, they have nearly similar condition of topography to the former populations. Concerning those differences of body constitution, their body composition is questionable whether they have similar or different body composition in terms of body mass index and percent body fat. Evidences that pygmies have lower BMI were reported in Cameroon (Kesteloot et al., 1996), Jarawa in Andaman Islands (Sahani, 2003), and Onge in Andaman Islands (Pandey, 2006). It was thought that small body size in pygmy populations was an efficient adaptation to their environment and the way of living especially being hunter-gatherers (Sahani, 2003).
The aim of this study is to investigate whether body mass index and predicted percent body fat is different in three populations living in plateau region. For that purpose data of two populations in Yogyakarta living in Kulon Progo and Gunung Kidul Regency were compare to a Pygmy population living in Manggarai Regency, Flores.
MATERIALS AND METHODS
Rampasasa hamlet, District of Waerii, Manggarai Regency in Flores Island (East Nusa Tenggara). The later population was specific concerning to the average height of the males, which was less than 1.5 m, therefore it was called a pygmy population. Measurements of both Kulon Progo and Gunung Kidul populations were conducted in 2003 and 2007 respectively. While, the data of Flores Pygmy popu-lation were collected in 2005. Overall, 267 subjects were participated in this study that consisted of 105 people of Kulon Progo, 87 people of Gunung Kidul, and 75 people of Flores Pygmy population. Sample size for Kulon Progo and Gunung Kidul populations was determined using the formula of Daniel (2005) for estimating means of a population based on preliminary research. The sample size required was 82 and 87 people for Kulon Progo and Gunung Kidul populations respectively, whereas for Flores Pygmy population the required sample size cannot be determined due to their specific charac-teristic. The demographic data of Waemulu village showed that Rampasasa kampong where the Pygmies live in was inhabited by approximately 207 people (130 females and 77 males) (Rusyad, 2005). Only 75 the people were observed in this study due to the limited time and funding. The age of the subjects was varied which ranged between 16 to 80 years.
Before examination, subjects were asked to complete the questionnaire list and signed the letter of informed consent. Then, measurements of height and weight were taken to all subjects. Wearing a light cloth, each subject was measured on his or her weight using a weight scale. Height was measured with an anthropometric scale according to a standard protocol by Lohman et al. (1988) by a trained anthropometrist with the subjects barefoot, lightly clothed, and eye orientation on Frankfurt plane horizontally. Body mass index was determined by the measurements of height and weight and cate-gorized into underweight, normal, and overweight using the Indonesian Standard (Supariasa, 2002):
Body mass index =
2
(m)
height
(kg)
weight
Category:
Underweight class-2 < 17 underweight class-1 17,0-18,5
normal 18,5-25,0
overweight class-1 25,0-27,0
overweight class-2 > 27,0 (Depkes, 1994 cit Supariasa, 2002)
Percent body fat was predicted from BMI using a formula developed in an Indonesian population by Guricci et al. (1998):
%BF = 1.30*BMI – 9.8*sex + 6.4 (sex: males = 1; females = 0)
Data were analyzed using SPSS (release 11) for Windows. Differences between male and female measurements of each population were tested by Student’s t-test, whilst, differences among the three populations regarding sex were observed by univariate analysis, using the LSD procedure. Linear regression analysis was also performed to predict the regression line of BMI and percent body fat on age in all populations according to sex. In addition, dif-ferences in frequencies of BMI categorize in male and female populations were evaluated by chi square test.
RESULTS
The number of subjects involved in this study as it was described in TABLE 1 clearly showed that it was proportionally distributed among populations in both males and females. As many as 267 people consisted of 125 males and 142 females participated in this study. Among others, Flores population had the least number of samples, only 75 people (34 males and 41 females). This was due to the specific condition being an isolated population whose population number was only about 200 people in 2005. The subjects’ age were ranging between 18-80 years for the whole males and females populations. Nevertheless, Flores female population had the lowest age range (16-58 years).
Table 1. Sample distribution
Males Females
Total N
N Age (year) N Age (year)
Kulon Progo Gunung Kidul Flores
Total
51 40 34
125
17-75 24-74 16-80
16-80
54 47 41
142
20-80 25-80 16-58
16-80
105 87 75
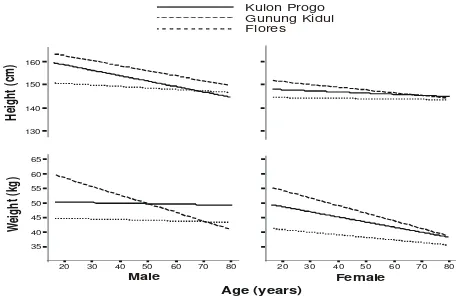
Height and weight per age of males and and Flores Pygmy males’ weight remained steady by the range of age, even Kulon progo males were around 5 kg heavier than Flores Pygmy males. In general Flores Pygmy males and females were the shortest and the lightest among others populations.
20 30 40 50 60 70 80
Figure 1. Height and weight for age of Yogyakarta and Flores pygmy populations
Table 2 gives information about the means and standard deviations of height, weight, BMI, and percent body fat of Yogyakarta, the Flores Pygmy, and several others populations. Among Indonesian populations, the Flores Pygmy performed the shortest and the lightest. The Flores males were 148.97 cm high and 44.18 kg weight, whereas, the females were 144.14 cm high and 39.59 kg weight on the average. This was consistent to what they called as a pygmy population. A pygmy population has an
average height of less than 150 cm for males. Jarawas in Andaman Island, who were Negritos, had nearly the same weight but slightly higher than Flores Pygmy. Compared to the Cameroon Pygmy, the Flores Pygmy indicated lighter in both males and females and shorter males but a bit taller females. In comparison to Jakarta and Ujung Pandang populations, Yogyakarta populations were much shorter and lighter.
Table 2. Mean weight, height, BMI, and %BF of Yogyakarta, Flores Pygmy, and several other populations
Populations Sex N Mean and SD ** P < 0.01; asterisks represent significant differences between males and females within the same population
a: Malay Indonesian population in Jakarta and Chinese ancestry population in Makale Ujung Pandang taken from Guricci et al. (1999) b: hunting-gathering Negrito tribe of Andaman Island taken from Sahani (2003)
Means of BMI ranged between 19 and 24 (Table 2). In general, there was only a slight difference between males and females of Yogyakarta and the Flores Pygmy, which was statistically not significant, except the Flores Pygmy population. Almost similar to the Flores Pygmy population was the Cameroon Pygmy population (20 and 19 for males and females respectively). On the other hand, Jarawas Andaman Negrito males had the lowest average of BMI. Mean value for %BF were greater in Jakarta and Ujung Pandang males and females and lesser in Yogyakarta populations. Flores Pygmy females had the lowest fat percentage among other Indonesian populations, in contrast to the males showing nearly the same as Gunung Kidul males’. The Jarawas Negrito seemed to have very low %BF which might be attributed to the different formula used to predict %BF, while, %BF of the Cameroon Pygmy was not available.
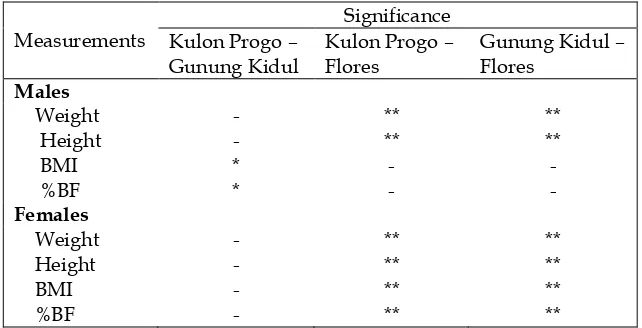
Further, the Flores pygmy population has significant differences in height and weight
compared with both Kulon Progo and Gunung Kidul populations (both sexes) as it was shown in TABLE 3. On the other hand, despite statistically not different Kulon Progo and Gunung Kidul populations had nearly the same height and weight. Concerning sex difference, there were no significant differences between males and females height and weight in each population, except the weight for Gunung Kidul population. Concerning to BMI, it was found that there were no significant differences between Kulon Progo and Flores males as well as between Gunung Kidul and Flores males. The only significant difference was appeared between Kulon Progo and Gunung Kidul males (P<0.05). Conversely, differences among females were observed between Kulon Progo and Flores as well as between Gunung Kidul and Flores, while Kulon Progo female population was not different significantly from their counterpart in Gunung Kidul.
Table 3. Significance of physical characteristic differences among populations based on LSD analysis
Measurements
Significance Kulon Progo –
Gunung Kidul
Kulon Progo – Flores
Gunung Kidul – Flores
Males Weight Height BMI %BF
- - * *
** ** - -
** ** - - Females
Weight Height BMI %BF
- - - -
** ** ** **
** ** ** **
* P < 0.05; ** P < 0.01
Projections of BMI in all populations mostly decreased by the increase of age as it was presented in Figure 1 with an exception of Kulon Progo male population. Among female populations, Gunung Kidul showed the highest prediction of BMI in the same age that was contradicted to the female pygmy Flores. Male populations, however, referred to different trend of projection. While the male pygmy population addressed to near steady in all of age, Kulon Progo and Gunung Kidul males, indicated an
Male Female
Figure 2. Predicted BMI in relation to age in Yogyakarta and Flores Pygmy populations
20 30 40 50 60 70 80
Figure 3. Predicted percent body fat in relation to age in Yogyakarta and Flores Pygmy populations
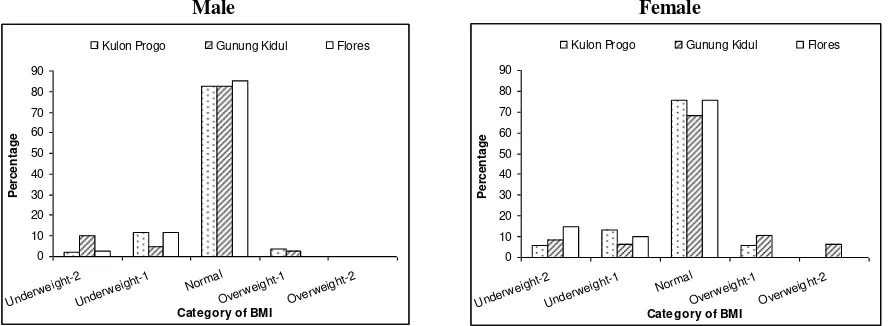
As BMI was classified into categories, most populations showed normal category for more than 70 % (Figure 3). Only a small number of the people were underweight class 1 and 2 as well. Moreover, a less number of overweight occurred specifically in males and nobody in Flores pygmy population was
overweight. When consulted to the result of chi-square test, it was found that there were significant differences (P<0.01) between BMI categories within each population without sex separation. There was also a considerable difference in the distribution within the three populations concerning sex (P<0.05).
Male
DISCUSSION
Geographically, the three areas taken in this study have similar topography of plateau ranging from 500 m to 900 m above sea level. Flores population are Manggarai people residing in Manggarai Regency, the western part of Flores Island, East Nusa Tenggara Province situated on 119º30' - 120º50' East Longitude, and 8º30' - 8º50' South Latitude. In addition, the hamlet Rampasasa inhabited by the Pygmies is situated on 8º 32' 113" South Latitude and 120º 27' 10" East Longitude (Rusyad, 2005). There is no significant difference in the climate and season among those areas. However, humidity was slightly lower in Flores (44-64%) (Rusyad, 2005) than in Yogyakarta i.e. 70-90% in Samigaluh (Hastuti et al., 2005) and 80-85% in Gunung Kidul (Pemerintahan Kabupaten Gunung Kidul, 2008). Samigaluh has lower temperature (24-30 ºC) in comparison to Flores (29-32 ºC), while temperature range in Gunung Kidul is 23-32 ºC. District of Samigaluh is located on a plateau and situated on 7 38’45” - 7 43’15” South Latitude and 110 06”58” - 110 12’58 East Longitude (Bappeda Kabupaten Kulon Progo, 1999), whereas, Gunung Kidul Regency is situated on 7 46’ - 8 09’ South Latitude and 110 21’ - 11050’ East Longitude. The way of living is nearly the same for the three populations. Most of those people work in the garden and in the field as farmers. The main garden commodies in Samigaluh Yogyakarta are the same as those in Flores (coffee and vanilla). In general, the main farm commodities are corn and cassava; however, Yogyakarta (Samigaluh and Gunung Kidul) people have the opportunity to plant rice in the farm once a year which is not applicable for the Flores people.
Yogyakarta populations living in Samigaluh and Gunung Kidul have short body height in term of body height category in modern man obtained by Martin (Olivier, 1969), while Flores population living in Manggarai Regency is recognized as pygmy in regard to the average adult normal male height of 150 cm or less (Jacob, 2006). The Flores Pygmies are of Manggarai ethnic inhabiting Rampasasa hamlet (Beo), Waemulu village, District of Waerii, Manggarai Regency (Rusyad, 2005). The data were compared with Indonesian sub-medium and medium height populations living in Ujung Pandang and Jakarta respectively. Comparison with another Pygmy
population was provided from Cameroon.
Additionally, a Negrito population from Jarawa in Andaman Island was presented for comparison with
Asiatic Pygmy. Over the world, Pygmy populations have a wide distribution which can be distinguished into three groups, namely, the African pygmies known as Negrillos, the Asiatic, and Oceanic pygmies known as Negritos (Montagu, 1951). Amongst the Asiatic Pygmies or Negritos are Semang of the central Malay Peninsula and of East Sumatra, Aeta of the Philippine Islands, and Andamanese. Hence, according to Montagu (1951) Negritos of Andaman Island are also called Pygmies. However, Jacob (2006) prefers to separate the pygmoids in a distinct group for population whose average adult normal stature is between 150 and 155 cm, which in this matter, Jarawas Andaman are implied in.
Overall, Flores Pygmy population shows the shortest and the lightest among other Indonesian populations. Yogyakarta populations both Kulon Progo and Gunung Kidul whose height and weight are greater than Flores Pygmy are still much shorter and lighter in comparison to Jakarta and Ujung Pandang population (Guricci et al., 1999) which may be attributed to the different socioeconomic and environmental background. Jakarta and Ujung Pandang populations are mostly civil servants with better education and economic level, while Yogyakarta populations are mostly farmers with lower education (mostly primary and secondary school) and low economic level. Moreover, difference of environmental background and ethnicity may also influence the difference. Compared with Cameroon Pygmy males whose average of height is slightly greater than Flores Pygmy, in contrast to the females who are a bit shorter than Flores Pygmy females, they show more or less similar weight. In comparison to Jarawas Andaman Negrito, Flores Pygmies are heavier although they are a little shorter. Both Jarawas and Cameroon Pygmy populations are hunter-gatherer living with much dependence on food supply in nature. This is in contrast with the Cameroon Pygmy living close to Bantu population complementarily provide their stuff (Kesteloot et al., 1996).
populations have the best nutritional status among other Indonesian populations. Compared with Cameroon Pygmy, the Flores Pygmy have nearly similar BMI both in males and females. It is also similar to Jarawas females, but not for Jarawas males whose BMI are slightly lower than both Flores and Cameroon Pygmies Males. Jarawas are one of the hunting-gathering Negrito tribes residing in South and Middle Andaman region and live in a semi-nomadic way. They are reported to have lower BMI value than some of the other Negritos. However, observation on their food intake and natural resources availability suggested that it does not correspond with the low BMI (Sahani, 2003). Sahani believed that in spite of their low BMI value, Jarawas Negrito are nutritionally well balanced and very healthy concerning to their diets, performing very high physical activity, and spending more leisure time. Whereas, Cameroon Pygmies living in Mecasse and Lolodorf regions are also living as hunter-gatherers who have no food reserves and eat only when the hunters return in the evening. The region is situated on a plateau at 700 to 800 m above sea level and only 3o to 4o north of the equator; hence, it is not
far different from Flores Pygmy region. They live in huts made of large leaves and very restricted in contact with people from outside except for Bantu communities living closed to their village (Kesteloot et al., 1996).
Flores Pygmy people rely on agriculture for food provision and encountered outsiders that may influence their way of living. The main plants cultivated are corn, cassava and yam, and other plants including squash and kidney bean. Coffee, cocoa, vanilla, candlenut, and coconut are cultivated in the plantation around the settlement (Rusyad, 2005). The pygmyzation is a process and result of adaptation to humid tropical forest, especially with dense undergrowth, hilly topography and low energy availability (Jacob, 2006). It is differed from fetalization, pedomorphism, insular adaptation, or pathological dwarfism (cretinism). As evidence, it is happening to some other pygmies in the Oceanic Islands. Jarawas Negritos according to Sahani (2003) show an efficient adaptation to the demands of hunting gathering subsistence concerning to the small stature and thinness. Further, pygmization is most likely an adaptation to savanna or arboreal dessert, and possibility to woodland-grassland ecology (Jacob, 2006). Low energy level in short periods will has no effect on lowering the stature, as well as changes in the environmental producing pygmoids do not influence the stature immediately.
The average male adult stature may gently be affected by mating with normal stature people. Moreover, continuous breakdown in genetic isolates may considerably raise the average stature (Jacob, 2006). We suggest that Flores Pygmy and Yogyakarta populations’ small body constitution and leanness are addressed to an efficient adaptation to their environment on a plateau.
A comparative study of the evolution of human pygmies by Migliano et al. (2007) suggested that the small body size of human pygmies evolved as a consequence of selection for early onset of reproduction. It developed through earlier cessation of growth, being the result of changes in late rather than early stages of growth. Concerning to Flores Pygmy, further Migliano et al. (2007) agree that evolution of small body size could be understood as the life history importance of ecological conditions in islands. Even Samigaluh and Gunung Kidul populations in Yogyakarta are near to pygmoid category. They similar geographical environment as an isolated population and live on a plateau may contribute to the nearly similar leanness and body constitution based on BMI. Further studies of calorie intake and physical activity in other short stature and pygmy people living on a plateau are warranted.
CONCLUSION
Yogyakarta populations both in Samigaluh and Gunung Kidul are considerably taller and heavier than Flores Pygmy population, however, they are nearly the same lean and body constitution concerning to %BF and BMI. It is suggested that lower BMI and %BF interpreting small body constitution and leanness in populations living on plateau in Yogyakarta and Flores are representing significance adaptive outcome to their environment.
ACKNOWLEDGEMENTS
We are grateful to the Dean of Medicine School Gadjah Mada University for the giving of research grant of Public Fund allocated to Faculty of Medicine Gadjah Mada University. Our gratitude to Yayasan Keluarga Hashim Djojohadikoesoemo (YKHD) for the grant received to carry out the Flores Pygmy study. We thank the local Government at various levels from Governors to traditional chiefs and people of Samigaluh Kulon Progo, Paliyan
Gunung Kidul, Yogyakarta, and Rampasasa
REFERENCES Differential associations of body mass index and adiposity with all-cause mortality among men in the first and second National Health and Nutrition Examination Surveys (NHANES I and NHANES II) follow-up studies. Int. J. Obes. (26): 410-416.
Bappeda Kabupaten Kulon Progo 1999. Evaluasi Rencana Tata Ruang Wilayah Kabupaten Kulon Progo, Laporan Kompilasi Data. PT Tatareka Paradya, Yogyakarta.
Baumgartner RN 2005. Age, in Heymsfield SB, Lohman TG, Wang Z, Going SB (eds): Human Body Composition, 2nd Edition.
Champaign, IL: Human Kinetics, pp 259-270.
Davies PSW 2005. Anthropometry and body composition, in Ulijaszek, SJ, Mascie-Taylor CGN (eds): Anthropometry: the Individual and the Population. Cambridge: Cambridge Univ. Press, pp 130-140.
Daniel WW 2005. Biostatistics: a Foundation for Analysis in the Health Sciences. 8th ed. New Jersey: John Wiley and Sons, Inc.
Deurenberg P, Weststrate JA, Seidell JC 1991. Body mass index as a measure of body fatness: age- and sex-specific prediction formulas. Brit. J. Nutr. (65): 105-114.
Deurenberg P, Yap M, van Staveren WA 1998. Body mass index and percent body fat: a meta analysis among different ethnic groups. Int. J. Obes. (22): 1164-1171.
Deurenberg P, Yap MD, Wang J, Lin FP, Schmidt G 1999. The impact of body build on the relationship between body mass index and percent body fat. Int. J. Obes. (23): 537-542. Deurenberg P, Deurenberg-Yap M, Wang J, Lin FP, Schmidt G
2000. Prediction of percentage body fat from anthropometry and bioelectrical impedance in Singaporean and Beijing Chinese. Asia Pacific J. Clin. Nutr. 9(2): 93-98.
Deurenberg-Yap M, Schmidt G, van Staveren WA, Hautvast JGAJ, Deurenberg P 2001. Body fat measurement among Singaporean Chinese, Malays and Indian: a comparative study using a four-compartment model and different two-compartment models. British J. Nutr. (85): 491-498.
Dierkes J, Schultink JW, Gross R, Praestowo, SMB, Pietrzik K 1993. Body composition of Indonesian adults assessed by skinfold thickness and bioelectrical impedance measurements and by a body mass index equation. Asia Pacific J. Clin. Nutr. (2): 171-176.
Durnin JVGA 1995. Appropriate technology in body composition: a brief review. Asia Pacific J. Clin. Nutr. (4): 1-5.
Durnin JVGA, Womersley J 1974. Body fat assessed from total body density and its estimation from skinfold thickness: measurements on 481 men and women aged from 16 to 72 years. Br. J. Nutr. 32: 77-97.
Fürst P, Leweling H 1995. The interplay between nutrition and body composition. Asia Pacific J. Clin. Nutr. (4): 95-101. Gallagher D, Visser M, Sepǔlveda D, Pierson RN, Harris T,
Heymsfield SB 1996. How useful is body mass index for comparison of body fatness across age, sex, and ethnic groups? Am. J. Epidemiol. 143 (3): 228-239.
Gurrici S, Hartriyanti Y, Hautvast JGAJ, Deurenberg P 1998. Relationship between body fat and body mass index: differences between Indonesians and Dutch Caucasians. Eur. J. Clin. Nutr. (52): 779-783.
Gurrici S, Hartriyanti Y, Hautvast JGAJ, Deurenberg P 1999. Differences in the relationship between body fat and body
mass index between two different Indonesian ethnic groups: The effect of body build. Eur. J. Clin. Nutr. (53): 468-472. Hastuti J, Jacob T, Aswin S 2005. Ciri-ciri antropometris dan
kapasitas vital penduduk di dataran tinggi Samigaluh dan dataran Rendah Galur. Sains Kesehataan 18(2): 261-76. Heyward VH, Wagner DR 2004. Applied Body Composition
Assessment, 2nd Edition. Champaign, IL: Human Kinetics, pp
68-75. mass index: the Heritage Family Study. Int. J. Obes. (26): 789-796.
Jacob T 2006. The nanosomic and microsomic archaeological and living populations of Indonesia, in Simanjuntak T, Hisyam M, Prasetyo B, Nastiti TS (eds): Archaeology: Indonesian Perspective, R.P. Soejono’s Festschrift. Indonesian Institute of Sciences (LIPI), pp 117-123.
Kesteloot H, Ndam N, Sasaki S, Kowo M, Seghers V 1996. A Survey of blood pressure distribution in pygmy and Bantu populations in Cameroon. Hypertention. 27: 108-113. Küpper J, Bartz M, Schultink JW, Lukito W, Deurenberg P 1998.
Measurements of body fat in Indonesian adults: Comparison between a three-compartment model and widely used methods. Asia Pacific J. Clin. Nutr. 7(1):49-54.
Larson I, Henning B, Lindroos AK, Näslund, Sjőstrőm CD, Individual and the Population. Cambridge: Cambridge Univ. Press., pp 1-6.
Lohman TG, Roche AF, Martorel R (Eds) 1988. Anthropometric Standardization Reference Manual. Champaign: Human Kinetics Books, pp 3-8.
Malina RM 2005. Variation in body composition associated with sex and ethnicity, in Heymsfield SB, Lohman TG, Wang Z, Going SB (eds): Human Body Composition, 2nd Edition.
Champaign, IL: Human Kinetics, pp 271-298.
Migliano AB, Vinicius L, Lahr MM 2007. Life history trade-offs explain the evolution of human pygmies. PNAS. 104 (51): 20216-20219.
Montagu FFA 1951. An Introduction to Physical Anthropology, 2nd
ed. Illinois: Charles C Thomas Pub., pp 311-318.
Olivier G 1969. Practical Anthropology. Illinois: Charles C Thomas Pub., pp 5-10 .
Pandey AK 2006. Anthropometry of female Onges of Little Andaman. Anthropologist. 8 (2): 99-102.
Pemerintah Kabupaten Gunung Kidul, available at
http://www.gunungkidulkab.go.id/
Prijatmoko D, Strauss BJG 1995. Using low-cost body composition technology for health surveillance. Asia Pacific J. Clin. Nutr. (4): 15-17.
Roche AF 1995. Body composition of ethnic groups in the US. Asia Pacific J. Clin. Nutr. (4): 63-67.
Rutishauser IHE 1995. Body composition in Aboriginal Australians. Asia Pacific J. Clin. Nutr. (4): 73-76.
Island, East Nusa Tenggara Province. Faculty of Medicine, Gadjah Mada University: Research Report, pp 1-10.
Sahani RK 2003. Nutritional and health status of the Jarawas. J. Anth. Survey of India. 52: 47-65.
Schultink W, van Raaij JMA 1995. Seasonal changes in body weight, body mass index (BMI) and body composition of rural Beninese women. Asia Pacific J. Clin. Nutr. (4): 89-84. Schutz Y, Kyle UUG, Pichard C 2002. Fat-free mass index and fat
mass index percentiles in Caucasians aged 18-98 y. Int. J. Obes. (26): 953-960.
Shen W, St-Onge M-P, Wang Z, Heymsfield SB 2005. Study of Body composition: an overview, in Heymsfield SB, Lohman
TG, Wang Z, Going SB (eds): Human Body Composition, 2nd
Edition. Champaign, IL: Human Kinetics, pp. 3-14.
Shephard RJ 2005. Body Composition in Biological Anthropology. Cambridge: Cambridge Univ. Press, pp 24-28.
Solomons NW, Mazariegos M 1995. Low-ccost appropriate technologies for body composition assessment: a field
research’s view. Asia Pacific J. Clin. Nutr. (4): 19-22.
Supariasa IDN, Bakri B, Fajar I 2001. Penilaian Status Gizi. Jakarta: EGC. Pp: 59-62.
Tanaka S, Togashi K, Rankinen T, Pérusse L, Leon AS, Rao DC, Skinner JS, Wilmore JH, Bouchard C 2002. Is adiposity at normal body weight relevant for cardiovascular disease risk? Int. J. Obes. (26): 176-183.
Tanphaichitr V, Leelahagul P 1995. Clinical needs and opportunities in assessing body composition. Asia Pacific J. Clin. Nutr. (4): 23-24.
Wang J, Thornton JC, Russel M, Burastero S, et al 1994. Asian have lower body mass index (BMI) but higher percent body fat
than do whites: Comparisons of anthropometric