PROVINSI SUMATERA UTARA DALAM ANGKA 2017
Sumatera Utara Province in Figures. 2017
. id. ISSN: 0215.2053 No. Publikasi/Publication Number: 12560.1703 Katalog /Catalog: 1102001.12. .b. Penyunting/Editor: BPS Provinsi Sumatera Utara BPS-Statistics of Sumatera Utara Province. ps .g. Naskah/Manuscript: BPS Provinsi Sumatera Utara BPS-Statistics of Sumatera Utara Province. o.. Ukuran Buku/Book Size: 14,8 cm x 21 cm Jumlah Halaman/Number of Pages : xlvi + 710 hal/pages. :// su m. ut. Gambar Kover/Cover Design: Bidang Integrasi Pengolahan dan Diseminasi Statistik Division of Integration Processing and Statistics Dissemination Ilustrasi Kover/Cover Illustration: Rumah Adat Batak/Batak Traditional House Diterbitkan oleh/Published by: ©BPS Provinsi Sumatera Utara/BPS-Statistics of Sumatera Utara Province. ht. tp. Dicetak oleh/Printed by: CV. New Creative. Dilarang mengumumkan, mendistribusikan, mengomunikasikan, dan/atau menggandakan sebagian atau seluruh isi buku ini untuk tujuan komersil tanpa izin tertulis dari Badan Pusat Statistik. Prohibited to announce, distribute, communicate, and/or copy part or all of this book for commercial purpose without permission from BPS-Statistics Indonesia.. .b. ut. :// su m. tp. ht. id. o.. ps .g. .b. ut. :// su m. tp. ht. id. o.. ps .g. .b. ut. :// su m. tp. ht. id. o.. ps .g. .b. ut. :// su m. tp. ht. id. o.. ps .g.
KATA PENGANTAR
. id. Publikasi Provinsi Sumatera Utara Dalam Angka 2017 merupakan publikasi rutin yang diterbitkan setiap tahunnya oleh BPS Provinsi Sumatera Utara untuk memenuhi kebutuhan informasi seluruh lapisan masyarakat dan sebagai salah satu wujud akuntabilitas dan kinerja dalam pelayanan publik.. ut. .b. ps .g. o.. Pada saat ini, kebutuhan data statistik dari setiap sektor pembangunan, semakin dirasakan, dan hal ini telah memotivasi BPS Provinsi Sumatera Utara untuk terus melengkapi dan menyempurnakan data yang disajikan, baik dari sisi kuantitas maupun kualitasnya. Data yang disajikan bersumber dari kegiatan rutin, survei, dan sensus yang dilaksanakan oleh BPS Provinsi Sumatera Utara, dan dilengkapi dengan data sekunder yang dihimpun dan dikelola oleh instansi pemerintah dan swasta di wilayah Provinsi Sumatera Utara. Secara garis besar, publikasi ini memuat informasi statistik tentang kondisi geografis, pemerintahan, kependudukan, ketenagakerjaan, pertanian, industri, pertambangan, energi, konstruksi, air minum, listrik, perhubungan dan komunikasi, perbankan, dan produk domestik regional bruto. Semua ini, diharapkan akan dapat menjadi bahan baku pokok dalam perencanaan pembangunan sektoral dan lintas sektoral di wilayah Provinsi Sumatera Utara.. :// su m. Pada kesempatan ini kami menyampaikan penghargaan dan mengucapkan banyak terima kasih kepada instansi pemerintah dan swasta wilayah Provinsi Sumatera Utara serta semua pihak yang telah memberikan bantuan dan kerja sama hingga publikasi ini dapat terwujud.. ht. tp. Saran dan kritik dari berbagai pihak dalam rangka perbaikan publikasi ini di masa mendatang, sangat diharapkan. Akhirnya, kami berharap semoga penyajian publikasi ini dapat membantu dalam memenuhi kebutuhan data statistik, baik untuk instansi pemerintah maupun swasta, serta bermanfaat bagi para pengguna data lainnya.. Medan, Agustus 2017 Kepala Badan Pusat Statistik Provinsi Sumatera Utara. Dr. Syech Suhaimi. Provinsi Sumatera Utara Dalam Angka 2017. vii.
PREFACE
. id. Sumatera Utara Province in Figures 2017 is an annual publication issued by BPS-Statistics of Sumatera Utara Province. This publication is intended to fulfill information needed by whole community. In another view, this is a product of accountability and performance in public service.. ut. .b. ps .g. o.. It has been realized that the demand for statistics from all sectors has increased, and this encourages us to fulfill and complete the data, both in terms of quantity as well as of quality. The data are primarily compiled from routine activities, surveys and censuses conducted by BPS-Statistics of Sumatera Utara Province. However, the secondary-data sources, compiled by public and private institutions in Sumatera Utara Province, are also utilized. Briefly, the publication contains statistical information on geographic condition, government, population, manpower, agriculture, manufacture, mining, energy, construction, water supply, electricity, transportation and communication, inflation, finance and banking, and gross regional domestic product. Hence, these all become a main resource for inter and intra-sectors development plan in Sumatera Utara Province.. :// su m. On this occasion, I would like to express appreciation and my gratitude to public and private institutions in Sumatera Utara Province and all parties that support the publishing of this book.. ht. tp. Any suggestions and critics to improve this publication will be cordially welcomed. I hope this publication will meet the needs the demand for statistical data of public and private institutions, and also be useful and valuable to the data users.. Medan, August 2017 Chief Statistician of Sumatera Utara Province. Dr. Syech Suhaimi. viii. Sumatera Utara Province in Figures 2017.
DAFTAR ISI/CONTENTS
Halaman Page iii. Foto Kepala BPS Provinsi Sumatera Utara/Photograph of The Chief Statistician of Sumatera Utara Province ..................................................................................... v. Kata Pengantar Kepala Badan Pusat Statistik Provinsi Sumatera Utara/Preface of The Chief Statistician of Sumatera Utara Province .................................................. vii. id. Peta Provinsi Sumatera Utara/ Map of Sumatera Utara Province ............................ ix. Daftar Tabel/List of Tables ....................................................................................... xi. o.. Daftar Isi/Content ..................................................................................................... Daftar Gambar/List of Figures ................................................................................. xxxix xlv. Statistik Kunci/Key Statistics .................................................................................... 1. ps .g. Penjelasan Umum/Explanatory Notes ...................................................................... Geografi dan Iklim/Geography and Climate ............................................................3. 2.. Pemerintahan/Government ....................................................................................... 21. 3.. Penduduk dan Tenaga Kerja/Population and Man Power ....................................... 47. 4.. Sosial/Social ............................................................................................................ 89. 5.. Pertanian/Agriculture ............................................................................................... 175. 6.. Perindustrian/Manufacturing ................................................................................... 273. 7.. Perdagangan/Trade .................................................................................................. 329. 8.. Hotel dan Pariwisata/Hotel and Tourism ................................................................. 391. 9.. Perhubungan dan Komunikasi/Transportation and Comunication .......................... 431. tp. :// su m. ut. .b. 1.. Keuangan dan Harga-harga/Finance and Price ....................................................... 479. 11.. Konsumsi Penduduk/Population Consumtion .......................................................... 565. 12.. Pendapatan Regional/Regional Income .................................................................... 579. 13.. Perbandingan Nasional/National Comparison ......................................................... 629. ht. 10.. Lampiran/Appendix .................................................................................................. Provinsi Sumatera Utara Dalam Angka 2017. 663. ix.
(11) .b. ut. :// su m. tp. ht. id. o.. ps .g.
DAFTAR TABEL/LIST OF TABLES
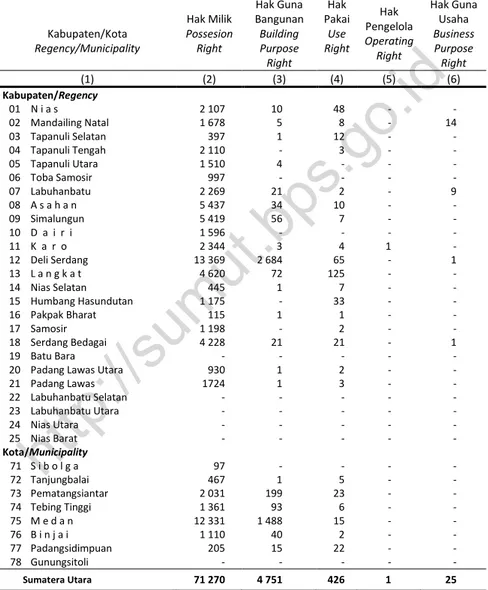
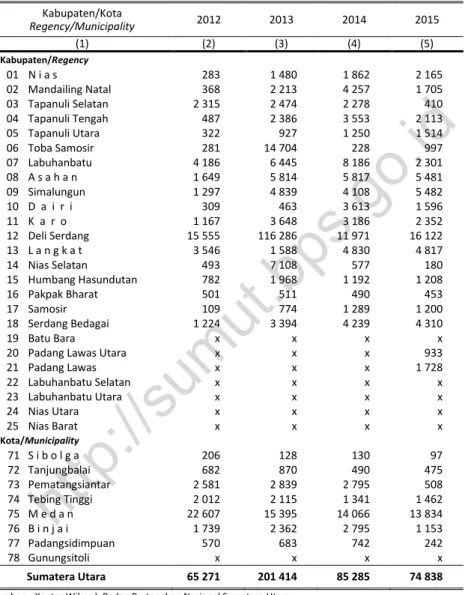
Halaman Page 1.. GEOGRAFI DAN IKLIM/GEOGRAPHY AND CLIMATE LOKASI DAN KEADAAN GEOGRAFI LOCATION AND GEOGRAPHICAL CONDITION. 1.1.1. Letak Geografis, 2016 Geographical Location, 2016 ................................................................................................. 9 Jarak dari Ibukota Kabupaten/Kota ke Ibukota Provinsi Sumatera Utara (km), 2016 10 The Distance From Capital of The Regency/Municipality to The Capital of Sumatera Utara Province (km), 2016 ...................................................................................... Luas Daerah menurut Kabupaten/Kota, 2016 Area of Regency/Municipality, 2016 ........................................................................................ 11 Letak Geografis menurut Kabupaten/Kota, 2016 Geographical Location of Regency/Municipality, 2016 .......................................................... 12. 1.1.4. o.. 1.1.3. ps .g. 1.1.2. id. 1.1. IKLIM/CLIMATE. 1.2.1. Ketinggian dari Permukaaan Laut menurut Stasiun dan Suhu Udara, 2016 Height above Sea Surface by Station and Temperature,2016 ................................................. 13 Rata-rata Kelembaban Udara, Curah Hujan, Penyinaran Matahari, Kecepatan Angin dan Penguapan menurut Stasiun, 2016 Average Humidity, Rainfall, Sunshine, Wind VeloMunicipality, and Evaporation by Station, 2016 ....................................................................................................................... 14 Curah Hujan dan Banyaknya Hari Hujan di Kota Medan, 2016 Rainfall and Number of Rainy Days in Medan Municipality, 2016.......................................... 15 Suhu Udara di Stasiun BBMKG Wil. I Medan menurut Tahun/Bulan, Waktu, Maksimum dan Minimum (ºC), 2016 Temperature in BBMKG Wil. I Medan Station by Year/Month, Time, Maximum, 16 and Minimum (ºC), 2016 ........................................................................................................ Suhu Udara di Stasiun Klimatologi Deli Serdang menurut Tahun/Bulan, Waktu, Maksimum, dan Minimum (ºC), 2016 Temperature in Deli Serdang Climatology Station by Year/Month, Time, Maximum, and Minimum (o C), 2016 ...................................................................................... 17 Jumlah Gempa Bumi di Sumatera Utara dan Sekitarnya, 2012-2016 Number of Earthquakes in North Sumatera and Surroundings Area,2012- 2016 .................... 18. 1.2.3 1.2.4. ut. ht. tp. 1.2.5. :// su m. 1.2.2. .b. 1.2. 1.2.6 1.3. PERTANAHAN/LAND. 1.3.1. Status Pemilikan Tanah Dirinci menurut Jenis Hak di Kabupaten/kota (ha), 2015 Land Possession by Type of Rights and Regency/Municipality (ha), 2015............................... 19 Jumlah Sertifikat Hak Atas Tanah dan Luas Tanah, 2012-2015 Number of Rights on Land Certificate and Area, 2012-2015 ................................................... 20. 1.3.2. Provinsi Sumatera Utara Dalam Angka 2017. xi.
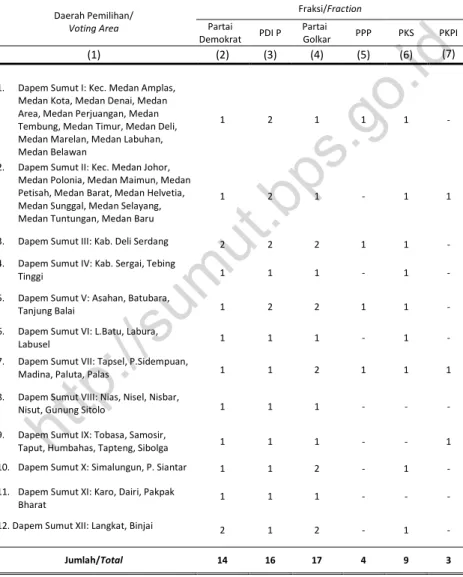
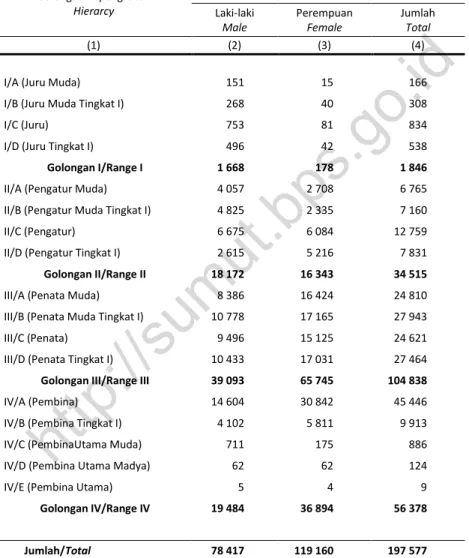
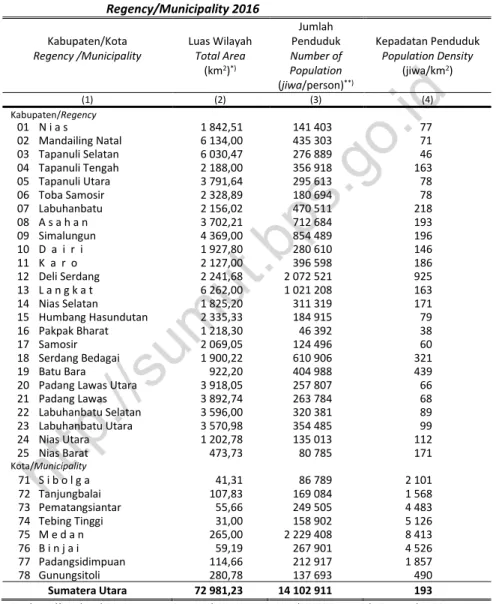
(13) 2.. PEMERINTAHAN/GOVERNMENT. 2.1. WILAYAH ADMINISTRATIF/ADMINISTRATIVE AREA. 2.1.1. Banyaknya Kecamatan dan Desa/Kelurahan menurut Kabupaten/ Kota, 2016 Number of District and Villages/Suburbans by Regency/ Municipality, 2016 ......................... 31. 2.2. DPRD PROVINSI/PROVINCIAL PARLIAMENT. 2.2.1. Jumlah Anggota DPRD Provinsi menurut Fraksi dan Daerah Pemilihan, 2016 Number of Provincial Parliament Member by Fraction and Voting Area, 2016...................... 32 Jumlah Anggota DPRD Provinsi menurut Jenis Kelamin dan Daerah Pemilihan, 2016 Number of Provincial Parliament Member by Sex and Voting Area, 2016 .............................. 34 Jumlah Keputusan DPRD Provinsi menurut Jenis Keputusan, 2012-2016 Number of Provincial Parliament Decree by Type, 2012-2016 .............................................. 35 Kegiatan DPRD Provinsi, 2012-2016 Activity of Province Parliament, 2012-2016 ............................................................................ 36 Banyaknya Anggota DPRD Provinsi/Kab/Kota di Provinsi Sumatera Utara menurut Jenis Kelamin, 2016 Number Of Members of DPRD and Regency/Municipality in Sumatera Utara Province by Sex, 2016 ............................................................................................................. 37. id. 2.2.2. o.. 2.2.3. ps .g. 2.2.4. .b. 2.2.5. SUMBER DAYA MANUSIA/HUMAN RESOURCES. 2.3.1. Jumlah Pegawai Negeri Sipil Daerah Menurut Kabupaten/Kota dan Jenis Kelamin (orang), 2016 Number of Civil Servant by Regency/Municipality and Sex (person), 2016 ............................ 38 Jumlah Pegawai Negeri Sipil Daerah menurut Pendidikan Tertinggi yang ditamatkan dan Jenis Kelamin (orang), 2016 Number of Civil Servant by Educational Attaiment and Sex (person), 2016 ........................... 39 Jumlah Pegawai Negeri Sipil Daerah menurut Golongan Kepangkatan dan Jenis Kelamin (orang), 2016 Number of Civil Servant by Hierarcy and Sex (person), 2016 ................................... 40 Banyaknya Pegawai Negeri Sipil Daerah (Otonomi) menurut Golongan (orang), 2016 Number of Regional Civil Servant by Rank of Civil Servant (person), 2016 ............... 41 Jumlah PNS Daerah Otonom di Lingkungan Provinsi Sumatera Utara menurut Tingkat Pendidikan (orang), 2016 Number of Regional Civil Servant in Sumatera Utara Province by Aducational Ettainment (person), 2016 ....................................................................................................... 44. ut. 2.3. :// su m. 2.3.2 2.3.3. tp. 2.3.4. ht. 2.3.5. 3. 3.1 3.1.1. 3.1.2. xii. PENDUDUK DAN KETENAGAKERJAAN/POPULATION AND EMPLOYMENT PENDUDUK / POPULATION Luas Wilayah, Jumlah Penduduk, dan Kepadatan Penduduk menurut Kabupaten/Kota, 2016 Total Area, Number of Population and Population Density by Regency/Municipality 2016 ..................................................................................................... 61 Jumlah Penduduk dan Rumah Tangga menurut Kabupaten/Kota, 2016 Number of Population and Number of Households by Regency/Municipality 2016................. 62. Sumatera Utara Province in Figures 2017.
(14) 3.1.9 3.1.10 3.1.11. 3.1.12. 3.1.13 3.1.14. id. 3.1.8. o.. 3.1.7. ps .g. 3.1.6. .b. 3.1.5. ut. 3.1.4. Jumlah Penduduk menurut Kelompok Umur dan Jenis Kelamin (jiwa), 2016 Number of Population by Type of Age Group and Sex (person), 2016 ..................... 63 Jumlah Penduduk menurut Jenis Kelamin, Rasio Jenis Kelamin dan Kabupaten/Kota (jiwa) , 2016 Number of Population by Type of Sex, Sex Ratio and Regency/Municipality (person), 2016.......................................................................................................................... 64 Jumlah Penduduk Daerah Perkotaan dan Perdesaan menurut Kabupaten/Kota (jiwa), 2016 Number of Population Urban and Rural by Regency/Municipality (person), 2016 .. 65 Jumlah Penduduk menurut Kabupaten/Kota (jiwa), 1980 - 2010 Number of Population by Regency/Municipality (person), 1980 – 2010 ................................. 66 Pertumbuhan Penduduk Menurut Kabupaten/Kota (%),1980 - 2010 Population Growth by Regency/Municipality (%), 1980 – 2010 ............................................. 67 Perkiraan Angka Harapan Hidup menurut Kabupaten/Kota (tahun), 2014–2016 Estimation of Life Expectancy by Regency Municipality (year), 2014–2016 .......................... 68 Komponen Indeks Pembangunan Manusia (IPM) menurut Kabupaten/Kota, 2016 Component of Human Development Index (HDI) by Regency/Municipality, 2016 ................. 69 Indeks Pembangunan Manusia (IPM) menurut Kabupaten/Kota, 2012-2016 Human Development Index (HDI) by Regency/Municipality, 2012-2016 ............................... 70 Persentase Wanita Berumur 15-49 Tahun yang Berstatus Pernah Kawin Menurut Kabupaten/Kota dan Penolong Kelahiran Anak Lahir Hidup Terakhir, 2016 Percentage of Ever Married Women Aged 15-49 Years by Regency/Municipality and and The First Birth Attendant, 2016 ................................................................................. 71 Persentase Penduduk yang Masih Sekolah menurut Kabupaten/Kota dan Kelompok Umur (%), 2016 Percentage of Population Attending Schoolby Regency/Municipality and Age Group (%), 2016 ........................................................................................................ 72 Angka Partisipasi Kasar (APK) menurut Kabupaten/Kota, 2016 Gross Enrolment Rate by Regency/Municipality, 2016 .............................................. 73 Angka Partisipasi Murni (APM) menurut Kabupaten/Kota, 2016 Net Enrolment Rate by Regency/Municipality, 2016.................................................. 74. :// su m. 3.1.3. KETENAGAKERJAAN / EMPLOYMENT. 3.2.1. Banyaknya Penduduk Umur 15 Tahun ke Atas menurut Jenis Kegiatan (jiwa), 2013 - 2016 Number of Population Aged 15 Years and Over by Kind of Activity (person), 2013 – 2016 ............................................................................................................................. 75 Jumlah Penduduk Berumur 15 Tahun ke Atas menurut Jenis Kelamin dan Kegiatan Seminggu yang Lalu (jiwa), 2016 Number of Population Aged 15 Years Old and Over by Sex and Type of Activity During the Previous Week (person), 2015 ............................................................................... 76 Penduduk Berumur 15 Tahun ke Atas menurut Kabupaten/Kota, dan Jenis Kegiatan Seminggu yang Lalu (jiwa), 2015 Population 15 Years of Age and Overby Regency/Municipality, and Type of Activity During the Previous Week (person), 2015 ................................................... 77 Tingkat Partisipasi Angkatan Kerja (TPAK) dan Tingkat Pengangguran Terbuka (TPT) Penduduk Umur 15 Tahun ke Atas menurut Kabupaten/Kota (%), 2014 - 2015 Labour Force Participation Rate and Open Employee Rate 15 Years of Aged and Over by Regency/Municipality (%), 2014 – 2015 .................................................................... 78. tp. 3.2. ht. 3.2.2. 3.2.3. 3.2.4. Provinsi Sumatera Utara Dalam Angka 2017. xiii.
(15) 3.2.5. Persentase Angkatan Kerja Berumur 15 Tahun ke Atas menurut Jenis Kelamin dan Pendidikan Tertinggi yang Ditamatkan (%), 2016 Percentage Economically Activate Person Aged 15 Years by Sex and Level of Education (%), 2016 .................................................................................................. 79 Persentase Penduduk Umur 15 Tahun ke Atas yang Bekerja menurut Lapangan Usaha dan Jenis Kelamin (%), 2016 Percentage of Working Population Aged 15 Years and Over by Industry and Sex (%), 2016 ................................................................................................................................. 80 Persentase Penduduk Berumur 15 Tahun ke Atas yang Bekerja Selama Seminggu yang Lalu menurut Jenis Kelamin dan Status Pekerjaan Utama (%), 2016 Percentage of Working Population Aged 15 Years Old and Over Who Worked During the Previous Week by Sex and Type of Main Employment Status (%), 2016 ......................................................................................................................................... 81 Persentase Penduduk yang Berusia 15 Tahun ke Atas yang Bekerja menurut Lapangan Pekerjaan Utama (%), 2015 – 2016 Percentage of Population Aged 15 Years Old and Over Who Worked by Type of Main Industry (%), 2015 – 2016 .............................................................................................. 82 Persentase Penduduk Berumur 15 Tahun ke Atas yang Bekerja Selama Seminggu yang Lalu menurut Kabupaten/Kota, dan Kelompok Lapangan Usaha (%), 2016 Percentage of Population 15 Years of Aged and Over Who Worked During the Previous Week by Regency/Municipality, and Main Industry Group (%), 2016...................... 83 Jumlah Warga Asing menurut Izin Kerja dan Kewarganegaraan (jiwa), 2016 Number of Foreign Resident by Working Permit and Citizenship (person), 2016 ................... 84 Jumlah Warga Asing menurut Jabatan dan Izin Kerja (jiwa), 2016 Number of Foreign Resident by Occupation and Working Permit (person), 2016 ................... 85 Jumlah Pencari Kerja Terdaftar menurut Jenis Kelamin dan Tingkat Pendidikan (jiwa), 2016 Number of Registered Job Seekers by Sex and Education Level (/person), 2016 ....... 86 Jumlah Pencari Kerja Terdaftar menurut Jenis Kelamin dan Kabupaten/Kota (jiwa), 2016 Number of Registered Job Seekers by Sex and Regency/Municipality (person), 2016 .......................................................................................................................... 87 Upah Minimum Provinsi (UMP) dan Upah Minimum Kabupaten/Kota (UMK) menurut Kabupaten/Kota (rupiah), 2014-2016 Provincial Minimum Wage (UMP) and the Regency/Municipality Minimum Wages (UMK) by Regency / Municipality (rupiahs), 2014-2016………………… 88. 3.2.6. id. 3.2.7. o.. 3.2.8. ps .g. 3.2.9. 3.2.10. .b. 3.2.11. ut. 3.2.12. 3.2.14. SOSIAL DAN KESEJAHTERAAN RAKYAT / SOCIAL AND WELFARE. ht. 4.. tp. :// su m. 3.2.13. 4.1. PENDIDIKAN / EDUCATION. 4.1.1. Jumlah Sekolah, Guru dan Murid Sekolah Dasar (SD) menurut Kabupaten/Kota, 2016 Number of Schools, Teachers, and Pupils in Elementary School by Regency/Municipality, 2016 .................................................................................................... 111 Jumlah Sekolah, Guru dan Murid Sekolah Menengah Pertama (SMP) Dirinci menurut Kabupaten/Kota, 2016 Number of Schools, Teachers and Pupils in Junior High School by Regency/Municipality, 2016 ..................................................................................... 112. 4.1.2. xiv. Sumatera Utara Province in Figures 2017.
(16) 4.1.8 4.1.9. 4.1.10 4.1.11. 4.1.12. id. tp. 4.1.13. o.. 4.1.7. ps .g. 4.1.6. .b. 4.1.5. ut. 4.1.4. Jumlah Sekolah, Guru dan Murid Sekolah Menengah Atas (SMA) Dirinci menurut Kabupaten/Kota, 2016 Number of Schools,Teachers, and Pupils in General Senior High School By Regency/Municipality, 2016 .................................................................................................... 113 Jumlah Sekolah, Guru dan Murid Sekolah Menengah Kejuruan (SMK) Dirinci menurut Kabupaten/Kota, 2016 Number of Schools, Teachers, and Pupils in Vocational Senior High School by Regency/ Municipality, 2016 ................................................................................................... 114 Jumlah Murid Taman Kanak-Kanak dan Sekolah Dasar menurut Kabupaten/Kota, 2016 Number Pupils of Kindergartens and Pupils of Elementary School by Regency/Cit, 2016 ......................................................................................................................................... 115 Jumlah Murid Sekolah Menengah Pertama (SMP) dan Sekolah Menengah Atas (SMA) menurut Jenis Kelamin dan Kabupaten/Kota, 2016 Number of Pupils in Junior High School and Senior High School by Sex and Regency/Municipality, 2016 .................................................................................................... 116 Jumlah Guru Sekolah Dasar menurut Ijazah Tertinggi, 2016 Number of Teachers in Primary School by Education Level, 2016 .......................................... 117 Jumlah Sekolah Dasar (SD) dan Lokal menurut Kabupaten/Kota, 2016 Number of Primary Schools and Rooms by Regency/Municipality, 2016 .................. 118 Rasio Murid Sekolah Dasar (SD) Terhadap Sekolah, Lokal, dan Guru menurut Kabupaten/Kota, 2016 Ratio of Pupils in Elementary School to Schools, Rooms, and Teachers by Regency/Municipality, 2016 ...................................................................................... 119 Jumlah Sekolah Menengah Pertama (SMP) dan Lokal menurut Kabupaten/Kota 2016 Number of Junior High Schools and Rooms by Regency/Cit, 2016............................ 120 Rasio Murid Sekolah Menengah Pertama (SMP) Terhadap Sekolah, Lokal dan Guru menurut Kabupaten/Kota, 2016 Ratio of Pupils in Junior High School To Schools, Rooms, and Teachers by Regency/Municipality, 2016 ...................................................................................... 121 Jumlah Sekolah Menengah Atas (SMA) dan Lokal menurut Kabupaten/Kota, 2016 Number of Senior High Schools and Rooms by Regency/Municipality, 2016 ............ 122 Rasio Murid Sekolah Menengah Atas (SMA) Terhadap Sekolah, Lokal, dan Guru menurut Kabupaten/Kota, 2016 Ratio of Pupils in Senior High School to Schools, Rooms, and Teachers by Regency/Municipality, 2016 ...................................................................................... 123 Jumlah Sekolah Menengah Kejuruan (SMK) dan Lokal menurut Kabupaten/Kota, 2016 Number of Senior High Schools and Rooms by Regency/Municipality, 2016 ............ 124 Rasio Murid Sekolah Menengah Kejuruan (SMK) Terhadap Sekolah, Lokal, dan Guru menurut Kabupaten/Kota, 2016 Ratio of Pupils in Senior High School to Schools, Rooms, and Teachers by Regency/Municipality, 2016 ...................................................................................... 125 Jumlah Sekolah, Guru dan Murid Madrasah Ibtidaiyah (MI) menurut Kabupaten/Kota, 2016 Number of Schools, Teachers, and Pupils in Islamic Elementary School by Regency/Municipality, 2016 ...................................................................................... 126 Jumlah Sekolah, Guru dan Murid Madrasah Tsanawiyah (MTs) menurut Kabupaten/Kota, 2016 Number of Schools, Teachers and Pupils in Islamic Junior High School by Regency/Municipality, 2016 ............................................................. 127. :// su m. 4.1.3. ht. 4.1.14 4.1.15. 4.1.16. 4.1.17. Provinsi Sumatera Utara Dalam Angka 2017. xv.
(17) 4.1.22 4.1.23. id. 4.1.21. o.. 4.1.20. ps .g. 4.1.19. Jumlah Sekolah, Guru dan Murid Madrasah Aliyah (MA) Dirinci menurut Kabupaten/Kota, 2016 Number of Schools,Teachers, and Pupils in Islamic Senior High School by Regency/Municipality, 2016 ...................................................................................... Jumlah Mahasiswa, Dosen dan Rasio Mahasiswa Terhadap Dosen di Universitas Sumatera Utara, 2006/2007 - 2016/2017 Number of Student, Lecturer and Ratio of Student to Lecturer at University of Sumatera Utara 2006/2007 - 2016/2017 .................................................................. Jumlah Mahasiswa, Dosen dan Rasio Mahasiswa Terhadap Dosen di Unimed Medan, 2006/2007 - 2016/2017 Number of Student, Lecturer and Ratio of Student to Lecturer at State University of Medan , 2006/2007 - 2016/2017 ................................................................................ Jumlah Mahasiswa, Dosen dan Rasio Mahasiswa Terhadap Dosen di UIN Sumatera Utara, 2006/2007 - 2016/2017 Number of Student, Lecturer and Ratio of Student to Lecturer at State Islamic University of Sumatera Utara, 2006/2007 - 2016/2017 ............................................ Jumlah Fakultas dan Jurusan / Program Studi UIN Sumatera Utara, 2016/2017 Programme and Faculty at State Islamic University of Sumatera Utara, 2016/2017 .................................................................................................................. Jumlah Perguruan Tinggi Swasta, Mahasiswa dan Dosen menurut Jenis Perguruan Tinggi se-Sumatera Utara, 2016/2017 Number of Private University, Students and Lecturers by Type of University in Sumatera Utara, 2016/2017 ...................................................................................... KESEHATAN / HELATH. 4.2.1. Jumlah Rumah Sakit Umum menurut Kabupaten/Kota (unit), 2016 Number of General Hospital by Regency/Municipality (unit), 2016 .......................... Banyaknya Pusat Kesehatan Masyarakat dan Sejenisnya menurut Kabupaten/Kota (unit), 2016 Number of Public Health Centre and Similar by Regency/Municipality (unit), 2016 Banyaknya Dokter menurut Kabupaten/Kota, 2016 Number of State Physician by Regency/Municipality, 2016 ....................................... Jumlah Bidan dan Perawat menurut Kabupaten/Kota, 2016 Number of Midwives and Nurses by Regency/Municipality, 2016 ............................ Banyaknya Apotik, Apoteker dan Sarjana Lain menurut Kabupaten/Kota, 2016 Number of Dispensary, Pharmacist and Other Non-Medical Graduates by Regency/Municipality, 2016 ...................................................................................... Persentase Balita Yang Pernah Mendapat Imunisasi menurut Kabupaten/Kota dan Jenis Imunisasi, 2016 Percentage of Children Under Five Years Who Had Immunization by Regency/Municipality and Type of Immunization, 2016 ........................................... Jumlah Bayi Lahir, Bayi Berat Badan Lahir Rendah (BBLR), BBLR Dirujuk, dan Bergizi Buruk menurut Kabupaten/Kota di Provinsi Sumatera Utara, 2016 Number of Births, Babies with Low Birth Weights (LBW), Treated LBW, and Malnutrion Cases by Regency/Municipality in Sumatera Utara Province, 2016 ...... Jumlah Ibu Hamil, Melakukan Kunjungan K1, Melakukan Kunjungan K4, Kurang Energi Kronis (KEK), dan Mendapat Tablet Zat Besi (Fe) di Provinsi Sumatera Utara, 2012‒2016 Number of Pregnant Women, Those with One Visit and four Visits of Antenatal Care, Chronic Energy Deficiency (CED), and Receiving Iron Supplement in Sumatera Utara, 2012-2016 ....................................................................................... 4.2.5. ht. 4.2.6. :// su m. 4.2.4. tp. 4.2.3. ut. 4.2. 4.2.2. 4.2.7. 4.2.8. xvi. 128. 129. 130. 131 132. 133. .b. 4.1.18. Sumatera Utara Province in Figures 2017. 134 135 136 137 138. 139. 140. 141.
(18) 4.2.9. Jumlah Kasus HIV/AIDS, IMS, DBD, Diare, TB, dan Malaria menurut Kabupaten/Kota di Provinsi Sumatera Utara, 2016 Number of Cases of HIV/AIDS, Sexually Transmited Infection, Dengue Fever, Diarhea, Tuberculosis (TB) and Malaria by Regency/Municipality in Sumatera Utara Province, 2016 ................................................................................................ PERUMAHAN DAN LINGKUNGAN / HOUSING AND ENVIRONMENT. 4.3.1. Persentase Rumah Tangga menurut Sumber Air Minum dan Kabupaten/Kota (%), 2016 Percentage of Households by Source of Drinking Water and Regency/Municipality (%), 2016 ................................................................................................................... Persentase Rumah Tangga menurut Dinding Terluas dan Kabupaten/Kota (%), 2016 Percentage of Households by Material of the Wall and Regency/Municipality (%), 2016 ........................................................................................................................... Persentase Rumah Tangga menurut Jenis Lantai Terluas dan Kabupaten/Kota (%), 2016 Percentage of Households by Material of the Floor and Regency/Municipality (%), 2016 ........................................................................................................................... Persentase Rumah Tangga menurut Sumber Penerangan dan Kabupaten/Kota (%), 2016 Percentage of Households by Source of Lighting and Regency/Municipality (%), 2016…………………………………………………………………………………. Persentase Rumah Tangga menurut Tempat Pembuangan Tinja dan Kabupaten/Kota (%), 2016 Percentage of Households by Final Disposal of Feces and Regency/Municipality (%), 2016 .................................................................................................................... 4.3.4. o.. :// su m. ut. 4.3.5. ps .g. 4.3.3. .b. 4.3.2. id. 4.3. 4.4. KELUARGA BERENCANA / FAMILY PLANNING. 4.4.1. Banyaknya Pasangan Usia Subur (PUS) dan Akseptor Aktif, 2008 - 2016 Number of Fertile Couple and Active Acceptor, 2008 - 2016 .................................... Jumlah Klinik Keluarga Berencana, Akseptor Aktif menurut Alat Kontrasepsi yang Dipakai dan Kabupaten/Kota, 2016 Number of Family Planning Clinics and Active Acceptors by Type of Contraceptive Used and Regency/Municipality, 2016....................................................................... Akseptor Baru menurut Alat Kontrasepsi yang Dipakai dan Kabupaten/Kota, 2016 Number of New Acceptors by Type of Contraceptive Used and Regency/Municipality, 2016 ...................................................................................... Jumlah Institusi KB di Lapangan menurut Kabupaten/Kota, 2016 Number of Family Planning Institution by Regency/Municipality, 2016..................... tp. 4.4.2. ht. 4.4.3 4.4.4. 142. 143. 144. 145. 146. 147. 148. 149 151 153. 4.5. KRIMINALITAS / CRIME. 4.5.1. Banyaknya Peristiwa Kejahatan/Pelanggaran yang Dilaporkan menurut Jenis Kejahatan/Pelanggaran, 2012- 2016 Number of Crime Reported by Type of Crime, 2012 - 2016 ..................................................... 154 Perkara Perdata yang Masuk dan telah Diputuskan menurut Daerah Pengadilan, 2016 Civil Case Reported and Solved by Region of State Court, 2016 .............................. 156. 4.5.2. Provinsi Sumatera Utara Dalam Angka 2017. xvii.
(19) 4.5.3. Perkara Pidana yang Masuk dan telah Diputuskan menurut Daerah Pengadilan, 2016 Criminal Case Reported and Solved by Region of State Court, 2016 ...................................... 158 Banyaknya Narapidana, Tahanan /Titipan menurut Jenis Kelamin, 2016 Number of Prisoners and Accused Persons by Sex, 2016 ....................................................... 159 Jenis Kejahatan yang Dilakukan Anak-Anak (Usia 18 tahun ke Bawah), 2016 Type of Crime that Doing by Children (Aged 18 years and under), 2016 ................................ 160 Perkara yang Masuk dan Diputuskan oleh Pengadilan Agama (PA) menurut Daerah Pengadilan Agama, 2016 Reported Case and Solved by Religious Court, 2016 .............................................................. 161. 4.5.4 4.5.5 4.5.6. AGAMA / RELIGION. 4.6.1. Banyaknya Nikah menurut Kabupaten/Kota, 2016 Number of Marriage by Regency/Municipality, 2016 .............................................................. 162 Banyaknya Rumah Ibadah menurut Kabupaten/Kota, 2016 Number of Places of Worship by Kind and Regency/Municipality, 2016…………..…. 163 Banyaknya Jemaah Haji menurut Kabupaten/Kota, 2016 Number of Moslem Pilgrims by Regency/Municipality, 2016 .................................................. 164 Jumlah Jemaah Haji dan Ongkos per Orang melalui Udara, 2005 - 2016 Number of Moslem Pilgrims and Cost per Person by Air, 2005 – 2016………... 165. id. 4.6. o.. 4.6.2. ps .g. 4.6.3 4.6.4. SOSIAL LAINNYA / OTHER SOCIAL AFFAIRS. 4.7.1. Banyaknya Penyandang Masalah Kesejahteraan Sosial menurut Kabupaten/Kota, 2016 Number of People with Social Problem by Regency/ Municipality, 2016 ................................ 166. 4.8. KEMISKINAN / POVERTY. 4.8.1. Jumlah Keluarga Pra Sejahtera/Sejahtera-1 menurut Kabupaten/Kota, 2016 Number of Pra Prosperous/1st Prosperous by Regency/ Municipality 2016 ............................ 171 Jumlah dan Persentase Penduduk Miskin di Sumatera Utara, 2010-2016 Number and Percentage of People Under Poverty Line 2010-2016………………….. 172 Jumlah dan Persentase Penduduk Miskin menurut Kabupaten/Kota, 2014 – 2016 Number and Percentage of People Under Poverty Line, 2014 – 2016..................................... 173 Jumlah Penduduk Miskin dan Garis Kemiskinan menurut Kabupaten/Kota,2016 People under Poverty dan Line Poorness by Regency/Municipality, 2016 .............................. 174. :// su m. ut. .b. 4.7. 4.8.2 4.8.3. ht. tp. 4.8.4. 5.. PERTANIAN / AGRICULTURE. 5.1. TANAMAN PANGAN / FOOD CROPS. 5.1.1. Luas Panen, Produksi dan Rata-Rata Produksi Padi Sawah menurut Kabupaten/Kota, 2016 Harvested Area, Production and Yield Rate of Wet Land Paddy by Regency/ Municipality, 2016 ................................................................................................................... 196 Luas Panen, Produksi dan Rata-Rata Produksi Padi Ladang menurut Kabupaten/Kota, 2016 Harvested Area, Production and Yield Rate of Dry Land Paddy by Regency/Municipality, 2016 ...................................................................................... 197. 5.1.2. xviii. Sumatera Utara Province in Figures 2017.
(20) 5.1.8. 5.1.9. 5.1.10 5.1.11 5.1.12. id. tp. 5.1.13. o.. 5.1.7. ps .g. 5.1.6. .b. 5.1.5. ut. 5.1.4. Luas Panen, Produksi dan Rata-Rata Produksi Padi Sawah + Ladang menurut Kabupaten/Kota, 2016 Harvested Area, Production and Average Yield Rate of Wet and Dry Land Paddy by Regency/Municipality, 2016 ................................................................................................ 198 Luas Panen, Produksi dan Rata-Rata Produksi Jagung menurut Kabupaten/Kota, 2016 Harvested Area, Production and Yield Rate of Corn by Regency/Municipality, 2016 ......................................................................................................................................... 199 Luas Panen, Produksi dan Rata-Rata Produksi Kacang Kedelai menurut Kabupaten/Kota, 2016 Harvested Area, Production and Yield Rate of Cassava by Regency/Municipality, 2016 ......................................................................................................................................... 200 Luas Panen, Produksi dan Rata-Rata Produksi Kacang Tanah menurut Kabupaten/Kota, 2016 Harvested Area, Production and Yield Rate of Sweet Potato by Regency/Municipality, 2016 .................................................................................................... 201 Luas Panen, Produksi dan Rata-Rata Produksi Kacang Hijau menurut Kabupaten/Kota, 2016 Harvested Area, Production and Yield Rate of Peanut by Regency/Municipality, 202 2016 ......................................................................................................................................... Luas Panen, Produksi dan Rata-Rata Produksi Ubi Kayu menurut Kabupaten/Kota, 2016 Harvested Area, Production and Yield Rate of Soybean by Regency/Municipality, 2016 ........................................................................................................................... 203 Luas Panen, Produksi dan Rata-Rata Produksi Ubi Jalar menurut Kabupaten/Kota, 2016 Harvested Area, Production and Yield Rate of Mungbean by Regency/Municipality, 2016 .................................................................................................... 204 Luas Panen, Produksi dan Rata-Rata Produksi Padi Sawah, 2007-2016 Harvested Area, Production and Yield Rate of Wet Land Paddy, 2007-2016 ........... 205 Luas Panen, Produksi dan Rata-Rata Produksi Padi Ladang, 2007-2016 Harvested Area, Production and Yield Rate of Dry Land Paddy, 2007-2016 .......................... 206 Luas Panen, Produksi dan Rata-Rata Produksi Jagung, 2007-2016 Harvested Area, Production and Yield Rate of Corn, 2007-2016 .............................. 207 Luas Panen, Produksi dan Rata-rata Produksi Kacang Kedelai, 2007-2016 Harvested Area, Production and Yield rate of Cassava, 2007-2016 ........................................ 208 Luas Panen, Produksi dan Rata-Rata Produksi Kacang Tanah, 2007-2016 Harvested Area, Production and Yield rate of Sweet Potato, 2007-2016................................. 209 Luas Panen, Produksi dan Rata-rata Produksi Kacang Hijau, 2007-2016 Harvested Area, Production and Yield rate of Peanut, 2007-2016 ........................... 210 Luas Panen, Rata-Rata Produksi dan Produksi Ubi Kayu, 2007-2016 Harvested Area, Production and Yield Rate of Soybean, 2007-2016 ........................ 211 Luas Panen, Produksi dan Rata-Rata Produksi Ubi Jalar, 2007-2016 Harvested Area, Production and Yield rate of Mungbean, 2007-2016 ...................... 212 Produksi Padi Sawah menurut Kabupaten/Kota (ton), 2012-2016 Production of Wet Land Paddy by Regency/Municipality (ton), 2012-2016 ............. 213 Produksi Padi Ladang menurut Kabupaten/Kota (ton), 2012-2016 Production of Dry Land Paddy by Regency/Municipality (ton), 2012-2016 ............. 214 Produksi Jagung menurut Kabupaten/Kota (ton), 2012-2016 Production of Corn by Regency/Municipality (ton), 2012-2016 ............................... 215. :// su m. 5.1.3. ht. 5.1.14 5.1.15 5.1.16 5.1.17 5.1.18 5.1.19 5.1.20. Provinsi Sumatera Utara Dalam Angka 2017. xix.
(21) 5.1.21 5.1.22 5.1.23 5.1.24 5.1.25. Produksi Kacang Kedelai menurut Kabupaten/Kota (ton), 2012-2016 Production of Cassava by Regency/Municipality (ton), 2012-2016 ........................... Produksi Kacang Tanah menurut Kabupaten/Kota (ton), 2012-2016 Production of Sweet Potato by Regency/Municipality (ton), 2012-2016 ................... Produksi Kacang Hijau menurut Kabupaten/Kota (ton), 2012-2016 Production of Peanut by Regency/Municipality (ton), 2012-2016 ............................ Produksi Ubi Kayu menurut Kabupaten/Kota (ton), 2012-2016 Production of Soybean by Regency/Municipality (ton), 2012-2016 .......................... Produksi Ubi Jalar menurut Kabupaten/Kota (ton), 2012-2016 Production of Mungbean by Regency/Municipality (ton), 2012-2016 ....................... HORTIKULTURA / HORTICULTURE. 5.2.1. Luas Panen, Produksi dan Rata-Rata Produksi Sayur-Sayuran menurut Jenis Tanaman, 2016 Harvested Area, Production and Yield Rate of Vegetables by Type of Plant,2016 ... Luas Panen Sayur-Sayuran menurut JenisTanaman (ha), 2012-2016 Harvested Area of Vegetables by Type of Plant (ha), 2012-2016 .............................. Rata-Rata Produksi Sayur-Sayuran menurut Jenis Tanaman (kw/ha), 2012-2016 Yield Rate of Vegetables by Type of Plant (kw/ha), 2012-2016 ................................. Produksi Sayur-Sayuran menurut Jenis Tanaman (ton), 2012-2016 Production Vegetables by Type of Plant (ton), 2012-2016 ........................................ Produksi Buah-Buahan menurut Jenis Tanaman (ton), 2012-2016 Production of Fruits by Type of Plant (ton), 2012-2016 ............................................ 5.2.4 5.2.5. o.. ps .g. 5.2.3. .b. 5.2.2. 217 218 219 220. id. 5.2. 216. 221 222 223 224 225. PERKEBUNAN / ESTATE CROPS. 5.3.1. Luas Tanaman dan Produksi Karet Tanaman Perkebunan Rakyat menurut Kabupaten/Kota, 2016 Planting Area and Production of Rubber Smallholders Estates by Regency/Municipality 2016 .................................................................................................... 226 Luas Tanaman dan Produksi Kelapa Sawit Tanaman Perkebunan Rakyat menurut Kabupaten/Kota, 2016 Planting Area and Production of Palm Oil Smallholders Estates by Regency/Municipality, 2016 .................................................................................................... 227 Luas Tanaman dan Produksi Kopi Robusta Tanaman Perkebunan Rakyat menurut Kabupaten/Kota, 2016 Planting Area and Production of Coffee Smallholders Estates by Regency/Municipality, 2016 .................................................................................................... 228 Luas Tanaman dan Produksi Kopi Arabika Tanaman Perkebunan Rakyat menurut Kabupaten/Kota, 2016 Planting Area and Production of Coffee Smallholders Estates by Regency/Municipality, 2016 .................................................................................................... 229 Luas Tanaman dan Produksi Kelapa Tanaman Perkebunan Rakyat menurut Kabupaten/Kota, 2016 Planting Area and Production of Coconut Smallholders Estates by Regency/Municipality, 2016 .................................................................................................... 230 Luas Tanaman dan Produksi Coklat Tanaman Perkebunan Rakyat menurut Kabupaten/Kota, 2016 Planting Area and Productionof Cocoa Smallholders Estates by Regency/Municipality, 2016 ................................................................................................... 231. ht. 5.3.4. :// su m. 5.3.3. tp. 5.3.2. ut. 5.3. 5.3.5. 5.3.6. xx. Sumatera Utara Province in Figures 2017.
(22) 5.3.12. 5.3.13. 5.3.14. 5.3.15. id. ht. tp. 5.3.16. o.. 5.3.11. ps .g. 5.3.10. .b. 5.3.9. ut. 5.3.8. Luas Tanaman dan Produksi Cengkeh Tanaman Perkebunan Rakyat menurut Kabupaten/Kota, 2016 Planting Area and Production of Clove Smallholders Estates by Regency/Municipality, 2016 .................................................................................................... 232 Luas Tanaman dan Produksi Kemenyan Tanaman Perkebunan Rakyat menurut Kabupaten/Kota, 2016 Planting Area and Production of Incense Smallholders Estates by Regency/Municipality, 2016 .................................................................................................... 233 Luas Tanaman dan Produksi Kulit Manis Tanaman Perkebunan Rakyat menurut Kabupaten/Kota, 2016 Planting Area and Production of Cinnamon Smallholders Estates by Regency/Municipality, 2016 .................................................................................................... 234 Luas Tanaman dan Produksi Nilam Tanaman Perkebunan Rakyat menurut Kabupaten/Kota, 2016 Planting Area and Production of Aromatic Oil Smallholders Estates by Regency/Municipality, 2016 ................................................................................................... 235 Luas Tanaman dan Produksi Kemiri Tanaman Perkebunan Rakyat menurut Kabupaten/Kota, 2016 Planting Area and Production of Candlenut Smallholders Estates by Regency/Municipality, 2016 .................................................................................................... 236 Luas Tanaman dan Produksi Aren Tanaman Perkebunan Rakyat menurut Kabupaten/Kota, 2016 Planting Area and Production of Palm Sugar Smallholders Estates by Regency/Municipality, 2016 .................................................................................................... 237 Luas Tanaman dan Produksi Pinang Tanaman Perkebunan Rakyat menurut Kabupaten/Kota, 2016 Planting Area and Production of Areca Nut Smallholders Estates by Regency/Municipality, 2016 .................................................................................................... 238 Luas Tanaman dan Produksi Vanili Tanaman Perkebunan Rakyat menurut Kabupaten/Kota, 2016 Planting Area and Production of Vanilla Smallholders Estates by Regency/Municipality, 2016 .................................................................................................... 239 Luas Tanaman dan Produksi Tembakau Tanaman Perkebunan Rakyat menurut Kabupaten/Kota, 2016 Planting Area and Production of Tobacco Smallholders Estates by Regency/Municipality, 2016 ...................................................................................... 240 Luas Tanaman dan Produksi Tebu Tanaman Perkebunan Rakyat menurut Kabupaten/Kota, 2016 Planting Area and Production of Sugar Cane Smallholders Estates by Regency/Municipality, 2016 .................................................................................................... 241 Luas Tanaman dan Produksi Pala Tanaman Perkebunan Rakyat menurut Kabupaten/Kota, 2016 Planting Area and Production of Nutmeg Smallholders Estates by Regency/Municipality, 2016 .................................................................................................... 242 Luas Tanaman dan Produksi Lada Tanaman Perkebunan Rakyat menurut Kabupaten/Kota, 2016 Planting Area and Production of Pepper Smallholders Estates by Regency/Municipality, 2016 .................................................................................................... 243 Luas Tanaman dan Produksi Kapuk Tanaman Perkebunan Rakyat menurut Kabupaten/Kota, 2016 Planting Area and Production of Kapok Smallholders Estates by Regency/Municipality, 2016 ................................................................................................... 244. :// su m. 5.3.7. 5.3.17. 5.3.18. 5.3.19. Provinsi Sumatera Utara Dalam Angka 2017. xxi.
(23) 5.3.23. 5.3.24 5.3.25 5.3.26. :// su m. 5.3.28. ut. .b. 5.3.27. id. 5.3.22. o.. 5.3.21. Luas Tanaman dan Produksi Gambir Tanaman Perkebunan Rakyat menurut Kabupaten/Kota, 2016 Planting Area and Production of Gambir Smallholders Estates by Regency/Municipality, 2016 ................................................................................................... 245 Luas Tanaman dan Produksi Kapulaga Tanaman Perkebunan Rakyat menurut Kabupaten/Kota, 2016 Planting Area and Production of Kapulaga Smallholders Estates by Regency/Municipality, 2016 .................................................................................................... 246 Luas Tanaman dan Produksi Jambu Mente Tanaman Perkebunan Rakyat menurut Kabupaten/Kota, 2016 Planting Area and Production of Cashews Smallholders Estates by Regency/Municipality, 2016 .................................................................................................... 247 Luas Tanaman dan Produksi Jarak Tanaman Perkebunan Rakyat menurut Kabupaten/Kota, 2016 Planting Area and Production of Castor Bean Smallholders Estates by Regency/Municipality, 2016 ………………………………………………………. 248 Luas Tanaman Perkebunan Rakyat menurut Jenis (ha), 2016 Planting Area of Smallholders Estates by Type of Plant (ha), 2016 ........................................ 249 Luas Tanaman Perkebunan Rakyat menurut Jenis Tanaman (ha), 2012-2016 Planting Area of Smallholder Estates by Type of Plan (ha), 2012-2016 .................................. 250 Produksi Perkebunan Rakyat menurut Jenis Tanaman (ton), 2012-2016 Production of Smallholder Estates by Type of Plant (ton), 2012-2016 .................................... 251 Luas Tanaman Perkebunan PTPN II,III & IV menurut Jenis Tanaman (ha), 2012-2016 Planting Area of State/Limited Estate Enterprises II, III & IV by Type of Plant (ha), 2012-2016 ....................................................................................................................... 252 Produksi Tanaman Perkebunan PTPN II,III & IV menurut Jenis Tanaman (ton), 2012-2016 Estate Crop Production of State/Limited Estate Enterprises II, III & IV by Type of Plant (ton), 2012-2016......................................................................................................... 253. ps .g. 5.3.20. KEHUTANAN / FORESTRY. 5.4.1. Penghijauan, Reboisasi dan Hutan Tanaman Industri (HTI) (ha), 2007-2016 Reforestation, Afforestation and Industrial Forest (ha), 2007-2016 ........................................ 254 Produksi Hasil Hutan Sumatera Utara menurut Jenis Produksi, 2013-2016 Forestry Production of Sumatera Utara, 2013-2016 ............................................................. 255 Luas Kawasan Hutan menurut Fungsinya (ha), 2007-2016 Forestry Area by Its Function (ha), 2007-2016 ....................................................................... 256. 5.4.2. ht. 5.4.3. tp. 5.4. 5.5. PETERNAKAN / LIVESTOCK. 5.5.1. Pemotongan Ternak Tercatat dan Tidak Tercatat menurut Jenis Ternak dan Kabupaten/Kota (ekor), 2016 Reported and Unreported Slaughtered Livestock by Kind and Regency/Municipality (tail), 2016............................................................................................ 257 Pemotongan Ternak Tercatat di RPH dan diluar RPH menurut Jenis Ternak dan Kabupaten/Kota (ekor), 2016 Slaughtered Livestock in Slaughter House by Kind and Regency/ Municipality (tail), 2016 ............................................................................................................................... 258. 5.5.2. xxii. Sumatera Utara Province in Figures 2017.
(24) 5.5.3. 5.5.4 5.5.5 5.5.6 5.5.7. 5.5.10 5.5.11. ps .g. 5.5.9. o.. id. 5.5.8. Ternak yang Dipotong yang Tidak Tercatat di RPH menurut Jenis Ternak dan Kabupaten/Kota (ekor), 2016 Unreported Slaughtered Livestock in Slaughter house by Kind and Regency/ 259 Municipality (tail), 2016 .......................................................................................................... Ternak yang Dipotong menurut Jenis Ternak (ekor), 2007-2016 260 Slaughtered Livestock Slaughtered House by Kind (tail), 2007-2016 ..................................... Populasi Ternak Besar menurut JenisTernak (ekor), 2007-2016 Livestock Population by Kind (tail), 2007-2016 ...................................................................... 261 Populasi Ternak Kecil menurut Jenis (ekor), 2007-2016 Small Livestock Population by Kind (tail), 2007-2016 ............................................................ 262 Populasi Ternak Unggas menurut Jenis (ekor), 2007-2016 Poultry Population by Kind (tail), 2007-2016 ......................................................................... 263 Produksi Daging menurut Jenis Ternak dan Kabupaten/Kota (ton), 2016 Meat Production by Kind of Livestock and Regency/Municipality (ton), 2016 ........................ 264 Produksi Daging menurut Jenis Unggas dan Kabupaten/Kota (ton), 2016 Meat Production by Type of Poultry and Regency/Municipality (ton) 2016 ............................ 265 Produksi Telur menurut Jenis dan Kabupaten/Kota (ton), 2016 Egg Production by Type and Regency/Municipality (ton), 2016 .............................................. 266 Produksi Kulit menurut Jenis dan Kabupaten/Kota (lembar), 2006-2015 Hide Production by Type and Regency/Municipality (sheet), 2006-2015 ................. 267 PERIKANAN / FISHERY. 5.6.1. Jumlah Perahu Penangkap Ikan Laut menurut Kategori dan Kabupaten/Kota (unit), 2016 Number of Marine Fishing Boat by Category and Regency/Municipality (unit), 2016 ......................................................................................................................................... 268 Perahu Penangkap Ikan Laut menurut Kategori (unit), 2007-2016 Marine Fishing Boat by Category (unit), 2007-2016 ............................................................... 269 Jumlah Rumah Tangga Budi Daya Perikanan menurut Jenis Budi Daya dan Kabupaten/Kota, 2016 Number of Fish Culture’s Household by Type and Regency/Municipality, 2016 .................... 270 Jumlah Nelayan menurut Kategori, 2007-2016 Number of Fishermen by Category, 2007-2016 ....................................................................... 271 Produksi Ikan menurut Asal Tangkapan dan Kabupaten/Kota (ton), 2016 Fish Production by Catching Area and Regency/Municipality (ton), 2016 .............................. 272. ut. .b. 5.6. :// su m. 5.6.2 5.6.3 5.6.4. tp. 5.6.5. PERINDUSTRIAN / MANUFACTURING. ht. 6.. 6.1. HASIL SE2016 / RESULT OF SE2016. 6.1.1. Jumlah Usaha/Perusahaan menurut Kategori Lapangan Usaha dan Skala Usaha, 2016 Number of Establishment/Enterprise by Sector and Scale, 2016 ............................... 283 Jumlah Usaha/Perusahaan menurut Skala Usaha dan Kabupaten/Kota, 2016 Number of Establishment/Enterprise by Scale and Regency/Municipality, 2016………………………………………………………………………………… 284 Jumlah Tenaga Kerja menurut Kategori Lapangan Usaha dan Skala Usaha, 2016 Number of Employee by Sector and Scale, 2016 ...................................................................... 285. 6.1.2 6.1.3. Provinsi Sumatera Utara Dalam Angka 2017. xxiii.
(25) Jumlah Tenaga kerja menurut Skala Usaha dan Kabupaten/Kota, 2016 Number of Employee by Scale and Regency/Municipality, 2016 ............................................. 286. 6.2. INDUSTRI BESAR DAN SEDANG/ LARGE AND MEDIUM INDUSTRY. 6.2.1. Jumlah Perusahaan Industri Besar dan Sedang menurut Kabupaten/Kota (unit), 2013-2016 Number of Large and Medium Manufacturing Establishments by Regency/Municipality (unit), 2013-2016.................................................................................. 287 Jumlah Tenaga Kerja Industri Besar dan Sedang menurut Kabupaten/Kota (orang), 2013-2016 Number of Workes of Large and Medium Manufacturing Establishments by Regency/Municipality (person), 2013-2016............................................................................. 288 Biaya Input Industri Besar dan Sedang menurut Kabupaten/Kota (milyar rupiah), 2013-2016 Input Cost of Large and Medium Manufacturing Establishments by Regency/ Municipality (billion rupiahs), 2013-2016 ................................................................ 289 Nilai Output Industri Besar dan Sedang menurut Kabupaten/Kota (milyar rupiah), 2013-2016 Gross Output Value of Large and Medium Manufacturing Establishments by Regency/Municipality (billion rupiahs), 2013-2016 .................................................. 290 Nilai Tambah Industri Besar dan Sedang menurut Kabupaten/Kota (milyar rupiah), 2013-2016 Value Added of Large and Medium Manufacturing Establishments by Regency/Municipality (billion rupiahs), 2013-2016 .................................................. 291 Jumlah Perusahaan Industri Besar dan Sedang menurut Golongan Industri (unit), 2013-2016 Number of Large and Medium Manufacturing Establishments by Industrial Classification (unit), 2013-2016 ................................................................................ 292 Jumlah Tenaga Kerja Industri Besar dan Sedang menurut Golongan Industri (orang), 2013-2016 Number of Workes of Large and Medium Manufacturing Establishments by Industrial Classification (person) 2013-2016 ............................................................ 293 Biaya Input Industri Besar dan Sedang menurut Golongan Industri (milyar rupiah), 2013-2016 Input Cost of Large and Medium Manufacturing Establishments by Industrial Classification (billion rupiahs), 2013-2016 ............................................................... 294 Nilai Output Industri Besar dan Sedang menurut Golongan Industri (milyar rupiah), 2013-2016 Gross Output Value of Large and Medium Manufacturing Establishments by Industrial Classification (billion rupiahs), 2013-2016............................................... 295 Nilai Tambah Industri Besar dan Sedang menurut Golongan Industri Atas Dasar Harga Pasar (milyar rupiah), 2013-2016 Value Added of Large and Medium Scale Manufacturing Establishments by Industrial Classification (billion rupiahs), 2013-2016............................................... 296 Biaya Input Industri Besar dan Sedang (milyar rupiah), 2014-2016 Input Cost of Large And Medium Manufacturing Establishments(billion rupiahs), 2014-2016.................................................................................................................. 297 Nilai Output Industri Besar dan sedang (milyar rupiah), 2014-2016 Gross Output Value of Large and Medium Manufacturing Establishments(billion rupiahs), 2014-2016 .................................................................................................. 299. 6.2.6. 6.2.7. 6.2.8. o.. ps .g. ht. 6.2.9. .b. 6.2.5. ut. 6.2.4. :// su m. 6.2.3. tp. 6.2.2. id. 6.1.4. 6.2.10. 6.2.11 6.2.12. xxiv. Sumatera Utara Province in Figures 2017.
(26) LISTRIK / ELECTRIMUNICIPALITY. 6.3.1. Besarnya Daya Terpasang Pembangkit Listrik PLN menurut Tenaga Pembangkitnya (mw), 2016 Number of Power Installed Capacity of The State Electrical Company (mw), 2016 .. Perkembangan Daya Terpasang Pembangkit Tenaga Listrik PLN menurut Tenaga Pembangkitnya (mw), 2009-2016 Trend of Electric Installed Capasity by Type of Generators (mw),2009-2016 ........... Banyaknya Energi Listrik yang Diproduksi dan Dibeli dari Unit Lain (gwh), 2016 Number of Electricity Produced and Purchased Form other Units(gwh), 2016 ....... Banyaknya Energi Listrik yang Diproduksi, Dibeli, Susut dan Pemakaiannya (gwh), 2013-2016 Number of Electricity Produced, Purchased, Losses and Utilization (gwh),20132016 ........................................................................................................................... Jumlah Pelanggan Listrik menurut Jenis Pelanggan dan Area (Pelanggan), 2016 Number of Customer by Kind of Customer and Area (customer), 2016 .................... Jumlah Daya (VA) Tersambung Listrik menurut Jenis Pelanggan dan Area (kva), 2016 Number of Connected Power by Customer and Area (kva),2016 ............................... Jumlah Penjualan Energi Listrik menurut Jenis Pelanggan dan Area (gwh), 2016 Total of Energy Sold by Customer and Area (gwh),2016 ........................................... Jumlah Penjualan Energi menurut Pelanggan dan Area (juta rupiah), 2016 Total of Energy Sold by Customer and Area (million rupiahs), 2016 ........................ Perkembangan Pelanggan Listrik menurut Area (pelanggan), 2012-2016 Growth of Customers by Area (customer), 2012-2016............................................... Perkembangan Daya (VA) Tersambung menurut Area (kva), 2012-2016 Growth of Connected Power by Area(kva), 2012-2016 ............................................. Perkembangan Penjualan Energi Listrik menurut Pelanggan dan Area (gwh), 2012-2016 Growth of Energy Sold by Customer and Area (gwh), 2012-2016 ............................. Perkembangan Nilai Penjualan Energi Listrik menurut Pelanggan dan Area (juta rupiah), 2012-2016 Growth of Value of Sold Energy by Customer and Area (million rupiahs), 20122016 ........................................................................................................................... Susut Energi Listrik menurut Area (mwh), 2016 Losses of Electric by Area of Year (mwh), 2016 ........................................................ Panjang Jaringan menurut Area Dan Jenis Jaringan (kms), 2016 Length of Network by Area and Kind of Network (kms), 2016 ................................... Gangguan Jaringan Distribusi menurut Area (gangguan/100 kms), 2016 Instalation Disturbanceof Distribution by Area (disturbance/100 kms), 2016 ............ 6.3.7 6.3.8 6.3.9 6.3.10 6.3.11 6.3.12. 6.3.13. tp. 6.3.14. o.. 6.3.6. ps .g. 6.3.5. .b. 6.3.4. ut. 6.3.3. :// su m. 6.3.2. id. 6.3. ht. 6.3.15. 302 303 305. 306 307 308 309 310 311 312 313. 314 315 316 317. 6.4. AIR BERSIH / WATER SUPPLY. 6.4.1. Jumlah Tenaga Kerja Perusahaan Air Bersih menurut Kabupaten/ Kota (orang), 2016 Number of Employees of Drinking Water Supply Enterprise by Regency/Municipality (person), 2016 ........................................................................ 318 Jumlah Air Bersih Disalurkan menurut Jenis Konsumen dan Kabupaten/Kota (m3), 2016 Volume of Drinking Water Distributed by Consumer Group and Regency/Municipality (m3), 2016 ............................................................................... 319. 6.4.2. Provinsi Sumatera Utara Dalam Angka 2017. xxv.
(27) 6.4.3. Jumlah Pelanggan Air Bersih menurut Jenis Konsumen dan Kabupaten/Kota, 2016 Number of Consumer Drinking Water by Consumer Group and Regency/Municipality, 2016 ...................................................................................... 320 Kapasitas Produksi dan Efektivitas Air Bersih menurut Kabupaten/Kota, 2016 CapaMunicipality of Production and Efektivition of Water by Regency/Municipality, 2016 ...................................................................................... 321. 6.4.4. 6.5. GAS / GAS. 6.5.1. Banyaknya Pelanggan,Volume dan Nilai Penjualan Gas, 2010-2016 Number of Costumer Volume and Value Sale of Gas 2009-2016............................... 322 Nilai Penjualan Gas Melalui Pipa Dirinci menurut Pelanggan (juta rupiah), 2016 Value Gas Sold Through Pipeline by Customer (million rupiahs), 2016 ................... 323. o.. id. 6.5.2. BAHAN BAKAR MINYAK / FUEL SUPPLY. 6.6.1. Jumlah Penyaluran Bahan Bakar Minyak menurut Jenis dan Kabupaten/Kota (kiloliter), 2015 Quantity of Distributed of Petroleum by Type of Petroleum and Regency/Municipality (kiloliters), 2015 ..................................................................... 324 Jumlah Penyaluran Bahan Bakar Minyak menurut Jenisnya (kiloliter), 2015 Quantity of Distributed of Petroleum by Kind (kiloliters), 2015 ................................ 326. 7.. PERDAGANGAN / TRADE. ut. 6.6.2. .b. ps .g. 6.6. EKSPOR DAN IMPOR / EXPORT AND IMPORT. 7.1.1. Perdagangan Luar Negeri Sumatera Utara, 2012-2016 Foreign Trade of Sumatera Utara, 2012-2016 .......................................................... 338 Ekspor Sumatera Utara menurut Sektor, 2012-2016 Exports of Sumatera Utara by Sector, 2012-2016 ............................................................ 339 Ekspor Sumatera Utara menurut Kelompok Barang Ekonomi, 2012-2016 Exports of Sumatera Utara by Economic Goods Group, 2012-2016 ....................................... 341 Ekspor Sumatera Utara menurut Komoditi I Dijit SITC, 2012-2016 Exports of Sumatera Utara by digit SITC Comodity, 2012-2016 ............................................. 343 Ekspor Sumatera Utara menurut Tujuan, 2012-2016 Exports of Sumatera Utara by Destination, 2012-2016 ........................................................... 347 Ekspor Sumatera Utara menurut Komoditi Utama 3 Dijit SITC, 2012-2016 Exports of Sumatera Utara by Main Commodity 3 Digit SITC, 2012-2016............................. 351 Ekspor Sumatera Utara menurut Negara Tujuan Utama, 2012-2016 Export of Sumatera Utara by Main Country of Destination, 2012-2016 .................. 355 Ekspor Sumatera Utara menurut Pelabuhan, 2010-2014 Expor of Sumatera Utara by Port, 2012-2016 ........................................................... 359 Impor Sumatera Utara menurut Sektor, 2012-2016 Import Sumatera Utara by Sector, 2012-2016 .......................................................... 363 Impor Sumatera Utara menurut Kelompok Barang Ekonomi, 2012-2016 Import of Sumatera by Economic Goods Group, 2012-2016 ..................................... 365 Impor Sumatera Utara menurut Komoditi 1 Dijit SITC, 2012-2016 Import of Sumatera Utara by 1 Digit SITC Comodity, 2012-2016............................. 367. 7.1.3 7.1.4 7.1.5. ht. 7.1.6. tp. 7.1.2. :// su m. 7.1. 7.1.7 7.1.8 7.1.9. 7.1.10 7.1.11. xxvi. Sumatera Utara Province in Figures 2017.
(28) 7.1.12 7.1.13 7.1.14 7.1.15. Impor Sumatera Utara menurut Asal, 2012-2016 Import of Sumatera Utara by Origin, 2012-2016 ...................................................... Impor Sumatera Utara menurut Komoditi Utama 3 Dijit SITC, 2012-2016 Import of Sumatera Utara by Main Comodity 3 Digit SITC, 2012-2016 ................... Impor Sumatera Utara menurut Negara Asal Utama, 2012-2016 Import of Sumatera Utara by Main Country of Destination, 2012-2016.................... Impor Sumatera Utara menurut Pelabuhan, 2012-2016 Import of Sumatera Utara by Port, 2012-2016 ........................................................... 373 375 379 383. PENYALURAN BERAS / RICE BY LOGISTIC. 7.2.1. Penerimaan dan Penyaluran Beras Perum Bulog Divre Sumatera Utara (ton), 2007 - 2016 Revenue and Distribution of Rice by Perum Bulog Divre of Sumatera Utara (ton), 2007 - 2016 .............................................................................................................. 387 Penyaluran dan Penjualan Beras Perum Bulog Divre Sumatera Utara menurut Golongan Konsumen, (ton), 2009 - 2016 Distribution and Sale of Rice by Perum Bulog Divre of Sumatera Utara by Consumer Classification (ton), 2009 - 2016 ............................................................ 388. id. 7.2. 8.1.3. 8.1.4. ht. tp. 8.1.5. .b. 8.1.2. Jumlah Hotel dan Akomodasi Lainnya menurut Kabupaten/ Kota, 2012-2016 Number of Hotels and Other Accommodation by Regency/Municipality, 20122016 ........................................................................................................................... 399 Jumlah Hotel dan Akomodasi Lainnya menurut Kelas dan Kabupaten/ Kota, 2016 Number of Hotels and Other Accommodation by Classification and Regency/Municipality, 2016 .................................................................................................. 400 Jumlah Kamar Hotel dan Akomodasi Lainnya menurut Kabupaten/Kota, 20122016 Number of Rooms of Hotels and Other Accommodation by Regency/Municipality, 2012-2016................................................................................................................................ 402 Jumlah Kamar Hotel dan Akomodasi Lainnya menurut Kelas dan Kabupaten/Kota, 2016 Number of Rooms of Hotels and Other Accommodation by Classification and Regency/Municipality, 2016 .................................................................................................... 403 Jumlah Tempat Tidur Hotel dan Akomodasi Lainnya menurut Kabupaten/Kota, 2012-2016 Number of Beds of Hotels and Other Accommodation by Regency/Municipality, 2012-2016................................................................................................................................ 405 Jumlah Tempat Tidur Hotel dan Akomodasi Lainnya menurut Kelas dan Kabupaten/Kota, 2016 Number of Beds of Hotels and Other Accommodation by Classification and Regency/Municipality, 2016 .................................................................................................... 406 Tingkat Penghunian Kamar Hotel dan Akomodasi Lainnya menurut Bulan dan Klasifikasi (%), 2012-2016 Room Occupancy Rate of Hotels and Other Accomodation Month and by Classification (%), 2012-2016 .................................................................................. 408 Tingkat Penghunian Kamar Hotel dan Akomodasi Lainnya menurut Kabupaten/Kota (% ), 2012-2016 Room Occupancy Rate of Hotels and Other Accomodation by Regency/Municipality (% ), 2012-2016 ..................................................................... 410. ut. 8.1.1. HOTEL DAN PARIWISATA / HOTEL AND TOURISM. :// su m. 8.. ps .g. o.. 7.2.2. 8.1.6. 8.1.7. 8.1.8. Provinsi Sumatera Utara Dalam Angka 2017. xxvii.
(29) 8.1.9. Rata-Rata Lama Inap Tamu Hotel dan AkomodasiLainnya menurut Bulan dan Klasifikasi (hari), 2012-2016 Average Length of Stay of Guest Of Hotels and Other Accomodation Month and by Classification (day), 2012-2016 ................................................................... Rata-rata Lama Inap Tamu Hotel dan Akomodasi Lainnya menurut Kabupaten/Kota(hari), 2012-2016 Average Length of Stay of Guest of Hotels and Other Accomodation by Regency/Municipality(day), 2012-2016 ..................................................................... Rata-Rata Lama Inap Tamu Mancanegara Hotel dan Akomodasi Lainnya menurut Bulan dan Klasifikasi (hari), 2012-2016 Average Length of Stay of Foreign Guest Of Hotels and Other Accomodation Month and by Classification (day), 2012-2016 .......................................................... Rata-rata Lama Inap Tamu Mancanegara Hotel dan Akomodasi Lainnya menurut Kabupaten/Kota(hari), 2012-2016 Average Length of Stay of Foreign Guest of Hotels and Other Accomodation by Regency/Municipality (day), 2012-2016 .................................................................... Rata-Rata Lama Inap Tamu Nusantara Hotel dan Akomodasi Lainnya menurut Bulan dan Klasifikasi (hari ), 2012-2016 Average Length of Stay of Domestic Guest Of Hotels and Other Accomodation Month and by Classification (day), 2012-2016 .......................................................... Rata-rata Lama Inap Tamu Nusantara Hotel dan Akomodasi Lainnya menurut Kabupaten/Kota Municipality (hari), 2012-2016 Average Length of Stay of Domestic Guest of Hotels and Other Accomodation by Regency/Municipality (day), 2012-2016 .................................................................... Komposisi Tamu Hotel dan Akomodasi Lainnya menurut Bulan dan Klasifikasi (%), 2012-2016 Composition guest of Hotels and Other Accomodation by Month and Classification (%), 2012-2016 ................................................................................... Wisatawan Mancanegara yang Datang ke Sumatera Utara menurut Pintu Masuk (orang), 2012-2016 Foreign Visitor Arrival in Sumatera Utara by Port of Entry (person), 2012-2016. 8.1.10. 413. 414. id. 8.1.11. 411. o.. 8.1.12. ps .g. 8.1.13. .b. 8.1.14. :// su m. ut. 8.1.15. 8.1.16. 8.1.17. 416. 417. 419. 420 424. Wisatawan Mancanegara yang Datang ke Sumatera Utara menurut Kebangsaan (orang), 2014-2016 Foreign Visitor Arrival in Sumatera Utara by Nationality (person), 2014-2016 ....... 425 Wisatawan Mancanegara yang Datang ke Sumatera Utara menurut Kebangsaan dan Pintu Masuk (orang), 2016 Foreign Visitor Arrival in Sumatera Utara by Nationality and Port of Entry (person), 2016 ........................................................................................................... 428. ht. tp. 8.1.18. 9.. PERHUBUNGAN DAN TELEKOMUNIKASI / TRANSPORTATION AND COMMUNICATION. 9.1. ANGKUTAN JALAN DAN KERETA API / ROAD AND RAIL TRANSPORT. 9.1.1. Panjang Jalan menurut Status, Jenis Permukaan, dan Kondisi (km), 2016 Road Length by Level of Government, Type of Surface, and Condition (km), 2016 440 Panjang Jalan menurut Status dan Kabupaten/Kota(km), 2016 Road Length by Status and Regency/Municipality (km), 2016 ....................................... 441. 9.1.2. xxviii. Sumatera Utara Province in Figures 2017.
(30) 9.1.9 9.1.10 9.1.11 9.1.12 9.1.13 9.1.14. 9.1.15. 9.2. ANGKUTAN UDARA DAN LOGISTIK / AIRPORT AND LOGISTIC. tp. 9.1.16. id. 9.1.8. o.. 9.1.7. ps .g. 9.1.6. .b. 9.1.5. ut. 9.1.4. Panjang Jalan Provinsi menurut Jenis Permukaan(km), 2016 Road Length of Proince by Type of Surface (km), 2016 ............................................. 442 Panjang Jalan Provinsi menurut Kondisi Jalan (km), 2016 Road Length of Province by Condition (km), 2016.................................................... 443 Jumlah Kendaraan Bermotor yang Terdaftar (unit), 2006-2016 Number of Registered Vehicles (unit), 2006-2016 ................................................................... 444 Jumlah Kecelakaan Lalu Lintas dan Kerugian, 2012-2016 Number of Traffic Accident and Damage, 2012-2016 ............................................................. 445 Jumlah Kecelakaan Lalu Lintas menurut Korban dan Kabupaten/Kota, 2016 Number of Traffic Accident by Victim and Regency/Municipality, 2016 ................... 446 Jumlah Surat Izin Mengemudi (SIM) yang Dikeluarkan menurut Jenisnya, 20122016 Number of Driving Licence Issued by Type, 2012-2016 ............................................ 447 Jumlah Surat Izin Mengemudi (SIM) A yang dikeluarkan menurut Kategori, 2013-2016 Number of Driving Licence Type A Issued by Category, 2013-2016 ......................... 448 Jumlah Surat Izin Mengemudi (SIM) B1 yang Dikeluarkan menurut Kategori, 2013-2016 Number of Driving Licence Type B1 Issued by Category, 2013-2016 ....................... 449 Jumlah Surat Izin Mengemudi (SIM) B2 yang Dikeluarkan menurut Kategori, 2013-2016 Number of Driving Licence Type B2 Issued by Category, 2013-2016 ....................... 450 Jumlah Surat Izin Mengemudi (SIM) C yang Dikeluarkan menurut Kategori, 2013-2016 Number of Driving Licence Type C Issued by Category, 2013-2016 ......................... 451 Kiriman Biasa/Umum Barang Swasta Angkutan Kereta Api (ribu ton), 2012-2016 Private/General Cargo Shipped by Train (thousand ton), 2012-2016 ....................... 452 Kiriman Cepat dan Biasa/Umum Barang Swasta Angkutan Kereta Api menurut Jenis Barang (ribu/ton), 2012-2016 Private/General Cargo Shipped by Train by Type of Cargo, (thousand/ton), 2012-2016.................................................................................................................. 453 KM Penumpang dan KM Barang Angkutan Kereta Api, 2012-2016 Pax-Km and Cargo Km Shipped by Train, 2012-2016............................................... 454 Kiriman Barang Cepat dan Biasa Angkutan Kereta Api, 2012-2016 Regular and Express Cargo Shipped by Train, 2012-2016 ........................................ 455. :// su m. 9.1.3. Jumlah Penerbangan Internasional dan Domestik Melalui Pelabuhan Udara Polonia/Kuala Namu (kali), 2013-2016 Number of International and Domestic Flight Via Polonia/Kuala Namu Airport (times), 2013-2016 ..................................................................................................... 456 Jumlah Penumpang Internasional dan Domestik Melalui Pelabuhan Udara Polonia/Kuala Namu (orang), 2013-2016 Number of International and Domestic Passenger Via Polonia/Kuala Namu Airport (person), 2013-2016 ................................................................................................. 457 Jumlah Bagasi Internasional dan Domestik Melalui Pelabuhan Udara Polonia/Kuala Namu, 2013-2016 Volume of International and Domestic Baggage Via Polonia/Kuala Namu Airport, 2013-2016 .................................................................................................................. 458. ht. 9.2.1. 9.2.2. 9.2.3. Provinsi Sumatera Utara Dalam Angka 2017. xxix.
(31) 9.2.4. 9.2.5. Jumlah Barang Internasional Dan Domestik Melalui Pelabuhan Udara Polonia/Kuala Namu (kg), 2013-2016 Volume of International And Domestic Cargo Via Polonia/Kuala Namu Airport (kg), 2013-2016 ....................................................................................................................... 459 Jumlah Pos Internasional dan Domestik Melalui Pelabuhan Udara Polonia/Kuala Namu (kg), 2013-2016 Volume of International and Domestic Mail Via Polonia/Kuala Namu Airport (kg), 2013-2016 ....................................................................................................................... 460 ANGKUTAN LAUT DAN LOGISTIC / COMMERCIAL PORT AND LOGISTIC. 9.3.1. Arus Kunjungan Kapal Melalui Pelabuhan Diusahakan, 2012-2016 Flow of Ships via Commercial Port, 2012-2016 ........................................................ 461 Arus Kunjungan Kapal menurut Pelabuhan Diusahakan, 2016 Flow of Ships by Commercial Port, 2016 .......................................................................... 462 Arus Penumpang Melalui Pelabuhan Diusahakan, (orang), 2012-2016 Flow of Passenger by Commercial Port (people), 2012-2016 ................................ 463 Arus Penumpang menurut Pelabuhan Diusahakan (orang), 2016 Flow of Passenger by Commercial Port (people), 2016 .......................................................... 464 Arus Barang Melalui Pelabuhan Diusahakan (ton), 2012-2016 Flow of Cargo by Commercial Port (ton), 2012-2016 ............................................................. 465 Arus Barang menurut Pelabuhan Diusahakan (ton), 2016 Flow of Cargo by Commercial Port (ton), 2016 ....................................................... 466 Arus Kunjungan Kapal Melalui Pelabuhan Laut Tidak Diusahakan, 2012-2016 Flow of Ships via Uncommercial Sea Port, 2012-2016 ................................................... 467 Arus Kunjungan Kapal menurut Pelabuhan Laut Tidak Diusahakan, 2016 Flow of Ships by Uncommercial Sea Port , 2016..................................................................... 468 Arus Barang dan Penumpang Melalui Pelabuhan Tidak Diusahakan, 2012-2016 Flow of Cargo and Passenger by Uncommercial Port, 2012-2016 ....................................