SONOELASTOGRAPHIC FEATURES
OF HIGH-RISK BREAST LESIONS AND DUCTAL
CARCINOMA
IN SITU
– A PILOT STUDY
Maja Crnogorac1, Gordana Ivanac1,2, Čedna Tomasović-Lončarić2,3, Rado Žic2,4, Tomislav Kelava5 and Boris Brkljačić1,2
1Department of Diagnostic and Interventional Radiology, Dubrava University Hospital, Zagreb, Croatia; 2University of Zagreb, School of Medicine, Zagreb, Croatia;
3Department of Pathology, Dubrava University Hospital, Zagreb, Croatia;
4Department of Plastic and Reconstructive Surgery, Dubrava University Hospital, Zagreb, Croatia; 5Department of Physiology and Immunology, University of Zagreb, School of Medicine, Zagreb, Croatia
SUMMARY – The aim of this study was to evaluate the quantitative sonoelastographic values recorded on shear-wave sonoelastography (SWE) of high-risk breast lesions and ductal carcinoma in situ (DCIS). We retrospectively analyzed histopathologic and SWE data (quantitative maximum, minimum and mean stiffness, lesion-to-fat ratio (E-ratio), lesion size) of 228 women referred to our Department for core needle breast biopsy during a four-year period. Among 230 lesions, histopatho-logic findings showed 34 high-risk breast lesions and 29 DCIS, which were compared with 167 ductal invasive carcinomas. High-risk lesions had lower values of all sonoelastographic features than ductal
in situ and invasive carcinoma, however, only E-ratio showed a statistically significant difference in comparison to DCIS (3.7 vs. 6, p<0.001). All sonoelastographic features showed significant difference between in situ and invasive carcinoma. There was a significant correlation between lesion size and stiffness (r=0.36; p<0.001). Stiffness measured by SWE is an effective predictor of the histopatho-logic severity of sonographically detectable breast lesions. Elasticity values of high-risk lesions are significantly lower than those of malignant lesions. Furthermore, we showed that along with the so-nographic appearance, which in most cases shows typical microcalcifications, DCIS had significantly different elasticity parameters than invasive carcinoma.
Key words: Breast neoplasms – diagnostic imaging; Breast neoplasms – classification; Elastic modulus; Ultrasonography, mammary; Elasticity imaging techniques; Sensitivity and specificity; Carcinoma, intra-ductal; Shear-wave elastography (SWE)
Correspondence to: Maja Crnogorac, MD, Department of Diagnos-tic and Interventional Radiology, Dubrava University Hospital, Av. Gojka Šuška 6, HR-10000 Zagreb, Croatia
E-mail: mstrineka@gmail.com
Received March 22, 2017, accepted April 12, 2018
Introduction
Breast cancer is the most common cancer and the leading cause of cancer related death in women world-wide, and in 2013, the incidence of breast cancer in Croatia was 26%, with 2557 newly diagnosed cases and 994 reported deaths related to breast cancer1.
Conventional gray-scale ultrasonography (US) has high diagnostic sensitivity, ranging from 83% to 98%, but lower specificity ranging from 34% to 70%2,3. There
are difficulties in distinguishing benign and malignant lesions, as their US features can overlap, examination can be difficult in large breasts, small lesions are easily missed, and examiner’s experience plays a significant role. Sonoelastography is a relatively novel method that appears to be a useful tool in benign/malignant differentiation of solid breast masses identified on
conventional US4-7. The latest meta-analysis of 33
shear-wave sonoelastography (SWE), with a sensitivity of 0.886 and specificity of 0.866 in benign/malignant
differentiation8. Furthermore, when combined with
conventional B-mode US, the sensitivity and specific-ity of 0.971 and 0.801 have been reported8.
Sonoelas-tography could aid in reducing unnecessary breast bi-opsies7, which remain the gold standard in diagnosing
suspicious breast lesions.
Most of the lesions that occur in the breast are be-nign. With the use of various imaging methods and fine needle aspiration (FNA), the diagnosis of benign breast disease can be accomplished without surgery in the vast majority of patients9,10. Fibrocystic changes
represent the most frequent benign disorder of the breast, and can be classified as nonproliferative lesions, proliferative lesions without atypia, and proliferative lesions with atypia9,11. Nonproliferative lesions
encom-pass 70% of this group of lesions, and carry no risk of breast cancer development. Proliferative lesions with-out atypia include ductal hyperplasia of the usual type, sclerosing adenosis, radial scar, and intraductal papil-loma. Proliferative lesions with atypia include flat atypia, atypical ductal hyperplasia (ADH) and lobular neoplasia (atypical lobular hyperplasia (ALH), lobular carcinoma in situ)12.
Compared with the general population, women with proliferative lesions without and with atypia have a greater risk of subsequent breast cancer, ranging from 1.3-1.9 and 3.9-13, respectively, and are considered as ‘high-risk’ lesions9,11-13. Hartmann et al.13 found a
sig-nificant interaction between patient age at the diagno-sis of benign breast disease and histologic appearance. The risk of breast cancer was 6.99 times the expected risk if atypia was diagnosed before the age of 45, but 3.37 times the expected risk if it was diagnosed after the age of 55. Page and Dupont14 found 4-5 times
in-creased risk of breast cancer in women with ADH or ALH compared to the general population. However, this risk is nearly doubled if the patient has a first-de-gree relative with breast cancer. The risk associated with benign breast disease is becoming even more im-portant since the increasing use of both mammogra-phy and US has increased the frequency of breast bi-opsies, with the majority of benign findings. The man-agement of these patients includes imaging follow-up or surgical excision, which is advocated in cases of proliferative lesions with atypia and other high-risk le-sions.
The widespread use of mammography in breast screening has also led to increased detection of ductal carcinoma in situ (DCIS), due to the frequent presence of microcalcifications within the lesions. DCIS now accounts for 15%-20% of detected cancers15. It is
de-fined as an intraductal proliferation of malignant epi-thelial cells with no evidence for invasion of the
base-ment membrane9. Lesions are primarily classified
based on their cytonuclear differentiation as poorly, intermediately and well differentiated; in addition, based on architectural differentiation, they can be cat-egorized as solid and non-solid15. DCIS is a
nonoblig-atory precursor of invasive breast cancer, and it is esti-mated that up to 40% will progress if untreated16. Most
cases of DCIS are diagnosed on mammography, and US is not traditionally used as a primary diagnostic modality for DCIS because it is less sensitive for iden-tifying microcalcifications.
Percutaneous ultrasound guided core needle biopsy (CNB) is an accurate, safe, quick and effective tool for histologic diagnosis of breast lesions17. It has a high
sensitivity of 96%, and a false-negative rate of 2.4% for malignant lesions18. It can reduce the cost of diagnosis
of indeterminate or suspicious lesions, causes minimal or no scarring, and is generally more acceptable for pa-tients than surgical excision. A limited sample
ob-tained from CNB (mostly 3-5 specimens per biopsy)
may result in ‘histologic underestimation’, as 20%-56% of ADH lesions diagnosed at CNB contain foci of cancer at subsequent surgery excision, and among le-sions previously diagnosed as DCIS, 16%-35% con-tain invasive carcinoma17.
There are many published studies about SWE dif-ferences among specific types of invasive ductal carci-noma and between ductal and lobular carcicarci-noma4-8,19-22,
but very few articles describe the quantitative sono-elastographic features of high-risk lesions and DCIS21,24,26. The purpose of this study was to examine
the SWE features of high-risk breast lesions and DCIS in a relatively small group of patients.
Patients and Methods
The institutional Review Board approval was ob-tained for this retrospective study. Analysis was per-formed of our breast biopsy database for patients re-ferred for core biopsy during a four-year period, in which SWE examination had been performed along
with US during diagnostic workup. B-mode features, SWE data, pathologic and surgical records of these patients were reviewed. Among the lesions that under-went core biopsy, any atypical, suspicious or malignant result prompted surgical excision, as decided on multi-disciplinary team meetings. Patients with high-risk le-sions and DCIS, as confirmed with histopathology findings, were included in the study. DCIS group con-sisted of 29 patients with pure in situ lesions, without microinvasive component on histopathology. If the microinvasive component was noted, lesions were con-sidered invasive cancers. Regarding the high-risk group, 34 patients had this type of lesions. For com-parison, we included data on 167 patients diagnosed with invasive ductal carcinoma found during the same period. Relevant clinical information was obtained from patient clinical and breast imaging reports on the lesions that met the inclusion criteria. Information in-cluded patient age, personal history of breast cancer, information on previous breast surgery, lesion size, Breast Imaging-Reporting and Data System (BI-RADS) description and assessment.
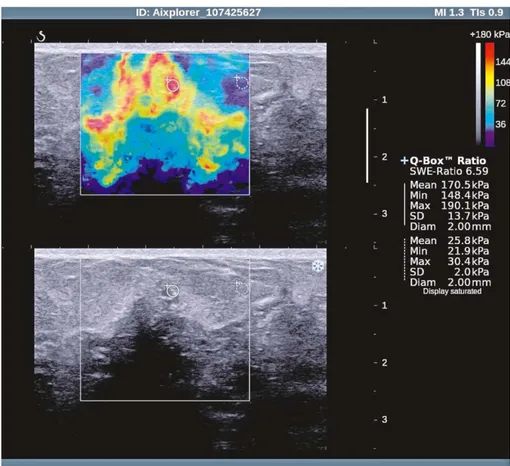
All patients underwent SWE examination on the same Aixplorer (Supersonic Imagine, Aix en Provence, France) US scanner equipped with linear high-fre-quency transducer (4-15 MHz). Gray scale and sono-elastographic examinations were performed during the regular diagnostic process, by a single radiologist with 25-year experience in breast imaging and breast US (the last author). The images obtained were stored at the scanner hard drive. The protocol for SWE data ac-quisition was standardized, with optimal setting of fo-cus of the lesion, without manual compression on the probe. Lesion stiffness was measured by using the built-in quantification region of interest (ROI; Q-box), with ROI set at 2x2 mm in all measurements. ROI was always placed over the stiffest part of the le-sion or its edge, with the most intense red color, usu-ally at the lesion margin, which correlates with lesion stiffness in kilopascals (kPa). Also, a second ROI of the same size was employed in calculating the lesion-to-fat ratio (E-ratio), used to compare the lesion stiffness with that of breast fatty tissue. All measurements were made in the same preset (breast preset on the scanner, penetration mode), with the highest stiffness set at ≥180 kPa. Elastography values displayed in the data box next to the image were obtained and recorded as mean (Emean), maximum (Emax), minimum (Emin)
stiffness, and the above mentioned E-ratio. The high-est measured values were recorded for a single patient. After SWE, 14G core biopsy was performed, regard-less of the results of the SWE studies. The criteria for indicating a biopsy were based on the mammography, gray-scale US and/or magnetic resonance imaging (MRI) findings, or previous suspicious FNA findings. Biopsies were performed using the same US scanner for guidance, by the same radiologist.
Clinical parameters and elastographic features were expressed as mean ± standard deviation or medi-an with interquartile rmedi-ange (IQR), depending on data distribution. Differences between the groups were tested using Kruskal-Wallis test followed by Mann-Whitney or ANOVA test followed by Student-New-man-Keuls for post hoc comparisons, as indicated for particular variable.
The receiver operating characteristic (ROC) curve analysis was performed. The area under curve (AUC) with its 95% confidence intervals (95% CI) was used to determine the efficacy of elasticity parameters to discriminate between these groups. Diagnostic efficacy for elasticity parameters was assessed through sen-sitivity and specificity. Statistical analysis was per-formed using the MedCalc software package (Mar-iakerke, Belgium). For all calculations, the a level was set at 0.05.
Results
Thirty-four patients comprised the high-risk lesion group, median age 56 (range 37-76) years. Patients with DCIS (n=29) were slightly older, median age 59 (range 28-86), as were patients with invasive carcino-ma (n=167, median age 59, range 31-90), however, the groups did not differ significantly according to age (Table 1).
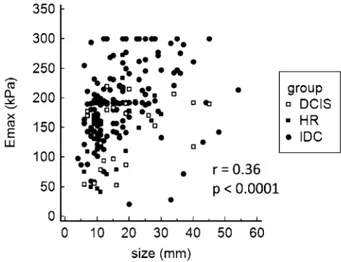
The median size of all evaluated lesions was 15 mm (mean 17.2 mm; SD 9.6 mm; range 4-54 mm), with no significant difference between the lesion groups (Table 1). There was a significant correlation between lesion size and stiffness (r=0.36; p<0.001) (Fig. 1). The subgroup analysis of the high-risk lesion group showed ductal proliferative changes with atypia (ADH) to be the most frequent finding (n=20), with the mean size of 14.6 mm. Lobular neoplasia was observed in five patients (2 lobular carcinomas in situ and 3 atypical lobular hyperplasia lesions), and it comprised the
larg-Table 1. General and sonoelastographic characteristics of high-risk lesions, ductal carcinoma in situ and ductal invasive carcinoma on shear-wave elastography
HRL DCIS IDC Number of tumors 34 29 167 Agea (years) 56 (37-76) 59 (28-86) 59 (31-90) Sizeb (mm) 15.1±7.1 18.6±11.1 17.2±9.7 Emaxb (kPa) 124.8±61.3† 143.7±49.9† 192.1±59.5*# Emeanb (kPa) 108.1±52.5† 125.8±42.9† 164.8±49*# Eminb (kPa) 86.4±45.1† 97.2±35.7† 127.4±42.2*# E-ratioa 3.7 (2.6-5)#† 6 (4.6-7.8)*† 7 (5.5-10)*#
aValue is presented as median with range; Kruskal-Wallis test followed by Mann-Whitney-U test was used; bvalue is presented as mean ± standard deviation; for statistical evaluation, ANOVA followed by
Student-Newman-Keuls test post-hoc comparisons tests were used; *p<0.05 in comparison with HRL; #p<0.05 in
comparison with DCIS; †p<0.05 in comparison with IDC; HRL = high risk lesions; DCIS = ductal
carci-noma in situ; IDC = invasive ductal carcinoma; Emax = maximum stiffness; Emean = mean stiffness; Emin = minimum stiffness; E-ratio = lesion-to-fat ratio
Fig. 1. Correlation of maximum lesion diameter (mm) and maximum lesion stiffness (kPa).
HRL = high risk lesions; DCIS = ductal carcinoma in situ; IDC = invasive ductal carcinoma; Emax = maximum stiffness
est lesion in the group, with the mean size of 18.7 mm. Papillomas were found in five patients, mean size 14.7 mm, while radial scar was observed in four patients with the mean size of 15 mm. The DCIS group that included pure in situ lesions had a mean size of 18.5 mm, which was not a significant difference in lesion size compared to other groups. The mean size of in-cluded invasive ductal carcinomas was 17.2 mm.
Quantitative values of maximal, mean and minimal elasticity, and E-ratio of high-risk group, DCIS group and invasive cancers are presented in Table 1. Sono-elastographic features were compared between the
high-risk and DCIS groups. They were also compared with features of invasive ductal cancers diagnosed in the same period. The high-risk group and DCIS group had significantly lower values of all sonoelastographic features as compared with patients with invasive can-cer (p<0.001) (Table 1).
When comparing in situ and high-risk lesions, all sonoelastographic parameters were higher in DCIS, however, only E-ratio (6 vs. 3.7) showed a statistically significant difference (p<0.001) (Table 1, Fig. 2).
The ability of elasticity values to discriminate be-tween the investigated groups was analyzed using ROC curves. In situ and invasive carcinoma could be distinguished by all investigated elasticity parameters, as follows: Emax (AUC 0.736, 95% CI 0.668-0.796, p<0.0001), Emean (AUC 0.722, 95% CI 0.654-0.784, p<0.0001), Emin (AUC 0.709, 95% CI 0.640-0.771, p<0.0001), and E-ratio (AUC 0.631, 95% CI 0.559-0.699, p<0.05). High-risk lesions could be distin-guished from in situ lesions by E-ratio (AUC 0.759, 95% CI 0.635-0.858, p=0.0001). Discriminatory ability of elasticity parameters between high-risk and
in situ lesions and in situvs. invasive carcinomas using the sensitivity and specificity at the specified cut-off point according to ROC curves is presented in Figures 2 and 3.
Within the high-risk group, stiffness of lesions var-ied among different subgroups. Radial scar lesions were the stiffest in the group (Emax 193.2±70.9 kPa). ADH had mean Emax 120±60.6 kPa, papillomas had Emax 111.5±45.6 kPa, while lobular neoplasia were
the softest lesions, with mean Emax 102.8±45.9 kPa. A small number of patients within each subgroup made the analysis of differences in elasticity features unreliable.
Regarding the gray-scale findings of DCIS lesions included in our study, 16 lesions presented as a hetero-geneous area, mostly isoechoic to breast parenchyma, 12 of them with hyperechoic dots representing inter-nal microcalcifications, and 3 with duct dilatation. An-other 13 DCIS lesions presented as hypoechoic areas, with internal calcifications in 5 lesions. There was no
difference in lesion stiffness according to sonographic findings, however, lesions with visible microcalcifica-tions were slightly stiffer, and only two of 16 had Emax values under 100 kPa.
Discussion
This pilot study conducted in a relatively small group of patients presented sonoelastographic features of high-risk lesions, a very important group of breast lesions that carry a significantly increased risk of breast
Fig. 2. Discriminatory ability of maximum, mean and minimum lesion stiffness and lesion-to-fat stiffness ratio between high-risk breast lesions and ductal carcinoma in situ, according to receiver operating characteristic (ROC) curves. Diagnostic efficacy for those values was assessed using the sensitivity and specificity at the specified cut-off point. ROC curve analysis, p values = 0.05 were considered statistically significant.
cancer development. Sonoelastographic features of DCIS were also presented.
The study confirmed SWE to be a valuable adjunc-tive tool for differentiation of benign and malignant breast lesions, as demonstrated in several studies so far4-7,21, and that it could also be used to differentiate
ductal in situ from invasive breast carcinoma. A few previous studies have described diagnostic perfor-mance of elasticity parameters, with various results re-garding their discriminatory value, where some4,22,23
have described the E-ratio as most valuable in benign/ malignant differentiation. In our study, the E-ratio
proved to be the best, i.e. the only discriminatory so-noelastographic feature between high-risk lesions and DCIS, which might have clinical importance.
Several studies have reported the correlation be-tween lesion size and stiffness21,24,25, which was
con-firmed by our finding of a significant correlation be-tween overall lesion size and stiffness (Fig. 1). In their study of more than 1500 breast lesions, Berg et al.24
also report that high-risk lesions are stiffer than usual benign lesions (median Emax 71 kPa vs. 45 kPa), and softer than DCIS and malignant carcinomas, which is concordant with our results. The median Emax of 12
Fig. 3. Discriminatory ability of maximum, mean and minimum lesion stiffness and lesion-to-fat stiffness ratio between ductal carcinoma in situ and ductal invasive carcinoma, according to receiver operating characteristic (ROC) curves. Diagnostic efficacy for those values was assessed using the sensitivity and specificity at the specified cut-off point. ROC curve analysis, p values = 0.05 were considered statistically significant.
DCIS lesions in the first large study by Berg et al.26
was 133 kPa (IQR 72-180), whereas in the other, pre-viously cited study24 maximum stiffness of 23 DCIS
lesions was 126 kPa (71-180). These results are slightly lower than ours (143.7 kPa), which might be explained by the use of a prototype machine in the study by Berg
et al., where the maximum display of 180 kPa was used. Presumably for the same reason, the maximum stiff-ness of ductal invasive carcinomas was slightly higher in our study (192.1 kPa) compared to 180 kPa in their study.
The mean stiffness of DCIS (7 lesions) is reported to be 117.8±54.72 kPa21, which is quite similar to our
value of 125.8±42.9 kPa. Another study showed that DCIS lesions were softer than invasive malignant le-sions27, however, without precise quantitative values.
DCIS lesions tend to show benign sonoelastographic characteristics, i.e. false-negative sonoelastographic re-sults, and with the cut-off value of 50 kPa set for Emean 4/9 lesions could be considered soft. With a threshold maximum stiffness of 80 kPa26, 6/29 lesions
(20.7%) in our DCIS group would be misclassified. With the same cut-off value, the false-negative rate for malignancy in the group of invasive carcinoma would be 5.4%, which is in line with previous studies26-28.
In a recent study, Lee et al.29 have presented
inter-esting and detailed US findings of 126 DCIS lesions, with positive findings in 86.5% of lesions, including 19 mammography negative cases. Non-mass lesions with microcalcifications on mammography presented mainly as heterogeneous hyper- or isoechoic parenchy-ma with visible hyperechoic dots, without posterior acoustic features, while mass lesions had oval shape, parallel orientation and were mildly hypoechoic. DCIS lesions without microcalcifications presented as a round or oval mass, with microlobulated margin and parallel orientation, also heterogeneous and hypoechoic. Our gray-scale US findings are consistent with the above mentioned study, showing that DCIS mainly presents as a heterogeneous area, primarily hyper- or isoechoic, with detectable microcalcifications, seen as hyperechoic dots within the lesion in the majority of cases.
The most frequent lesion in our high-risk group
was ADH. Compared to a previous study24, maximum
stiffness values were somewhat higher in our study (120 kPa vs. 83 kPa), but again lesions in our group were larger and higher in numbers (20 vs. 4 ADH le-sions). Papillary breast lesions are uncommon, and ma-lignant forms comprise less than 2% of all breast can-cers9,30. Previous studies suggest that size is a
signifi-cant indicator of malignancy, and papillary lesions larger than 1 cm are more likely to be malignant31,32.
Papillomas in our study group had the mean size of 14.7 mm and were found in older patients (age 59). Maximum stiffness was rather high, with mean Emax 111.5±45.6 kPa. The previously reported maximum stiffness of papillomas was 100 kPa, 87.7 kPa and 60.6 kPa24,31,32. Another lesion included in the high-risk
group is radial scar, which is considered as a benign proliferative lesion, but can be associated with atypia and/or malignancy on histology, and was found to in-crease the relative risk of breast cancer 1.33 to 2 times33,34. They are characterized as a central
fibroelas-tic core with radially arranged ducts and lobules9.
Ra-dial scars are especially interesting as they are also very similar to invasive cancer on mammography. We had four radial scars in our study group, with the mean size of 15 mm and very high stiffness (mean Emax 193.2±70.9 kPa). Berg et al.24 report somewhat lower
values (Emax 105 kPa), but two radial scar lesions in-cluded in their study were much smaller (median di-ameter 5 mm), so this could explain the discrepancy. Maximum stiffness values of lobular carcinoma in situ
(LCIS) have been reported to be 88.65 kPa and 41.1 kPa35,36. Presently, the Emax values are higher than the
above-mentioned elasticity values (102.8 kPa). As LCIS and ALH are mostly incidental findings during diagnostic workup of calcifications or associated mass lesions, we can hypothesize that these differences could be the result of concomitant pathology and cal-cification content, along with the size of the lesions included. Apparently, considerable heterogeneity of SWE features was observed among high-risk lesions.
There were several limitations to our study. We en-rolled a relatively small study population in the high-risk and DCIS groups, and in high-high-risk lesion sub-group analysis. Also, due to the retrospective design of the study, there might have been selection bias because some of included patients were referred to our breast center from other institution for secondary
manage-ment and core biopsy, so there might have been a higher incidence of complex lesions, especially in the high-risk group. Larger prospective studies are re-quired to further investigate high-risk breast lesions, in larger cohorts of patients. Interobserver variability was not assessed, since a single examiner performed the measurements, but the method has been shown previ-ously as highly reproducible if a uniform examination technique is utilized6,37.
Our study demonstrated that elasticity values of high-risk lesions were lower than those of both insitu
and invasive cancers, and a significant difference was observed between in situ and invasive lesions. Conse-quently, sonoelastographic features can help in the dis-tinction of lesions that carry a higher risk of malig-nancy and malignant lesions. Since high-risk lesions and DCIS detection has increased owing to wide-spread screening programs, increasing number of US examinations and image-guided tissue sampling, they are coming into the focus of interest for both diagnosis and treatment.
We believe that sonoelastography has a potential to help in the early diagnosis of these lesions and further studies are needed to demonstrate its place in the diag-nostic algorithm.
Acknowledgments
The study was conducted as part of the project en-titled Sonoelastography and MRI in Diagnosis and Treatment of Breast Cancer (IP 2016-06-2997) of the Croatian Science Foundation.
References
1. Croatian Institute for Public Health, Croatian National Can-cer Registry. Bulletin no.38: CanCan-cer incidence in Croatia 2013. 2. Berg WA, Gutierrez L, NessAiver MS, Carter WB, Bhargavan M, Lewis RS, et al. Diagnostic accuracy of mammography, clinical examination, US, and MR imaging in preoperative as-sessment of breast cancer. Radiology. 2004;233:830-49. DOI: 10.1148/radiol.2333031484
3. Stavros AT, Thickman D, Rapp CL, Dennis MA, Parker SH, Sisney GA. Solid breast nodules: use of sonography to distin-guish between benign and malignant lesions. Radiology. 1995; 196:123-34.
4. Olgun DC, Korkmazer B, Kilic F, Dikici AS, Velidedeoglu M, Aydoga F, et al. Use of shear wave elastography to differentiate benign and malignant breast lesions. Diagn Interv Radiol. 2014;20:239-44. DOI: 10.5152/dir.2014.13306
5. Athanasiou A, Tardivon A, Tanter M, Sigal-Zafrani B, Bercoff J, Deffieux T, et al. Breast lesions: quantitative elastography with supersonic shear imaging – preliminary results. Radiology. 2010;256:297-303. DOI: 10.1148/radiol.10090385
6. Evans A, Whelehan P, Thomson K, McLean D, Brauer K, Pur-die C, et al. Quantitative shear wave ultrasound elastography: initial experience in solid breast masses. Breast Cancer Res. 2010;12:R104
7. Sadigh G, Carlos RC, Neal CH, Dwamena BA. Ultrasono-graphic differentiation of malignant from benign breast lesions: a meta-analytic comparison of elasticity and BIRADS scoring. Breast Cancer Res Treat. 2012;133:23-35. DOI: 10.1007/ s10549-011-1857-8
8. Liu B, Zheng Y, Huang G, Lin M, Shan Q, Lu Y, et al. Breast lesions: quantitative diagnosis using ultrasound shear wave elastography – a systematic review and meta-analysis. Ultra-sound Med Biol. 2016 Apr;42(4):835-47. DOI: 10.1016/j.ul-trasmedbio.2015.10.024.
9. Rosai J. Breast. In: Rosai and Ackerman’s Surgical Pathology. 10th edn. Grad izdanja: Mosby, 2011; p. 1659-770.
10. Mišković J, Zorić A, Radić Mišković H, Šoljić V. Diagnostic value of fine needle aspiration cytology for breast tumors. Acta Clin Croat. 2016;55:625-8.
https://doi.org/10.20471/acc.2016.55.04.13
11. Dupont WD, Page DL. Risk factors for breast cancer in women with proliferative breast disease. N Engl J Med. 1985;312: 146-51.
12. Guray M, Sahin AA. Benign breast disease: classification, diag-nosis, and management. Oncologist. 2006;11:435-49.
13. Hartmann LC, Sellers TA, Frost MH, Lingle WL, Degnim AC, Ghosh K, et al. Benign breast disease and the risk of breast cancer. N Engl J Med. 2005;353:229-37.
14. Page DL, Dupont WD, Rogers WL, Rados MS. Atypical hyperplastic lesions of the female breast. Cancer. 1985:55; 2698-708.
15. Holland R, Peterse JL, Millis RR, Eusebi V, Faverly D, va de Vijver MJ, et al. Ductal carcinoma in situ: a proposal for a new classification. Semin Diagn Pathol. 1994;11:167-80.
16. Sanders ME, Schuyler PA, Dupont WD, Page DL. The natural history of low‐grade ductal carcinoma in situ of the breast in women treated by biopsy only revealed over 30 years of long‐ term follow‐up. Cancer. 2005;103:2481-4. DOI: 10.1002/ cncr.21069
17. Liberman L. Centennial dissertation. Percutaneous imaging-guided core breast biopsy: state of the art at the millennium. AJR Am J Roentgenol. 2000;174:1191-9.
18. Youk JH, Kim EK, Kim MJJ, Oh KK. Sonographically guided 14-gauge core needle biopsy of breast masses: a review of 2,420 cases with long-term follow up. AJR Am J Roentgenol. 2008; 190:202-7. DOI: 10.2214/AJR.07.2419
19. Džoić Dominiković M, Ivanac G, Kelava T, Brkljačić B. Elas-tographic features of triple negative breast cancer. Eur Radiol. 2016;26:1090-7. DOI: 10.1007/s00330-015-3925-7
20. Brkljačić B, Divjak E, Tomasović-Lončarić Č, Tešić V, Ivanac G. Shear-wave sonoelastographic features of invasive lobular breast cancers. Croat Med J. 2016;57:42-50. DOI: 10.3325/ cmj.2016.57.42
21. Chang JM, Moon WK, Cho N, Yi A, Koo HR, Han W, et al. Clinical application of shear wave elastography (SWE) in the diagnosis of benign and malignant breast diseases. Breast Cancer Res Treat. 2011;129:89-97. DOI: 10.1007/s10549-011-1627-7 22. Youk JH, Gweon HM, Son EJ, Han KH, Kim JA. Diagnostic
value of commercially available shear-wave elastography for breast cancers: integration into BI-RADS classification with subcategories of category 4. Eur Radiol. 2013;23:2695-704. DOI: 10.1007/s00330-013-2873-3
23. Au FW, Ghai S, Moshonov H, Kahn H, Brennan C, Dua H, Crystal P. Diagnostic performance of quantitative shear wave elastography in the evaluation of solid breast masses: determi-nation of the most discriminatory parameter. AJR Am J Roent-genol. 2014;203:W328-36. DOI: 10.2214/AJR.13.11693 24. Berg WA, Mendelson EB, Cosgrove DO, Dore CJ, Gay J,
Henry JP, et al. Quantitative maximum shear-wave stiffness of breast masses as a predictor of histopathologic severity. AJR Am J Roentgenol. 2015;205:448-55.
DOI:10.2214/AJR.14.13448
25. Evans A, Whelehan P, Thomson K, McLean D, Brauer K, Pur-die C, et al. Invasive breast cancer: relationship between shear-wave elastographic findings and histologic prognostic factors. Radiology. 2012;263:673-7. DOI: 10.1148/radiol.12111317 26. Berg WA, Cosgrove DO, Doré CJ, Schäfer FK, Svensson WE,
Hooley RJ, et al. Shear-wave elastography improves the speci-ficity of breast US: the BE1 multinational study of 939 masses. Radiology. 2012;262:435-49. DOI: 10.1148/radiol.11110640 27. Vinnicombe SJ, Whelehan P, Thomson K, McLean D, Purdie
CA, Jordan LB, et al. What are the characteristics of breast can-cers misclassified as benign by quantitative ultrasound shear wave elastography? Eur Radiol. 2014;24:921-6. DOI: 10.1007/ s00330-013-3079-4
28. Yoon JH, Jung HK, Lee JT, Ko KH. Shear-wave elastography in the diagnosis of solid breast masses: what leads to false-neg-ative or false-positive results? Eur Radiol. 2013;23:2432-40. DOI: 10.1007/s00330-013-2854-6
29. Lee MH, Ko EY, Han BK, Shin JH, Ko ES, Hahn SY. Sono-graphic findings of pure ductal carcinoma in situ. J Clin Ultra-sound. 2013:41;465-71.
30. Shin HJ, Kim HH, Kim SM, et al. Papillary lesions of the breast diagnosed at percutaneous sonographically guided bi-opsy: comparison of sonographic features and biopsy methods. AJR Am J Roentgenol. 2008:190;630-6.
31. Youk JH, Kim EK, Son EJ, Park BW, Kim SI. Benign papillo-ma without atypia diagnosed at ultrasound-guided 4-gauge core-needle biopsy: clinical and US features predictive of up-grade to malignancy. Radiology. 2010;258:81-8.
32. Kuzmiak CM, Lewis MQ, Zeng D, Liu X. Role of sonography in the differentiation of benign, high-risk, and malignant
papil-lary lesions of the breast. J Ultrasound Med. 2014;33:1545-52. doi:10.7863/ultra.33.9.1545
33. Lv M, Zhu X, Zhong S, Chen W, Hu Q, Ma T, et al. Radial scars and subsequent breast cancer risk: a meta-analysis. 2014; PLoS ONE 9(7): e102503.
34. Jacobs TW, Byrne C, Colditz G, Connolly JL, Schnitt SJ. Ra-dial scars in benign breast-biopsy specimens and the risk of breast cancer. N Engl J Med. 1999;340:430-6.
35. Lee EJ, Jung HK, Ko KH, Lee JT, Yoon JH. Diagnostic perfor-mances of shear wave elastography: which parameter to use in
differential diagnosis of solid breast masses? Eur Radiol. 2013; 23:1803-11. DOI: 10.1007/s00330-013-2782-5
36. Lee SH, Chang JM, Kim WH, Bae MS, Cho N, Yi A, Koo HR, Kim SJ, Kim JY, Moon WK. Differentiation of benign from malignant solid breast masses: comparison of two-dimen-sional and three-dimentwo-dimen-sional shear-wave elastography. Eur Radiol. 2013;23:1015-26. DOI: 10.1007/s00330-012-2686-9 37. Cosgrove DO, Berg WA, Doré CJ, Skyba DM, Henry JP, Gay
J, et al. Shear wave elastography for breast masses is highly reproducible. Eur Radiol. 2012;22:1023-32. DOI: 10.1007/ s00330-011-2340-y
Sažetak
SONOELASTOGRAFSKE KARAKTERISTIKE LEZIJA DOJKE VISOKOG RIZIKA
I DUKTALNOG KARCINOMA IN SITU – PROBNO ISTRAŽIVANJE
M. Crnogorac, G. Ivanac, Č. Tomasović-Lončarić, R. Žic, T. Kelava i B. Brkljačić
Cilj ove studije bio je izmjeriti kvantitativne vrijednosti tvrdoće lezija dojke visokog rizika i duktalnog karcinoma in situ
(DKIS) pomoću shear-wave sonoelastografije. Retrospektivno smo analizirali patohistološke, ultrazvučne i elastografske po-datke (maksimalna, srednja i minimalna tvrdoća, omjer tvrdoće lezije i masnog tkiva (E-omjer), veličina lezije) 228 bolesnica upućenih tijekom četvorogodišnjeg razdoblja na naš odjel radi biopsije dojke širokom iglom. Patohistološki su među 230 lezija dojke dijagnosticirane 34 lezije dojke visokog rizika, 29 duktalnih karcinoma in situ te 167 invazivnih duktalnih karci-noma dojke. Lezije visokog rizika pokazale su niže vrijednosti svih elastografskih parametara u usporedbi s duktalnim in situ
i invazivnim karcinomima, no u usporedbi s DKIS jedino je E-omjer pokazao značajnu razliku tvrdoće (3,7 prema 6; p<0,001). Sve su se sonoelastografske vrijednosti značajno razlikovale pri usporedbi duktalnih in situ i invazivnih karcinoma. Nađena je značajna povezanost veličine i tvrdoće lezije (r=0,36; p<0,001). Tvrdoća mjerena shear-wave sonoelastografijom dobro korelira s patohistološkim nalazom lezija dojke koje se mogu otkriti ultrazvukom. Vrijednosti tvrdoće lezija visokog rizika su značajno niže od onih kod malignih lezija. Također smo pokazali da DKIS, uz ultrazvučni nalaz tipičnih mikrokal-cifikata u najvećem broju slučajeva, ima i značajno manje vrijednosti tvrdoće od invazivnih karcinoma.
Ključne riječi: Dojka, tumori – dijagnostika; Dojka, tumori – klasifikacija; Elastični modul; Ultrazvučno snimanje dojke; Ela-stičnost, slikovne tehnike; Osjetljivost i specifičnost; Karcinom, duktalni; Shear-wave elastografija