Foreign-owned Banks in Indonesia: Mode of Entry, Loan
Portfolio Structure and Returns
Apriani D.R Atahau
1*
Tom Cronje**
The manner in which foreign-owned banks establish themselves in other countries is usually shaped by banking regulations and practices applicable to the parent banks in such host countries. The objective of this study is to examine whether the loan portfolio structures and returns of foreign-owned banks that define their different modes of entry to the Indonesian banking sector differ between themselves. This research pertains to 295 foreign-owned banks over the period 2003 to 2011. Data were obtained from the Indonesian Banking Directory of the Indonesian Central Bank, commercial bank annual reports provided by Infobank magazine, and the Indonesian Banking Development Institute. Descriptive statistics, univariate statistics and pooled regression analysis were utilised in the analysis of these data. Findings indicate that clear differences exist between the loan portfolio structures and returns of foreign-owned banks having used different modes of entry to the Indonesian banking sector.
Keywords: Foreign-owned banks, loan portfolio structures and returns, Indonesia, mode of entry
Field of Research: Banking
*The author would like to thank Indonesian Government for providing DIKTI Scholarship. Apriani is a PhD student at School of Economics and Finance, Curtin University-Australia and based at Satya Wacana Christian University, Salatiga-Indonesia
2
1 Introduction
Foreign-owned banks (FBs) are generally established when they follow their home
country’s multinational customers and/or pursue opportunities in host countries (Cull and Martinez Peria, 2010)2. Foreign-owned banks often expand their presence to non-local
geographical areas by either acquiring “domestic institutions with extensive branch
networks” or by establishing “isolated representative offices aimed at serving niche market segments” (Cerutti et al. (2007) 1670). Based on research by Cerutti et al. (2007), in Latin America and Eastern Europe, branch establishment is the preferred method when host country taxes are high and foreign banks do not target retail segments. 3 In a host country in which there is a substantial possibility of expropriation, foreign banks prefer having branches rather than subsidiaries. In essence, the choice between branches or
subsidiaries largely depends on a parent bank’s desired market activity in a foreign country
and the risks involved.
By relaxing the regulations regarding foreign bank entry and operation, many countries have eased the establishment of foreign banks. Advances in technology, the integration of financial systems and increased liberalisation have also enhanced foreign bank presence in many countries (Claessens and Horen, 2012). As a country hard hit by the 1997 financial crisis, with many Indonesian banks were not financially able to participate in the recapitalisation program, (Montgomery, 2003), Indonesia had to raise the limit of foreign ownership in domestic banks from 51% to 99%, through the enactment of government regulation (Peraturan Pemerintah) number 29/1999. Moreover, since 1999, foreign banks have been unrestricted to opening branches in any location throughout Indonesia. They may, since then, operate as a branch, a subsidiary (through direct investment or capital market investment) and a representative office. The majority of those banks chose to acquire shares in existing domestic banks rather than establishing new branches (Goeltom, 2005). These legislation changes have increased foreign bank presence in Indonesia.
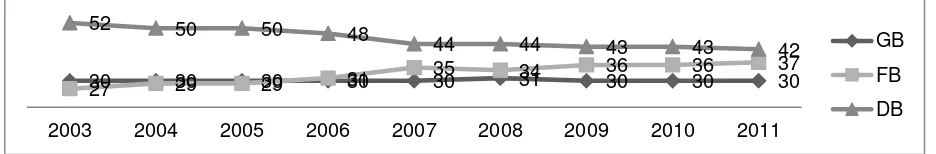
Figure 1.1 depicts the number of commercial banks in Indonesia based on ownership types4 after the Asian Financial Crisis. The number of FBs increased from 27 to 37 due to the relaxation of limitation on foreign ownership in domestic banks (DBs), whereas the number of DBs declined over the 2003 to 2011 period. In contrast to FBs and DBs, the number of government-owned banks (GBs) remained unchanged (30 banks).
Figure 1.1 Number of Banks Based on Ownership Types
2Another reason relates to institutional and regulatory similarities between the parent bank country of origin
and its subsidiary (foreign branch) country. In some cases, economic and cultural bounds between home and host countries serve as another consideration (Cull and Peria, 2010)
3This empirical literature is consistent with the prediction of the model for bank organisational forms by Dell’
Ariccia and Marquez (2010)
4 The number exclude Islamic banks and based on direct ownership measurement for the dominant
shareholders (50% direct ownership)
2003 2004 2005 2006 2007 2008 2009 2010 2011
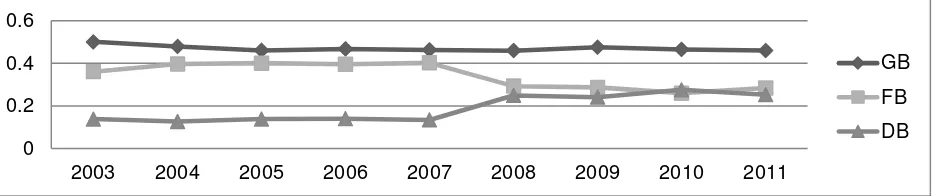
3 Although the number of FBs increased over the 2003-2011 period, Figure 1.2 shows that they also experienced a decline in their market share as a percentage of total bank assets based on data retrieved from Indonesian Banking Statistics.
Figure 1.2 Market Share of Government-, Foreign-, and Domestic-owned Banks (as Percentage of Total Assets of all Banks)
Previous research of Havrylchyk and Jurzyk (2006) in Central and Eastern European Countries for the period 1995-2003 indicates that the mode of FB entry is one of the determinants of bank profitability. They found greenfield FBs (FBs that enter via greenfield investment) are more profitable than acquired FBs (FBs that acquire domestic institutions). Another study by Claeys and Hainz (2006) focused on the impact of FB mode of entry on information and bank lending rates. They found that greenfield FBs charge lower lending rates as they focus more on non-opaque borrowers (large enterprises with hard information available).
A number of empirical studies analysed the increased presence of FBs in developing countries including Indonesia (Claessens et al., 2001, Claessens et al., 2010, Claessens et al., 2008, Clarke et al., 2001a, Clarke et al., 2001b, Clarke et al., 2002, De-Haas and Van Lelyveld, 2003, De-Haas and Naaborg, 2006, Montgomery, 2003, Unite and Sullivan, 2003, Cull and Peria, 2010, Chen and Liao, 2011, Giannetti and Ongena, 2012). None of the retrieved studies analysed FB performance using loan portfolio returns. In all cases return on equity and total assets was used as measure of bank performance. As such, the impact of different modes of FB entry on loan portfolio composition and returns of banks in Indonesia has not been researched to date. To address the existing research gap, the objective of this study is to examine whether different loan portfolio structures exist for different modes of FB entry in Indonesia and to determine the impact on their loan portfolio returns. Accordingly, this research contributes to the academic literature by using bank-level information about loan portfolio structures (based on economic sector categories and loan types) and returns, which at the same time, relates to different modes of FB entry.
Findings from this research show that the economic sector loan portfolio concentration (EHHI) of the acquired and greenfield FBs differ over the total study period with greenfield FBs being more concentrated. They also show a decrease in concentration over the period 2003 to 2011. However, the loan types portfolio concentration (THHI) for all types of FBs shows a tendency to convergence over the period 2003 to 2011. The more concentrated EHHI of Greenfield FBs show higher default risk and lower return. These findings do not support the corporate finance theory, according to which banks should implement focus strategies to reduce agency problems and exploit their management expertise in certain sectors. The findings support the traditional banking and portfolio theory that banks should diversify their loan portfolios to reduce risk (Hayden et al., 2006).
0 0.2 0.4 0.6
2003 2004 2005 2006 2007 2008 2009 2010 2011
4
2 Literature Review
With focus on foreign bank entry and credit allocation, Degryse et.al (2009, 2012) formulated the performance hypothesis and portfolio composition hypothesis. Under the performance hypothesis, foreign banks may perform more efficiently than DBs since they possess better managerial skills, policies and procedures over more resources that result in lower operational costs.
When comparing greenfield and acquired FBs with regard to this performance hypothesis, it can be assumed that this condition will be more significant for greenfield banks as they do not inherit possible bad loans and inefficient organizational structures of existing DBs. FBs may, in the case of take-overs or acquiring existing DBs, need transitional time to improve their lending practices and loan portfolios. However, greenfield FBs have less access to loan information about domestic borrowers which increase their information asymmetry with regard to these borrowers.
The portfolio composition hypothesis of Degryse et.al (2009, 2012) attempt to explain
banks’ choices of clients. It argues that FBs have an advantage in lending based on hard information, consisting of credit history and detailed financial statement information (Dell'Ariccia and Marquez, 2004, Detragiache et al., 2008). They are also in a better position to lend to multinational corporations headquartered in their home countries. In contrast, DBs have the ability to gain knowledge from soft information provided by opaque firms that can produce less hard information. This is achieved by way of relationship lending (Berger and Black, 2011). FBs that acquire or take over existing DBs may in this regard experience a different situation than greenfield FBs since relationship lending may exist and continue after the acquirement or take over. According to Havrylchyk and Jurzyk (2006) greenfield banks tend not to engage in relationship lending because they are more independent with large deposit networks from their parent banks. This affects the currency composition of their loan portfolios with more foreign currency loans available for their host country borrowers (Degryse et al., 2012). Greenfield FBs also focus on short-term lending due to their commitment to the host countries. Thus, it is concluded by Degryse et al. (2012) that both the performance and portfolio composition hypotheses are stronger for greenfield FBs due to their larger efficiency advantage and larger information disadvantage compared to that of acquired FBs and DBs.
When considering the extent of competition and interest rate returns of FBs, Claeys and Hainz (2006) argue that the mode of entry affects the level of competition. The competition between all bank ownership types is stronger when entry is predominantly in the form of
greenfield investments, since it represents an increase in the number of banks in the host
country.A study conducted by Claeys and Hainz (2006) in 10 Eastern European countries
over the period 1995-2003 found that DBs charge lower lending rates when FB entries
happen via greenfield investment.
Empirical evidence regarding the effect of FB mode of entry on lending rates in developing and transition countries conclude that greenfield FBs charge lower lending rates and have smaller spreads than acquired FBs and DBs. Martinez Peria and Mody (2004) empirically analyzed FB participation market concentration and interest rate spreads in a sample of
five Latin American countries during the late 1990s. They found that greenfield FBs have
lower spreads than the acquired FBs. Since greenfield FBs may be more concerned with
gaining market share than acquired FBs, they tend to set prices more aggressively, thus
5 about domestic borrowers (incumbent firms), they focus more on the transparent-large borrowers in a more competitive market segment (Dell'Ariccia and Marquez, 2004).
Based on the aforementioned empirical research findings with regard to differences between greenfield and acquired FBs it is hypothesized that the mode of FB entry in Indonesia has a significant relationship with the loan portfolio composition of FBs, the risk of the loan portfolios and the return on the loan portfolios.
2.2 Foreign Bank Entry into the Indonesian Banking Sector
Major reform of the Indonesian banking industry commenced with the enactment of Banking Act No 14/1967. This legislation enabled FBs to access the Indonesian market in the form of branches and representative offices, after they had been expelled in the 1950s (McLeod (1996) and Montgomery (2003)). Ten FB’s established branches in Indonesia; however, their operations were restricted to the Indonesian capital city and only two offices with no deposit- taking activities (McLeod, 1996). Their presence was primarily allowed to supplement the supply of capital to medium-size and large businesses (Suyatno, 1999). The permission for FB entry did not last long. In 1969, the government again banned new FB entries (Montgomery, 2003) and continued the ban until 1988 (Harun, 2008).
The 1988 package relaxed numerous bank establishment regulations to foster competition in the banking industry. The deregulation granted FBs permission to open sub-branches in seven major cities/islands in Indonesia: Surabaya, Semarang, Bandung, Medan, Ujung Pandang, Denpasar, and Batam. Furthermore, the government allowed foreigners and Indonesian citizens to establish joint-venture banks. Within one year after bank establishment, loans allocated to support export activities had to constitute at least 50 per cent of a joint-venture bank’s total loan portfolio.
As a result, the Indonesian banking industry experienced an accelerated increase in the number of banks. FBs became more prominent after the 1988 reforms. Their number increased from 11 in 1988 to 29 in 1991 (Pangestu, 2003). These banks began to offer retail-banking services in addition to their former focus on corporate accounts. The number increased from 30 in 1992 to 44 in 1998. Due to the Asian Financial Crisis, the number decreased from 43 in 1999 to 34 in 2002 (Bank Indonesia Annual Report). Since 2003 there has been a reversal trend as a result of banking restructuring following the crisis. This reversal provided an opportunity to foreign investors to invest in Indonesian banking industry. As a result, the number of FBs reach 37 banks in 2011.
3 Research Methodology
3.1 Sample, Types and Sources of Data
6
3.2 Variable Definition and Measurement
The dependent variable in this research is the loan portfolio return of FBs expressed as loan interest income as a percentage of total loans. Three independent variables are applied: the type of FB ownership, loan portfolio concentration and loan repayment default risk. FB ownership types consist of two groups, namely, acquired and greenfield FBs . The categories are differentiated by dummy variables (1 for acquired FBs and 0 otherwise) to represent the two different modes of FB entry. The loan portfolio concentration is measured using the Hirschman Herfindahl Index (HHI) which was also used by Winton (1999), Acharya et al. (2002) and Hayden et al. (2006).5 For this research, two types of
HHI’s are applied, namely Economic Sector HHI (E-HHI) and Loan Type HHI (T-HHI). The loan repayment default risk is measured by the ratio of non-performing loans (NPLs) to total loans. The control variables representing bank-specific characteristics in this study are: bank sizes, bank equity, and bank liquidity. This research uses the natural logarithm of Total Assets to account for bank size. Bank equity is measured by the ratio of Total Equity to Total Assets and the liquidity is measured by the ratio of Total Loans to Total Deposits. Appendix 1 reflects all the variables, their definitions and how they are measured.
3.3 Data Analysis
All research data is numerical, therefore quantitative data analysis is applied. Firstly, descriptive statistics of the variables (means and standard deviations) are calculated to determine data tendency and deviations. Secondly, univariate statistics in the form of the test of means are used to find the differences in the loan portfolio composition, risk and return of acquired and greenfield FBs. The Mann-Whitney non-parametric test is applied since the data is not normally distributed. Thirdly, to determine the impact of FB mode of entry, loan portfolio concentration and loan repayment default on loan portfolio returns, the following pooled data regression equation is used:
� �� = + � ��+ �� ��+ � � + �� + � � � + ��………(3.1)
Where:
� �� = loan portfolio return for bank i in year t
� �� = ownership dummy
� �� = economic sector loan portfolio concentration
� �� = loan type portfolio concentration
��� = loan portfolio default payment risk for bank i at year t
� � �� = vector of bank specific control variables
, , , , = regression coefficients; and
�� = the disturbance term.
Pooled regression rather than panel data regression is used because of the problems related to applying the fixed and random panel data model. The fixed effects panel data regression does not allow the estimation of time-invariant coefficients (i.e effect of greenfield ownership on loan portfolio returns) whereas the random effects panel data regression produces inconsistent parameter estimates.
5 There are 10 Indonesian economic sectors to which banks can lend. Central bank classifications are as follows:
7
4 Findings
4.1 Descriptive Statistics
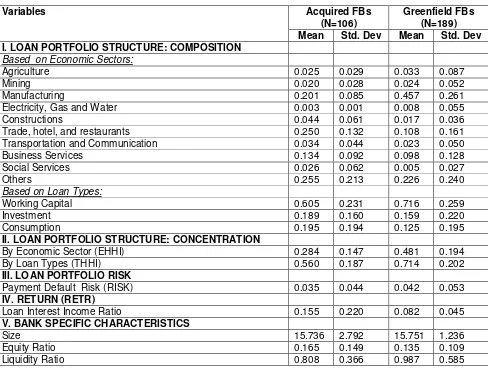
Table 4.1 contains the summary statistics for the variables in the equation 3.1. The first part presents the descriptive statistics regarding loan allocation based on economic sectors and loan types. Acquired FBs are the major loan provider to others, trade, and manufacturing whereas greenfield FBs focus on manufacturing, others and trade. In terms of loan types, both types of FBs focus on working capital loans with greenfield FBs more concentrated in this loan type than acquired FBs. By analyzing the mean and the standard deviation of HHI as a concentration measure, it can be seen that both measures (EHHI and THHI) show that overall the loan portfolios of acquired FBs seem to be more diversified than that of the greenfield FBs.
The average 3.5% gross NPL percentage of acquired FBs is low in contrast to the average 4.2% gross NPL percentage of greenfield FBs. This serves as evidence that the risk exposure of greenfield FBs are higher than that of acquired FBs. The loan interest ratio means of acquired FBs exceed that of greenfield FBs significantly. Considering the aforementioned descriptive statistics it is evident that greenfield FBs have higher sector and loan type concentration risk, higher loan repayment default risk, and lower loan portfolio returns.
Table 4.1 Descriptive Statistics of Research Variables
Variables Acquired FBs Based on Economic Sectors:
Agriculture 0.025 0.029 0.033 0.087
Mining 0.020 0.028 0.024 0.052
Manufacturing 0.201 0.085 0.457 0.261
Electricity, Gas and Water 0.003 0.001 0.008 0.055
Constructions 0.044 0.061 0.017 0.036
Trade, hotel, and restaurants 0.250 0.132 0.108 0.161 Transportation and Communication 0.034 0.044 0.023 0.050
Business Services 0.134 0.092 0.098 0.128
Loan Interest Income Ratio 0.155 0.220 0.082 0.045
V. BANK SPECIFIC CHARACTERISTICS
Size 15.736 2.792 15.751 1.236
Equity Ratio 0.165 0.149 0.135 0.109
8
4.1.2 Loan Portfolio Concentration and Composition: Acquired and
Greenfield Foreign-owned Banks
The EHHI and THHI loan portfolio concentration of acquired and greenfield FBs is graphically depicted in Figures 4.1 and 4.2.
4.1.2.1 Economic Sector Bank Loan Portfolio Concentration (EHHI)
Greenfield FBs are the most EHHI concentrated over the total research period although they show a decrease in concentration over the period 2005 to 2011. In contrast, the EHHI concentration levels of acquired GBs tend to increase over the 2003 to 2009 period with a minor decrease from 2009 to 2011(Figure 4.1). These findings indicate the overall tendency of greenfield FBs to diversify loan portfolio composition although remaining more concentrated than acquired FBs.
Figure 4.1 Loan Portfolio Concentration Based on Economic Sectors: Acquired and Greenfield Foreign-owned Banks
4.1.2.2 Loan Type (THHI) Bank Loan Portfolio Concentration
Figure 4.2. shows that from 2003 to 2007, the THHI levels of both acquired and greenfield FBs are very different from each other, but shows a converging tendency from 2007 onwards since acquired FBs tend to become more concentrated whilst the loan portfolios of greenfield FBs become slightly more diversified. The tendency is similar to EHHI as shown previously in Figure 4.1.
Figure 4.2 Loan Portfolio Concentration Based on Loan Types: Acquired and Greenfield Foreign-owned Banks
0 0.2 0.4 0.6
2003 2004 2005 2006 2007 2008 2009 2010 2011
Acquired Greenfield
0 0.2 0.4 0.6 0.8
2003 2004 2005 2006 2007 2008 2009 2010 2011
9
4.1.2.3 Loan Portfolio Composition: Acquired and Greenfield
Foreign-owned Banks
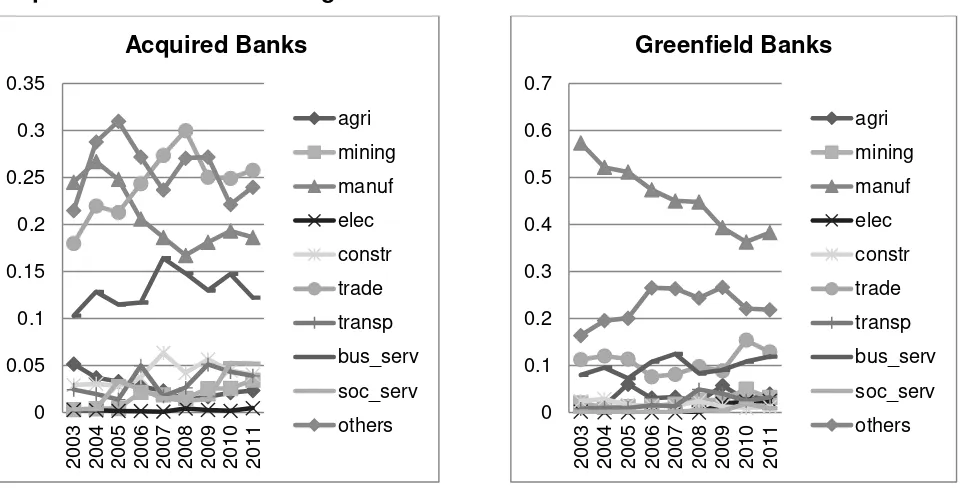
The economic sector focus of acquired and greenfield FBs for the period 2003 to 2011 is depicted in Figure 4.3. Acquired FBs focus primarily on four different economic sectors (trade, others, manufacturing and business services) with the exposure ranging between 10% and 31% in each of the sectors. The exposures to these sectors are volatile and change significantly from year to year with an overall downturn in their loan exposure to the manufacturing sector. Greenfield FBs focus primarily on the manufacturing sector with a decline from 57% exposure in 2003 to 38% in 2011. Unspecified others is the second largest focus of greenfield FBs with an increasing trend from 16% in 2003 to 21% in 2011 of exposure to this sector. Therefore, it is evident that the loan portfolio composition of the acquired and greenfield FBs differ, with the latter being more concentrated.
Figure 4.3 Percentage Loan Portfolio Allocation to Different Economic Sectors for Acquired vs Greenfield Foreign-owned Banks
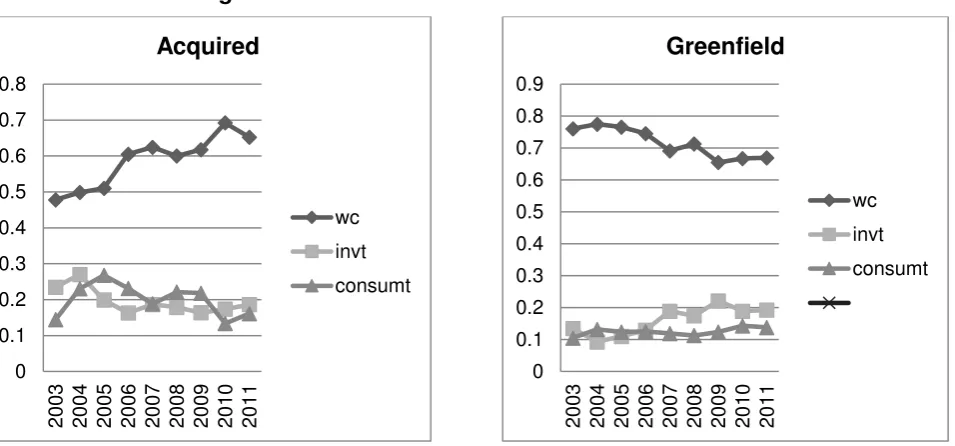
Working capital loans represent the vast majority of loans for both acquired and greenfield FBs although working capital loans of acquired FBs increased over time (from 47% to 65%) whilst that of greenfield FBs decreased (from 76% to 66%). In the case of acquired FBs, their loan exposures to investment loans and consumer loans declined in total from 52% to 35%, whilst these loan exposures of greenfield FBs increased from 24% to 34%. It is evident that the THHI of acquired FBs are more concentrated over time whilst that of greenfield FBs are more diversified and that the loan type portfolio compositions of the two types of FBs are much more similar in 2011 than in 2003.
13
Figure 4.5 Percentage Loan Portfolio Allocation Based on Loan Types for Acquired and Greenfield Foreign-owned Banks
4.1.2 Loan Portfolio Performance (Risk and Return) of Acquired vs
Greenfield Foreign-owned Banks
The ratio of gross NPLs to Total Loans (TLs) is depicted in Figure 4.7.
Figure 4.7 Loan Repayment Default Risk of Acquired and Greenfield Foreign-owned Banks for the period 2003 to 2011
The NPLs of the acquired and greenfield FBs differ the most from each other in 2003, but very little from 2009 onwards. Overall, the NPLs for both the acquired and greenfield banks show a decreasing trend from 2003 to 2011. It indicates that the overall credit risk of banks decreases and that the quality of their loan portfolios improved over the nine-year study period.
Figure 4.8 Loan Portfolio Returns of Acquired and Greenfield Foreign-owned Banks
0
2003 2004 2005 2006 2007 2008 2009 2010 2011
Acquired
2003 2004 2005 2006 2007 2008 2009 2010 2011
15 Figure 4.8 depicts the loan interest income ratios for acquired and greenfield FBs over the period 2003-2011. In general, both acquired and greenfield FBs experience a small downward trend in their gross interest income from 2003 to 2011. This is due to changes
in the central bank interest rate6 (from 12.75% in 2005 to 6% in 2011). It affects all banks
but notwithstanding such changes, banks still apply different rates based on inter alia their specific market segments and supply and demand for the loans that they provide. Acquired FBs show the highest loan interest income in all years. Considering this situation, acquired FBs in general have a higher average return than greenfield FBs over the research period.
4.2 Differences in the Loan Portfolio Structure and Performance of
Acquired and Greenfield Foreign-owned Banks
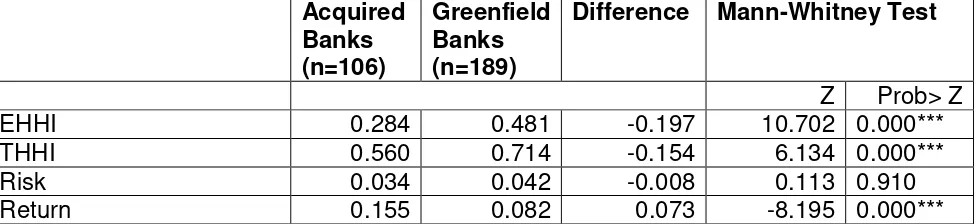
Table 4.2 displays the results of the Mann-Whitney test to verify the descriptive statistic findings presented in the previous section.
Table 4.2 Univariate Statistics for the Loan Portfolio Structure and Performance of Acquired and Greenfield Foreign-owned Banks
Acquired Banks (n=106)
Greenfield Banks (n=189)
Difference Mann-Whitney Test
Z Prob> Z
EHHI 0.284 0.481 -0.197 10.702 0.000***
THHI 0.560 0.714 -0.154 6.134 0.000***
Risk 0.034 0.042 -0.008 0.113 0.910
Return 0.155 0.082 0.073 -8.195 0.000***
Legend: The Mann-Whitney tests are conducted for testing the loan portfolio structure and performance median differences between the acquired and greenfield FBs over the nine-year study period. Statistically significant differences at 1%, 5%, and 10% significance levels are respectively indicated by ***, **, and *.
The Mann-Whitney test shows that there are statistically significant differences in the loan portfolio concentration and in the loan portfolio return of acquired and greenfield FBs. Overall, it confirms that the mode of entry significantly explain the loan portfolio structures and returns of FBs in Indonesia.
4.3 Empirical Results
Table 4.3 presents the pooled regression used to determine the relationship between FB mode of entry, their EHHI and THHI loan portfolio concentration levels, their loan repayment default risk (loan portfolio risk), and control variables with their loan portfolio returns.
16
Table 4.3 Pooled Regression: Relationship between Bank Size; Loan Portfolio Structures; Loan Portfolio Risk, and Control Variables with Loan Portfolio Returns
Loan Portfolio Returns
CONSTANT Coefficient -0.0195
t-Statistic -0.17
FB mode of entry Coefficient 0.076***
t-Statistic 3.76
EHHI Coefficient -0.003
t-Statistic -0.06
THHI Coefficient 0.010
t-Statistic 0.21
NPL Coefficient 0.321**
t-Statistic 1.98
SIZE Coefficient 0.006
t-Statistic 1.11
EQUITY Coefficient 0.039
t-Statistic -0.51
LIQUIDITY Coefficient -0.001
t-Statistic -0.55
No of observations 295
Legend: This table present the pooled regression of equation 3.1. The dependent variable is Loan Portfolio Returns (Loan Interest Income - Intinc). The independent variables are mode of FBs entry (acquired and greenfield FBs), loan portfolio concentration based on economic sector (EHHI) and based on loan types (THHI), and loan repayment default (NPL), size, liquidity and equity ratio. ***, **, and * respectively correspond to 1%, 5%, and 10% significance levels.
Table 4.3 shows that FB mode of entry and NPL significantly affect loan portfolio returns. The positive coefficients of the FB entry dummy regressors show that the relationship of acquired FBs with loan portfolio returns is more than that of greenfield FBs. The 1% statistical significance of the FB entry coefficient provides evidence that mode of entry of FBs affect loan portfolio returns. The estimation result also support the previous descriptive analysis which shows that the loan portfolio returns of majority acquired FBs are better than that of greenfield FBs. The result does not support the findings of Havrylchyk and Jurzyk (2006) in Central and Eastern European Countries in which greenfield FBs experience higher returns than acquired since acquired FBs took over less profitable DBs. The results also contradict the findings of Martinez Peria and Mody (2004), Majnoni, Shankar and V`arhegyi (2003) in which greenfield FBs experience higher profits than acquired FBs (Claeys and Hainz, 2006). Further observations conducted in this research about the characteristics of the previously DBs acquired in Indonesia reveals the contrary evidence to those of Havrylchyk and Jurzyk (2006). The acquired DBs are generally large in size (4.5 times of DBs), have good liquidity ratios (2 times of DBs) and large market share. Finally, the positive and significant relationship between NPL and loan portfolio return supports the high risk high return relationship.
5 Conclusions
17 The findings support the hypotheses that acquired and greenfield FBs differ with regard to loan portfolio composition, concentration and return. The loan portfolios of greenfield FBs are more concentrated and focus on the manufacturing sector whereas acquired FBs have more diversified loan portfolios with more exposure to others (primarily consumer) sectors although a high level of concentration in the trade sector started in 2006.
The NPLs of the acquired and greenfield FBs differ the most from each other in 2003, but
very little from 2009 onwards. Regulation PBI 2/11/PBI/2000 jo PBI 15/2/PBI/2013 of the
Central Bank that implemented a 5% standard for the net NPL ratio of banks may have prompted all FBs to adjust their credit risk assessment and/ or qualifying criteria for loans. The decrease in the overall NPLs of Indonesian banks may also result from the prudential regulations like productive asset quality, loan loss provision, and loan restructuring enacted by the Central Bank since 2003 (Indonesian Banking Booklet, 2003 and 2011). On the other hand, it may also be complimented by external economic factors not researched in this study.
Differences in the loan portfolio composition and concentration of different FBs result in different loan portfolio returns. Acquired FBs show a higher loan portfolio return than greenfield FBs. The result does not support the findings of Havrylchyk and Jurzyk (2006) in Central and Eastern European Countries in which greenfield FBs experience higher returns than acquired FBs since acquired FBs took over less profitable domestic-banks. This might be explained by the facts that in Indonesia that were acquired by FBs have better average bank-specific characteristics in terms of size and equity than DBs overall. The findings support the traditional banking and portfolio theory according to which banks should diversify their loan portfolio to reduce risk (Hayden et al., 2006), but contrary to the corporate finance theory, according to which banks should implement focus strategies to reduce agency problems and exploit their management expertise in certain sectors.
18 REFERENCES
ACHARYA, V. V., HASAN, I. & SAUNDERS, A. 2002. Should Banks be Diversified? Evidence From Individual Bank Loan Portfolios. Bank for International Settlements
BERGER, A. N. & BLACK, L. K. 2011. Bank Size, Lending Technologies, and Small Business Finance. Journal of Banking and Finance, 35, 724-735.
CERUTTI, E., ARICCIA, G. D. & PERIA, M. S. M. 2007. How Banks Go Abroad: Branches or Subsidiaries? Journal of Banking and Finance, 31, 1669-1692.
CHEN, S.-H. & LIAO, C.-C. 2011. Are Foreign Banks More Profitable Than Domestic Banks? Home- and Host-Country Effects of Banking Market Structure, Governance, and Supervision. Journal of Banking and Finance, 35, 819-839.
CLAESSENS, S., DELL'ARICCIA, G., IGAN, D. & LAEVEN, L. 2010. Cross-Country Experiences and Policy Implications from the Global Financial Crisis. Economic Policy. International Monetary Fund.
CLAESSENS, S., DEMIRGUC-KUNT, A. & HUIZINGA, H. 2001. How Does Foreign Entry Affect Domestic Banking Markets? Journal of Banking and Finance, 25, 891-911. CLAESSENS, S. & HOREN, N. V. 2012. Foreign Banks: Trends, Impact and Financial
Stability. International Monetary Fund.
CLAESSENS, S., NEELTJE, V. H., GURCANLAR, T. & MERCADO, J. 2008. Foreign Bank Presence in Developing Countries 1995-2006: Data and Trend.
CLAEYS, S. & HAINZ, C. 2006. Acquisition versus Greenfield: The Impact of the Mode of Foreign Bank Entry on Information and Bank Lending Rates. European Central Bank Working Paper Series
CLARKE, G. R. G., CULL, R. & MARTINEZ-PERIA, M. S. 2001a. Does Foreign Bank Penetration Reduce Access to Credit in Developing Countries?: Evidence From
Asking Borrowers. World Bank Policy Research Paper.
CLARKE, G. R. G., CULL, R., MARTINEZ-PERIA, M. S. & SANCHEZ, S. M. 2001b.
Foreign Bank Entry: Experience, Implications for Developing Countries and Agenda for Future Research. World Bank Policy Research Paper, 18, 25-29.
CLARKE, G. R. G., CULL, R. & PERIA, M. S. M. 2002. Does Foreign Bank Penetration Reduce Access to Credit in Developing Countries? Evidence from Asking
Borrowers. Development Research Group, The World Bank. CRONJE, T. 2013. Bank Lending. Australia: McGraw Hill.
CULL, R. & MARTINEZ PERIA, M. S. 2010. Foreign Bank participation In Developing Countries: What Do We Know About the Drivers and Consequences of This Phenomenon? : The World Bank.
CULL, R. & PERIA, M. S. M. 2010. Foreign Bank Participation in Developing Countries: What Do We Know About the Drivers and Consequences of this Phenomenon? : World Bank.
DE-HAAS, R., FERREIRA, D. & TACI, A. 2010. What Determines the Composition of Bank's Loan Portfolios? Evidence From Transition Countries. Journal of Banking and Finance.
DE-HAAS, R. & NAABORG, I. 2006. Foreign Banks in Transition Countries. To Whom Do
They Lend and How Are They Financed? Financial Markets, Institutions and
Instruments, 15, 159-199.
19 DEGRYSE, H., HAVRYLCHYK, O., JURZYK, E. & KOZAK, S. 2012. Foreign Bank Entry,
Credit Allocation and Lending Rates in Emerging Markets: Empirical Evidence from Poland. Journal of Banking and Finance, 36, 2949-2959.
DELL'ARICCIA, G. & MARQUEZ, R. 2004. Information and Bank Credit Allocation Journal
of Financial Economics, 72, 185-214.
DETRAGIACHE, E., TRESSEL, T. & GOOPTA, P. 2008. Foreign Bank in Poor Countries: Theory and Evidence. The Journal of Finance, LXIII, 2123-2160.
DEUTSCHE BUNDESBANK 2006. Concentration Risk in Credit Portfolios. Germany: Deutsche Bundesbank.
GIANNETTI, M. & ONGENA, S. 2012. "Lending By Example": Direct and Indirect Effects of Foreign Banks in Emerging Markets. Journal of International Economics, 86, 167-180.
GOELTOM, M. S. 2005. Indonesia's Banking Industry: Progress to Date. Country Paper
for BIS Deputy Governor Meeting. Bank for International Settlement.
HARUN, C. A. 2008. Essay on the Indonesian Banking Crisis and Restructuring. PhD,
Boston University.
HAVRYLCHYK, O. & JURZYK, E. 2006. Profitability of Foreign and Domestic Banks in
Central and Eastern Europe: Does the Mode of Entry Matter? In: ECONOMICS, L.
C. F. T. (ed.) LICOS Discussion Paper. Belgium: Katholieke Universiteit Leuven. HAYDEN, E., PORATH, D. & VON WESTERNHAGEN, N. 2006. Does Diversification
Improve the Performance of German Banks? Evidence From Individual Bank Loan Portfolios. Deustche Bundesbank
MONTGOMERY, H. 2003. The Role of Foreign Banking in Post Crisis Asia: The Importance of Method of Entry. ADB Institute Research Paper.
PANGESTU, M. 2003. The Indonesian Bank Crisis and Restructuring: Lessons and Implications for other Developing Countries. G-24 Discussion Paper Series. New York and Geneva: United Nations
UNITE, A. A. & SULLIVAN, M. J. 2003. The Effect of Foreign Entry and Ownership Structure on the Philippine Domestic Banking Market. Journal of Banking and Finance, 27, 2323-2345.
WINTON, A. 1999. Don't Put All Your Eggs in One Basket? Diversification and Specialization in Lending. University of Minnesota.
20
Appendix 1 Variables Definition and Measurement N
o
Variable Definition Measurement Remarks
1 Loan Portfolio Concentration (CONC)
The risk arising from an uneven distribution of counterparties in credit or any other business