www.elsevier.nl / locate / econbase
Tax reform and the Dutch labor market: an applied
general equilibrium approach
a b c ,*
A. Lans Bovenberg , Johan J. Graafland , Ruud A. de Mooij a
Tilburg University, P.O. Box 90153, 5000 LE Tilburg, The Netherlands b
CPB Netherlands Bureau for Economic Policy Analysis, P.O. Box 80510, NL-2508 GM,
The Hague, The Netherlands c
CPB Netherlands Bureau for Economic Policy Analysis, P.O. Box 80510, NL-2508 GM,
The Hague, The Netherlands
Abstract
This paper develops an applied general equilibrium model to explore various tax cuts aimed at combating unemployment and raising labor supply. The model calibrates modern labor-market theories on wage setting, job matching, labor supply and labor demand on Dutch data. It represents the core of a larger applied general equilibrium model for the Netherlands called MIMIC. Simulations reveal that targeting in-work benefits at the low skilled is the most effective way to cut economy-wide unemployment. However, targeting is likely to damage the quality and quantity of labor supply. Tax cuts in the higher tax brackets boost the quantity and quality of formal labor supply but are less effective in reducing unemployment and in raising unskilled employment and female labor supply.
2000 Elsevier Science S.A. All rights reserved.
Keywords: Tax policy; Structural unemployment; Labor supply; Applied general equilibrium model; The Netherlands
JEL classification: D58; E62; J41
1. Introduction
Many European countries suffer from high structural unemployment, especially
*Corresponding author. Tel.:131-73-383-364; fax:131-73-383-350.
E-mail address: [email protected] (R.A. de Mooij).
among the unskilled. Various reforms of labor-market institutions and the tax and social insurance systems have been put forward to fight this unemployment. These proposals include, in addition to reducing social benefits and minimum wages, cutting social insurance premiums and payroll taxes on low-skilled work, introducing wage subsidies for the long-term unemployed, and providing in-work benefits (see Snower and De la Dehesa, 1996; Haveman, 1996; Sørensen, 1997). The latter proposals aim to enhance low-skilled employment without seriously damaging the incomes of transfer recipients.
At the same time, the aging of the population implies that the increasing burden of social insurance benefits paid to the elderly must be financed by a relatively small number of workers. The rising ratio between the number of inactive people collecting social insurance benefits and the labor force is a growing cause for concern. To mitigate this trend, many EU countries aim at stimulating labor supply. Indeed, the low labor-force participation of women and the elderly in many EU countries leaves substantial scope for raising labor supply. Proposals to raise labor supply include cutting marginal tax rates, reducing tax benefits to households with a non-participating partner, and decreasing early retirement benefits.
This paper develops an applied general equilibrium model to explore various tax policies aimed at combating unemployment and raising labor supply. The model focuses on adequately describing wage formation, labor supply and demand, and the process of job matching between vacancies and the unemployed looking for a job. By including elements of wage bargaining and costly job matching, the model describes equilibrium unemployment in terms of the structure of the tax system and the features of social insurance. The key parameters in wage formation are estimated from Dutch time series data.
The model developed in this paper represents the core of a larger applied general equilibrium model for the Dutch economy, called MIMIC. The latter model is designed so as to help Dutch policymakers in investigating the structural labor-market implications of changes in the systems of taxation and social insurance. Compared to the small model, MIMIC contains more heterogeneity, more economic mechanisms and an elaborate description of the actual tax and social insurance systems in the Netherlands. This institutional detail makes MIMIC especially relevant for policy making because actual policy proposals typically involve particular details of the tax and social insurance systems.
sector in which those without a job in the formal sector may work. As its third contribution, the paper uncovers a number of major trade-offs that often escape policy discussions. These trade-offs involve the objectives of cutting unemploy-ment in general and low-skilled unemployunemploy-ment in particular, stimulating labor supply in general and the labor-force participation of women in particular, enhancing the accumulation of human capital, and establishing an equitable income distribution. To illustrate, tax reforms that are effective in fighting unemployment are typically not the most helpful in boosting labor supply. As its final contribution, this paper illustrates the value-added of employing a larger model for policy analysis by comparing the results from the small aggregated model with those from MIMIC. In particular, MIMIC is able to analyze a broader scope of policy instruments, yields disaggregated information relevant for policy makers – including information on the equity / efficiency trade-off – and contains more economic mechanisms. Accordingly, compared to the small model, MIMIC reveals a number of additional trade-offs.
The rest of this paper is structured as follows. Section 2 presents the aggregated model that is used in Section 3 to explore a number of tax cuts aimed at reducing unemployment and raising labor supply. Section 4 discusses briefly how MIMIC departs from the aggregated small model and investigates the structural impact of tax policies in MIMIC. Section 5 concludes.
2. MINI-MIMIC: an AGE model for an open economy
This section develops a small general equilibrium model with similar features as the MIMIC model. As in MIMIC, the key elements of this so-called MINI-MIMIC model are labor supply and demand, wage formation and job matching.
2.1. Firm behavior
The economy consists of two types of domestic firms. For each type i5u,s, a
fixed number of N symmetric firms produce commodities according to a lineari j j
production function Yi5h L , where superscript j denotes firm ji i 51 . . . N . Thei
two types of firms differ with respect to the labor skill they adopt in the production
j j
process, namely unskilled labor (L ) or skilled labor (L ). The fixed parameter hu s i
measures the productivity of labor skill i.
Firms set prices on markets that are characterized by monopolistic competition.
j
Profit maximization implies that the output price of firm j of type i, P , is set as ai
mark-up over marginal costs:
W
1 i j
]] ]
where W represents the wage costs of (un)skilled labor (i.e. the producer wage),i j j j j j
and ´i;2(≠P /i ≠Y )(Y /P )i i i .0 denotes the negative of the inverse price
j j
elasticity of demand for Y . Profits (i Pi), which are due to the mark-up, accrue to the owners of the firm, who are residents of the home economy:
j j j j
P 5i P Yi i2W Li i i5u, 2 j51 . . . Ni (2) Commodities produced by labor skill i5u,s are aggregated into a composite
commodity Y , with an ideal price index, P :i i
wherehdenotes the substitution elasticity between commodities produced by firms
j
of type i5u,s. From (3), we derive that the elasticity´i in the mark-up factor in (1) is independent of firm j and type i and inversely related to the substitution elasticity between the different commodities, i.e. ´ 51 /h. Hence, the mark-up in (1) is small if commodities are close substitutes for each other.
The optimal allocation of Y over the two composite commodities – demanded by domestic households, foreign households and the government – is derived from maximizing a homothetic CES sub-utility function:
1 /f (f 21 ) /f 1 /f (f 21 ) /f f/ (f 21 )
Y5[b Ys 1(1 2b) Yu ] (5)
where f stands for the elasticity of substitution between the two composites commodities and b represents a share parameter. From the first-order condition, we arrive at the following expression for the optimal allocation between the two composite commodities:
2f
Ys Ps
]5
S D
] (6)Yu Pu
Expression (6) can be interpreted as an implicit demand function for skilled and unskilled labor; the demand for Y and Y implicitly determines the demand foru s
skilled and unskilled labor as a function of the price indices P and P that areu s
determined by the respective wage rates for skilled and unskilled labor (see (1) and (4)). The parameter f can thus be interpreted as the substitution elasticity between skilled and unskilled labor.
The ideal price index of the composite domestically produced good is a CES aggregate of the prices of the two composite commodities:
12f 12f 1 / ( 12f)
Aggregate profits are determined by the sum of the profits of all firms:
Ni j
P 5
O O
Pi (8)i j
2.2. Household behavior
2.2.1. Labor supply
The economy is populated by three types of households: skilled households, unskilled households and capitalists. The latter households do not supply labor but receive profit income from their ownership of the domestic firms. The other two household types supply labor. The number of hours worked per household is the only endogenous component of labor supply because participation decisions are exogenous. In particular, M households of each skill type maximize utility (U )i i
subject to a budget constraint and a time constraint, where subscript i5u,s
denotes the skill type of the household. Utility features a private consumption bundle (C ), leisure (V ) and public consumption (G) as its arguments. This latteri i
variable enters utility in an additively separable way, i.e. Ui5u(C ,V )i i 1h(G).
Hence, changes in public consumption do not directly affect private household behavior. The CES function u(.) is homothetic in its two arguments. If a household is not rationed on the labor market, its budget for consumption commodities is determined by labor income, i.e. (12TA )(1i 2D )W Si i i5P C , where (1c i 2D )Wi i
is the before-tax wage, TA denotes the average tax rate on gross labor incomei
(including pay-roll taxes), S stands for labor supply, and P represents the ideali c
price index of the consumption bundle. The before-tax wage rate differs from the producer wage because of hiring costs (D ) faced by employers (see Subsectioni
2.4). In most matching models, individual worker / firm bargaining determines the incidence of these hiring costs. In our model, in contrast, hiring costs affect collective bargaining between employers organizations and unions (see Subsection 2.3).
Labor supply is given by Si512V because the time endowment is normalizedi
to unity. Unrestricted optimization yields the following expression for total labor supply of each skill type:
2s
(12TM )(1i 2D )Wi i (12TA )(1i 2D )Wi i
]]]]]] ]]]]]]
Si5Mi
Y
F
11 DiS
D S
DG
Pc Pc
i5u, s (9)
1
stands for the marginal tax rate on labor income. Expression (9) reveals that a higher average tax rate (TA ) stimulates labor supply through the income effect byi
depressing the real consumer wage (12TA )(1i 2D )W /P . A higher marginal taxi i C
rate harms labor supply through the substitution effect. A higher real consumer wage (W /P ) or lower hiring costs (D ) raise labor supply if the substitution effecti c i
dominates the income effect, i.e. if s .1. Labor supply thus depends only on wages, taxes and hiring costs; unemployment does not directly affect the incentives to supply labor, e.g., through the discouraged worker effect. Indeed, labor supply is determined by a conventional labor supply model with exogenous participation.
2.2.2. Consumption
Involuntary unemployment implies that some skilled and unskilled households are rationed in their labor supply. The rationed households do not receive wage income but collect unemployment benefits. Aggregate household consumption is restricted by the sum of aggregate after-tax labor income (including the income of those who are employed in the search activities of the employers, see Subsection 2.4), income from unemployment benefits, and aggregate profit income (P):
P Cc 5
O
[(12TA ) W Li i i1B U S ]i i i 1P (10)i
where L denotes economy-wide demand for labor type i (excluding labor involvedi
in search activities), B represents the (net) unemployment benefit for labor type i,i
and Ui;12L /S stands for the unemployment rate of type i. Unemployment isi i
thus measured in terms of the difference between labor supply and labor demand (in terms of hours). Indeed, some workers are fully employed; these workers are able to sell their entire notional labor supply given by expression (9). The other workers are involuntary unemployed; they are not able to sell any of their labor. Households spend their entire income on a consumption bundle (C ) consisting of two aggregate goods with an ideal price index P (see Fig. 1). One aggregatec
good is a CES aggregate of domestic commodities produced by skilled workers and domestic commodities produced by unskilled workers (see Subsection 2.1). The other aggregate good is a composite of imported commodities with an ideal price index P . Domestic and foreign commodities are imperfect substitutes. Them
optimal choice between these two aggregate commodities is derived from optimization of a homothetic CES subutility function, C5c(C , C ), where Cm y m
denotes aggregate private demand for foreign goods and C stands for aggregatey
private consumption of domestically produced goods. The optimal allocation of consumption over the two goods is given by:
1
The average tax may depend on the producer wage (see Subsection 2.5). Hence, TM may differi
Fig. 1. The utility tree in MINI-MIMIC.
2k
Cm Pm
]5
S D
] (11)Cy Py
where k denotes the substitution elasticity between the two commodities and Py
stands for the ideal price index of domestic production, defined in (7).
2.3. Wage formation
a 12a
MaxV 5 L Gi i i 0,a ,1 i5u, s (12)
Wi
where L 5i P Yi i2W L denotes the utility of the employers organization andi i
1 / 2 ˆ 1 / 2
G 5i Li [W (1i 2TA )(1i 2D )i 2W ]i stands for the utility of the union. The parameter a represents the relative bargaining power of the employers organiza-tion. The utility of the union depends on the level of employment and the surplus from working, which is the real consumer wage minus the reservation consumer
ˆ
wage, denoted by W . The union thus does not take into account the workers’i
preferences for leisure.
After substituting the expressions for Li andGi into Eq. (12) and deriving the first-order condition for the Nash bargaining solution, we arrive at the following wage equation: that the wage strikes a balance between the threat points of both bargaining parties. If the employers organization dominates bargaining (a 51 so that x 52 0), the union is driven back to its threat point and the after-tax wage equals the reservation wage. The wage increases if the union exerts more bargaining power, i.e. if a becomes smaller. Since a wage contract will be concluded only if the maximum after-tax wage offer ((12TA )(1i 2D )P h ) exceeds the minimumi i i
ˆ
wage claim (W ), expression (13) implies that a higher marginal tax ratei
unambiguously moderates wages. At a given average tax rate, a rise in the marginal tax rate implies that the government absorbs a larger share of a wage increase. Hence, increasing wages becomes less attractive for the bargaining parties (see also Hersoug et al., 1986).
Instead of looking for another job on the official labor market, the employee may seek work in the informal sector. Accordingly, the reservation consumer wage
ˆ
W amounts to a weighted average of the opportunity consumer wage in the officiali
o b
The opportunity consumer wage in the official labor market depends not only on
]
the expected consumer wage in other jobs, (12TA )(1i 2D )W , but also on thei i
unemployment benefit because a laid-off employee generally spends some time in unemployment before finding another job:
o
ˆ ¯
where the proportion of time spent unemployed before finding an alternative job is assumed to equal the unemployment rate.
The informal labor market, in which no taxes are levied, consists of home production and the black labor market. Informal labor productivity increases with labor productivity in the formal sector (h ), because technological progress in thei
formal sector enhances labor productivity also in the informal sector. Because output of the informal sector is a perfect substitute for commodities consumed from the formal economy, the informal output price is directly related to the
2
formal consumer price (P ):c b
ˆ
Wi5gh Pi c i5u, s (16)
By substituting (15) and (16) into (14) and using the equilibrium condition
]
Wi5W , we arrive at the following wage equation:i
Pc
the replacement rate, defined as the net unemployment benefit as a ratio of the consumer wage. Expression (17) implies that, at a given coefficient of progression
(12TM ) /(1i 2TA ), a higher tax rate unambiguously increases the real produceri
wage so that taxes are not fully absorbed by workers in terms of lower consumer wages. The intuition behind this real wage resistance is that taxes raise the relative attractiveness of working in the untaxed informal sector, thereby strengthening the
3
bargaining position of the union in the formal sector.
Another implication of Eq. (17) is that the wage effects of the replacement rate and unemployment rate are related. If unemployment is low, spells of unemploy-ment are only short. Hence, the unemployunemploy-ment benefit level exerts only a small impact on the alternative consumer wage in the official sector. At the same time, the influence of the unemployment rate on wages diminishes with the level of the replacement rate, becoming zero if the replacement rate equals one.
Graafland and Huizinga (1996) estimated Eq. (17) in non-linear form on Dutch time series data. They found that, on average for the sample period, the positive elasticity of the average tax is six times (0.6) as large in absolute value than the
2
The model does not include value-added taxes, which would exert the same effect on wages as proportional income taxes do (see Graafland and Huizinga, 1996).
3
If the informal sector does not impact the reservation consumer wage (b 5w 1 and thusu 50), taxes affect the wage outcome only through the coefficient of progression (12TM ) /(1i 2TA ). Accordingly,i
negative elasticity of the marginal tax rate (20.1). The elasticity of hiring costs equals the sum of the elasticities of the marginal and average tax rates, i.e. 0.5. Hence, at constant unemployment and replacement rates, the incidence of both a higher tax wedge (by simultaneously increasing average and marginal tax rates) and higher hiring costs is split equally between employers and employees in terms of, respectively, higher producer wages and lower consumer wages. The replace-ment rate and the unemployreplace-ment rate feature elasticities of 0.3 and 22, respectively (on average over the sample period).
The empirical finding that proportional labor taxes are split between workers and employers contrasts with the well-know result of Layard et al. (1991) that these taxes are fully borne by workers in the long run. As noted above, the empirical evidence on real wage resistance for the Dutch economy is consistent with a theoretical model in which those without a job in the formal sector can take up employment in the untaxed informal sector. In that case, the fall-back position of the unions in collective bargaining depends in part on untaxed informal incomes so that higher taxes exert only a relatively small negative impact on the negotiation position of the unions. The presence of real wage resistance makes the tax system an important determinant of the natural rate of unemployment.
2.4. Job matching
In each period, a fixed proportion of the employed, v, involuntarily quit their job. These job quits give rise to vacancies (Vl ) which, in a steady-statei
equilibrium, are equal to:
vLi ]
Vli5 z i5u, s (18)
i
where zi;Ml /Vl denotes the rate at which vacancies are filled and Ml stands fori i i
the number of job matches of skill type i.
To fill vacancies, employers have to hire new employees through a costly search process of matching vacancies with unemployed workers. Hiring costs associated with this matching process (D ) are related to the ease with which vacancies arei
filled (z ) and the labor involved in search activities:i
ni ]
Di5z i5u, s (19)
i
whereni measures the hiring costs for each new employee.
The matching process between unemployed and vacancies is described by the following Cobb–Douglas function:
1 / 2 1 / 2
matches, relative to the number of vacancies. Accordingly, hiring costs in (19) increase, thereby raising the producer wage in (17) and reducing consumer wages.
2.5. Public institutions
Government behavior is largely exogenous. In particular, the government collects public revenues from taxing labor incomes. These revenues are used to finance expenditures on (net) unemployment benefits and public consumption. Public consumption, G, features the same composition as private consumption and thus exhibits the same ideal price index, P . The government budget is balanced:c
P Gc 5
O
(TA W Li i i2B U S )i i i (21)i
The marginal tax rate and the unemployment benefit are uniform for skilled and
4
unskilled labor, i.e. TMu5TMs5TM and Bu5Bs5B. The average tax rate
differs from the marginal tax because the government allows for a tax credit that may differ among household types (F ). The average tax rate for each type of labori
is described by:
Fi
]]
TAi5TM2W L i5u, s (22)
i i
The unemployment benefit (B ) is indexed to average wages in the following way:
B5buR*W(12TA)(12D )1(12bu)QW(12D ) (23)
where
W Lu u1W Ls s W L TAu u u1W L TAs s s
]]]] ]]]]]]
W5 TA5
Lu1Ls W Lu u1W Ls s
W L Du u u1W L Ds s s
]]]]]
D5 (24)
W Lu u1W Ls s
The variables W(12TA)(12D ) and W denote the average consumer wage and
average producer wage, respectively. Expression (23) allows for two alternative indexation rules. If b 5u 1, net unemployment benefits are indexed to real consumer wages. In that case, the parameter R* can be interpreted as the fixed average replacement rate. Hence, tax cuts do not affect the average replacement rate. If b 5u 0, unemployment benefits are indexed to before-tax wages. In that case, cuts in the average tax burden for workers, TA, reduce the average replacement rate, R;B /W(12TA)(12D )5Q /(12TA)(12D ).
4
2.6. The foreign sector
Analogous to consumption of domestic households, the allocation of foreign consumption over domestically produced and foreign produced goods depends on the terms of trade, i.e.:
2j
Py
]
Xy5
S D
P (25)m
where X represents demand for domestically produced commodities by foreigny
countries and j denotes the export elasticity. With less than infinite price elasticities for export and import demand, domestic policies may change the terms of trade.
The market for domestically produced goods is in equilibrium. Hence, aggregate supply of domestic goods (Y ) equals aggregate demand for domestically produced goods by domestic households (C ), the government (G ) and foreigners (X ), i.e.:y y y
Y5Cy1Gy1Xy (26)
Balance of payments equilibrium is found by combining the aggregate profit Eq. (8), the economy-wide household budget constraint (10), the government budget constraint (21) and goods-market equilibrium (26):
P (Cm m1G )m 5P Xy y (27)
where Gm represents the demand by the government for foreign goods.
3. Tax policies in MINI-MIMIC
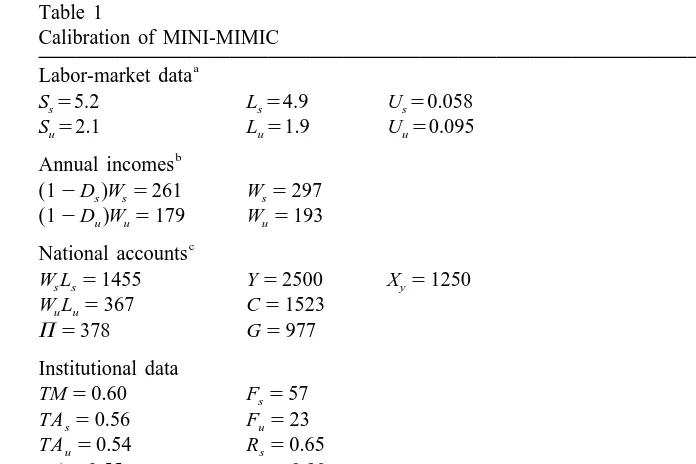
3.1. Calibration
Table 1
workers is substantially lower, namely 0.65. The marginal tax rate in the initial equilibrium is 0.6 while the average tax rate is somewhat lower, namely 0.56 for skilled workers and 0.54 for unskilled workers. Hence, the initial tax system is mildly progressive.
The elasticities of the wage equation are derived from the estimates of Graafland and Huizinga (1996) discussed in Subsection 2.3. The substitution elasticity between skilled and unskilled labor is derived from Draper and Manders (1996) and set at 1.5. The export elasticity of 22 is consistent with estimates by Draper (1996). The uncompensated wage elasticity and the income elasticity of labor supply are based on micro-econometric research on labor-supply behavior of Dutch citizens and set at 0.15 and 20.05, respectively (Theeuwes and Woittiez, 1992; Van Soest, 1995).
3.2. Simulation results
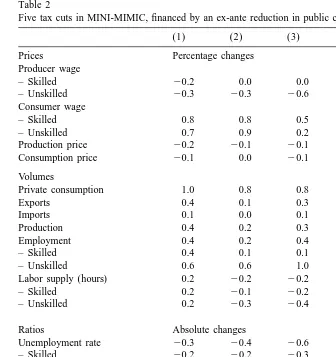
Table 2
Five tax cuts in MINI-MIMIC, financed by an ex-ante reduction in public consumption of 0.5% GDP
(1) (2) (3) (4) (5)
Private consumption 1.0 0.8 0.8 0.8 21.8
Exports 0.4 0.1 0.3 0.5 22.5
Imports 0.1 0.0 0.1 0.1 20.6
Production 0.4 0.2 0.3 0.5 22.7
Employment 0.4 0.2 0.4 0.7 22.6
– Skilled 0.4 0.1 0.1 0.1 23.5
Weighted average tax rate on hourly wages. b
Closure rule, in % of GDP.
(1) Lower marginal tax rate (benefits indexed to consumer wages). (2) Higher tax credit for all households (benefits indexed to consumer wages). (3) Higher tax credit for all households (benefits indexed to producer wages). (4) Higher tax credit for unskilled workers (benefits indexed to producer wages). (5) Higher tax credit for all workers, higher marginal tax rate, skilled workers break even ex ante (benefits indexed to producer wages).
changes in public consumption. Hence, the ex-post effect on public consumption can be interpreted as the long-run budgetary costs of the tax reduction.
average replacement rate is constant. These experiments involve a reduction in the marginal tax rate for all workers and an increase in the tax credit for skilled and unskilled workers with the same absolute amount. In the other three experiments, presented in the last three columns of Table 2, unemployment benefits are indexed to gross wages (i.e. b 5u 0). In that case, tax cuts reduce the replacement rate. In the third column, we explore the effects of an increase in a uniform tax credit for all workers. The fourth column shows the effects of an increase in the tax credit only for unskilled workers. This latter experiment can be interpreted as the introduction of an Earned Income Tax Credit (EITC) for unskilled workers. In contrast to the EITC in the US, however, the EITC targeted at unskilled workers explored in the fourth column does not raise the marginal tax burden on hours worked in the phase-out range because it is based on hourly wages rather than annual incomes. To explore the effects of an EITC that is phased out on the basis of higher annual incomes, the fifth column presents the effects of an alternative tax reduction that is targeted at the unskilled. In particular, this experiment increases the tax credit for all workers. At the same time, it raises the marginal tax rate in such a way that skilled workers break even ex ante. Whereas the average tax burden for skilled workers thus remains unchanged, the average tax burden on unskilled workers declines since these households benefit relatively more from the tax credit and suffer less from the higher marginal tax rate than skilled workers do.
3.2.1. Labor supply
Only the cut in marginal tax rates boosts aggregate labor supply through the substitution effect (see the first column of Table 2). The three tax credits in the second, third and fourth columns of Table 2 do not affect marginal tax rates on hours worked. Hence, the substitution effect is absent and a positive income effect reduces labor supply. Targeting the tax cuts to the unskilled implies a relatively large positive income effect for this group. Accordingly, unskilled labor supply declines substantially in the targeting case (see the fourth column of Table 2). If the tax credit is targeted on the basis of annual incomes, it sharply raises the marginal tax rate on hours worked. In that case, therefore, labor supply drops substantially on account of both an income effect and an adverse substitution effect (see the fifth column of Table 2).
3.2.2. Unemployment
rather than consumer wages. In that case, a lower replacement rate strengthens the wage moderating effect of a lower average tax burden.
The drop in the aggregate unemployment rate is most substantial if tax cuts are targeted at the unskilled (see the fourth and fifth columns of Table 2). The main reason is the relatively low wage rate for unskilled labor. This implies that cutting the average tax rate for unskilled labor is relatively cheap in terms of budgetary costs. Another reason is that targeted tax reductions reduce the replacement rate for the unskilled (see below). The wage equation in (17) implies that a lower replacement rate is particularly effective at high unemployment rates. Since the unemployment rate for the unskilled exceeds that for skilled workers, tax reductions targeted at the unskilled are relatively effective in cutting unemploy-ment rates. In the fifth column of Table 2, the effect on unemployunemploy-ment on account of the lower average tax burden and the reduction in the replacement rate is reinforced by the wage moderating effect of a higher marginal tax rate. As discussed in Subsection 2.3, a higher marginal tax rate discourages unions from bargaining for high wages, thereby reducing unemployment.
Unskilled unemployment declines substantially more than skilled unemployment if only average tax rates are cut while marginal tax rates are either kept constant or increased. The reason is three-fold. First, a larger uniform tax credit implies a larger drop in the average tax rate of the unskilled than in that of the skilled because the tax credit represents a relatively large share of the relatively low incomes of the unskilled. The larger drop in the average tax rate implies a stronger moderating impact on the wage costs of unskilled labor (see Eq. (17)). Second, the unskilled unemployed do not fully share in this larger drop in the average tax rate of the unskilled because their unemployment benefits are linked to average wages. Hence, even if benefits are linked to (average) consumer wages does the
5
replacement rate for unskilled labor decline. If benefits are linked to producer wages, the replacement rate for unskilled labor drops more substantially than the replacement rate for skilled labor because unskilled workers benefit from a larger cut in average tax rates. These effects on the relative replacement rates are much stronger if the cut in the tax credit accrues only to unskilled labor (see the fourth and fifth columns in Table 2). The final reason for the relatively large drop in unskilled unemployment is the high initial unemployment rate of the unskilled. This makes the equilibrium unemployment rate of the unskilled especially sensitive to reductions in the replacement rate.
3.2.3. Employment
The cut in marginal tax rates boosts employment through both the channel of higher labor supply and the channel of lower unemployment. The other tax cuts reduce both labor supply and unemployment. If the marginal tax rate is kept
5
constant, the decline in unemployment dominates the fall in labor supply. Hence, employment expands in these cases. However, if the marginal tax rate is increased, the adverse effect on labor supply exceeds the decline in unemployment so that employment falls.
The expansion in aggregate employment is strongest if marginal tax rates are reduced (the first column of Table 2) or if tax cuts are targeted at the unskilled without raising the marginal tax rate (the third and fourth columns of Table 2). With lower marginal tax rates, higher labor supply accounts for a substantial part of the expansion in employment. With targeting the unskilled on the basis of hourly wages, lower unemployment explains the substantial increase in employ-ment. This suggests a trade-off between raising labor supply and cutting unemployment. Cutting marginal tax rates stimulates labor supply but targeting tax cuts at the unskilled reduces unemployment most. This trade-off is illustrated also in fifth column of Table 2 where the combination of a lower average tax rate and a higher marginal tax rate reduces both unemployment and labor supply.
Unskilled employment rises most substantially if a tax credit is targeted at the unskilled on the basis of hourly wages. This is despite a rather sharp decline in unskilled labor supply. Hence, also here, a trade-off emerges between stimulating labor supply and fighting unemployment. Nevertheless, targeting the unskilled on the basis of hourly wages raises unskilled employment as the positive employment effects on account of lower unemployment dominate the negative employment effects associated with lower labor supply. If the unskilled are targeted on the basis of annual incomes, in contrast, the adverse effect on labor supply dominates the decline in unemployment. Hence, unskilled employment falls.
4. The MIMIC model
4.1. Structure of MIMIC
MIMIC departs from MINI-MIMIC by incorporating more institutional detail, economic mechanisms, disaggregation, and heterogeneity. These extensions make MIMIC a more appropriate instrument for analyzing actual policy proposals in the Netherlands. Furthermore, more disaggregation and heterogeneity allow for a better empirical foundation of several parts of the model, such as labor supply, labor demand and production.
To model the effects of high marginal tax rates on the economy, MIMIC endogenizes on-the-job training and models the interaction between the formal and the informal economy. The latter consists of the black economy and household production. On the labor market, contractual wages are determined by both skill-specific and macro-economic factors. Indeed, the wage Eq. (17) is specified both on the macro-economic level and for three skill types, namely, unskilled, low skilled and high skilled labor. MIMIC introduces heterogeneity in the matching process which allows the modeling of the adverse impact of high minimum wage costs and high reservation wages on the efficiency of matching process. In particular, low-productivity matches may fail because they do not meet the minimum productivity standard of the employer or the reservation wage of the unemployed.
A final distinctive feature of MIMIC is that it contains several public institutions, including the Dutch personal income tax system in 1998. For a more elaborate description of MIMIC, see Gelauff and Graafland (1994) and Bovenberg et al. (1998).
4.2. Simulations with MIMIC
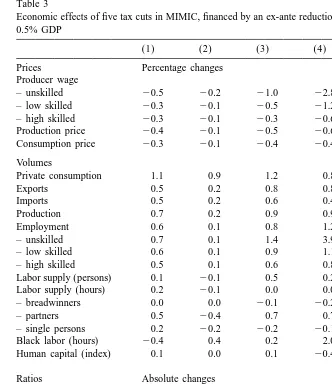
To illustrate the value-added of using the MIMIC model in analyzing tax policies, we employ MIMIC to explore similar experiments as in Subsection 3.2. The simulation results are presented in Table 3. In each experiment, the ex-ante reduction in tax revenues is 0.5% of GDP, financed by an equivalent reduction in public consumption. Adjustments in public consumption balance the government budget ex post.
The simulations with MIMIC reveal the same trade-off between the objectives of cutting unemployment and raising labor supply. Indeed, reducing marginal tax rates is the most effective way to raise labor supply (in terms of hours), while increasing income differentials between low-skilled workers and the low-skilled unemployed is most effective in fighting unemployment.
In addition to this, MIMIC finds that lower marginal tax rates boost not only the quantity but also the quality of labor supply. In particular, by widening the income differentials between low and high labor incomes, lower marginal tax rates stimulate the incentives for on-the-job training and thus raise labor productivity and the accumulation of human capital. Furthermore, MIMIC reveals that a cut in marginal tax rates stimulates especially the labor supply of partners who feature a relatively high elasticity of labor supply. Indeed, the labor supply elasticities in MIMIC are based on empirical estimates for the Netherlands which suggest that married women typically feature a much larger elasticity of labor supply than men do. MINI-MIMIC does not use this disaggregated information on labor supply behavior.
Table 3
Economic effects of five tax cuts in MIMIC, financed by an ex-ante reduction in public consumption of 0.5% GDP
Private consumption 1.1 0.9 1.2 0.8 0.7
Exports 0.5 0.2 0.8 0.8 0.4
Imports 0.5 0.2 0.6 0.4 0.2
Production 0.7 0.2 0.9 0.9 0.4
Employment 0.6 0.1 0.8 1.2 0.7
– unskilled 0.7 0.1 1.4 3.9 2.4
– low skilled 0.6 0.1 0.9 1.1 1.0
– high skilled 0.5 0.1 0.6 0.8 0.3
Labor supply (persons) 0.1 20.1 0.5 0.2 1.6
Labor supply (hours) 0.2 20.1 0.0 0.0 20.3
Weighted average of micro tax burdens of the employed on hourly wages. b
Closure, in % of GDP.
average of the replacement rates of different household types. The reason is that MIMIC incorporates micro data on income distributions which reveal that the unemployed benefit relatively more from a tax credit than those in work because the unemployed collect relatively low incomes. The associated higher replacement rate implies that a uniform tax credit exerts a less favorable effect on unemploy-ment in MIMIC than in MINI-MIMIC.
As in MINI-MIMIC, cutting unemployment in MIMIC primarily requires widening the gap between labor incomes and transfer incomes in unemployment. This may be accomplished through in-work tax benefits (see the last three columns of Table 3). Indeed, MIMIC reveals that these tax benefits can reduce unemploy-ment significantly by moderating wage costs and by facilitating job matching. In-work benefits can become more effective in reducing unemployment if they are targeted at low skilled workers, who suffer from the highest unemployment rates. The costs and benefits of targeting are illustrated with the effects of an EITC that amounts to 4% of annual labor income in a phase-in range up to the statutory minimum wage and that is phased out between 120% and 180% of the minimum
6
wage (see the fifth column of Table 3). This policy is effective in cutting unemployment, especially among the low skilled, and in raising female labor-force participation. Breadwinners and singles, however, reduce their labor supply, in part due to the higher marginal tax rate in the phase-out range. On balance, the reduction in labor supply dominates the positive effect on the participation rate of
7
partners. Hence, aggregate labor supply (measured in hours) drops. Targeting the EITC thus reveals a trade-off between, on the one hand, raising labor supply and, on the other hand, fighting unemployment.
This trade-off between cutting unemployment and raising labor supply (in hours) can be mitigated by linking the EITC to hourly wages rather than annual incomes. Indeed, the Dutch government has proposed such an EITC; workers who earn the hourly minimum wage and hold a full-time job are eligible for the full EITC but the credit is reduced proportionally for workers who work less than a full-time job. A comparison between an EITC that depends on annual incomes and an EITC that depends on hourly wages reveals a trade-off between increasing the participation rate of partners and reducing the unemployment rate for the low
6
This experiment in MIMIC is not directly comparable with the experiment with MINI-MIMIC reported in the fifth column of Table 2. In particular, MIMIC explores an EITC that is phased out at a rate of around 6% over an income range between 120% and 180% of the minimum wage. Hence, workers who earn an income outside this phase-out range do not face a higher marginal tax rate. The experiment in MINI-MIMIC, in contrast, involves an increase in the marginal tax rate of approximately 6% for all workers, a lower average tax rate for the unskilled and a constant average tax rate for skilled workers.
7
skilled (compare the fourth and fifth column of Table 3). In particular, an EITC that depends on hourly wages is more effective in cutting low-skilled unemploy-ment. This is because, with the same budget for tax relief, more tax benefits can be provided to full-time workers with low hourly wages. At the same time, however, small part-time jobs with hourly wages above the minimum wage benefit less from tax relief. This makes the instrument less effective in raising the labor-force participation of partners. Another trade-off involves the quality versus the quantity of labor supply. Compared to an EITC that depends on annual incomes, an EITC that depends on hourly wages enhances the quantity of labor supply (in hours) because additional hours worked do not reduce the credit. However, it more seriously harms the quality of labor (in terms of human capital). This is because the marginal tax rate on a higher hourly wage increases more substantially, thereby damaging the incentives for training. Another drawback of this variant of the EITC is that it relies on additional information (namely the number of hours worked) that is vulnerable to fraud. Indeed, the black economy expands substantially.
5. Conclusions
This paper has stressed that policymakers face various trade-offs in designing tax reforms aimed at enhancing the functioning of labor markets. Indeed, different objectives imply different priorities for how tax cuts should be structured. The model simulations suggest that in-work benefits are an effective instrument to fight economy-wide unemployment. These benefits reduce unemployment even more if they are targeted at unskilled workers, in part because the gap between labor income and transfer income is smallest for these workers. Hence, widening this small gap produces the largest pay-off in terms of reducing unemployment. However, by decreasing the gap between low and high labor incomes through a more progressive tax system for workers, a targeted EITC reduces the hours of labor supplied. This trade-off between cutting unemployment and raising labor supply (in hours) can be mitigated by linking the EITC to hourly wages rather than annual incomes. Doing so, however, raises the marginal tax burden on higher hourly wages, thereby discouraging the accumulation of human capital and stimulating the black economy. Cutting marginal tax rates raises the quantity and quality of labor supply but is less effective in reducing unemployment and raising low-skilled employment.
References
Browning, E.K., 1995. Effects of the earned income tax credit on income and welfare. National Tax Journal 48, 23–43.
Dickert, S., Houser, S., Scholz, J.K., 1995. The earned income tax credit and transfer programs: A study of labor market and program participation. In: Poterba, J.M. (Ed.). Tax Policy and the Economy, Vol. 9. MIT Press, pp. 1–50.
Draper, D.A.G., 1996. The export market (in Dutch), CPB Research Memorandum No. 130. The Hague.
Draper, D.A.G., Manders, A.J.G., 1996. Structural changes in the demand for labor. CPB Research Memorandum No. 128, The Hague.
Eissa, N., Liebman, J.B., 1996. Labor supply response to the earned income tax credit. Quarterly Journal of Economics 111, 605–637.
Gelauff, G.M.M., Graafland, J.J., 1994. Modelling Welfare State Reform. North Holland, Amsterdam. Graafland, J.J., Huizinga, F.H., 1996. Taxes and benefits in a non-linear wage equation. CPB Research
Memorandum No. 125, The Hague.
Haveman, R., 1996. Reducing poverty while increasing employment: a primer on alternative strategies and a blueprint. OECD Economic Studies No. 26, Paris.
Hersoug, T., Kjaer, K.N., Rødseth, A., 1986. Wages, taxes and the utility-maximizing trade union: a confrontation on Norwegian data. Oxford Economic Papers 38, 37–51.
Layard, R., Nickell, S., Jackman, R., 1991. Unemployment. Oxford University Press, Oxford. Scholz, J.K., 1996. In-work benefits in the United States: the earned income tax credit. Economic
Journal 106, 156–169.
Snower, D.J., de la Dehesa, G., 1996. Unemployment Policy: Government Options for the Labour Market. CEPR and Cambridge University Press, Cambridge.
Van Soest, A., 1995. Structural models of family labor supply, a discrete choice approach. Journal of Human Resources 30, 63–88.
Sørensen, P.B., 1997. Public finance solutions to the European unemployment problem. Economic Policy, 221–251.