HIGH CARBON STOCK
FOREST STUDY REPORT
Foreword 4
Executive Summary 5
1 Introduction
1.1 GAR policy commitments 9
1.2 Working with partners and stakeholders 10
1.3 Development of the HCS forest study approach 10
1.4 Socialisation 11
2 The High Carbon Stock Forest Methodology
2.1 The HCS forest study approach 12
2.2 Location of the study sites/concessions 14
2.3 Methodology 16
2.3.1 Stratification 17
2.3.2 Sampling 18
2.3.3 Design of sample plot 18
2.3.4 Plot details 19
3 Data Analysis
3.1 Allometric 20
3.2 Data checking 21
3.3 Data extrapolation to calculate and 21
estimate carbon stock
4 Results and Discussion
4.1 Results 22
4.2 Discussion 25
4.2.1 Limitations of the study 27
4.3 Conservation of HCS areas 28
5 Conclusion and Recommendations
5.1 Recommendations for future research 30
Glossary 32
Acknowledgments 33
References 34
Appendix 1 36
Appendix 2 38
Appendix 3 39
Appendix 4 40
Foreword
Daud Dharsono President Director
PT SMART Tbk
Golden Agri-Resources (GAR), together with subsidiary PT SMART Tbk (SMART), global non-profit The Forest
Trust (TFT) and Greenpeace (together, the “Team”), have reached a significant milestone with the publication
of this report detailing the methodology and findings from the High Carbon Stock (HCS) forest study, conducted
under GAR’s Forest Conservation Policy (FCP). The fieldwork was carried out between the first quarter and
last quarter of 2011. Following the launch of the FCP in early 2011, the Team proceeded to test how this policy
and the provisional HCS forest definition would be implemented on the ground. GAR’s intention is to take a
leadership role in finding a suitable definition for HCS and to act on its commitment to ensure no deforestation
footprint in its palm oil operations. Ultimately, the conserved HCS forest area can revert to its natural ecological
function as a forest.
The Team is taking a consultative approach and would welcome views from all stakeholders. The company
recognises that in order to be successful, it cannot do this alone. The HCS forest conservation should be
supported by all palm oil industry stakeholders. As such, this report is the starting point for multi-stakeholders to
discuss, debate and improve upon the Team’s findings. GAR hopes that people will come together to work
hand-in-hand because we share a common ground in wanting to find solutions for sustainable palm oil production.
The Team would like to take this opportunity to thank the various parties who have been working alongside us
for the HCS fieldwork and this report. They include local communities, NGOs, and key government institutions
in Indonesia.
The Team hopes that you will review the report carefully and looks forward to working with you. GAR believes
that this is a strong platform for multi-stakeholders to find solutions to conserve the forests, create much
needed employment and ensure long-term sustainable growth of the palm oil industry which is a vital part of the
Executive Summary
The tropical forests of Indonesia hold large stores of carbon, harbour important biodiversity, and are critical for the
livelihoods of thousands of local communities. The conversion of these forests to other uses including agriculture
or plantations, in particular those over carbon-rich peat land, has made Indonesia one of the largest emitters of
greenhouse gases.
To contribute to a reduction of greenhouse gas emissions and as part of Golden Agri-Resources’ (GAR),
commitment to sustainable palm oil production, GAR in collaboration with The Forest Trust (TFT), a global
non-profit, launched the Forest Conservation Policy (FCP) on 9 February 2011. The FCP focuses on the conservation
of forests and ensures that GAR has no deforestation footprint. The company adopts the FCP for all the plantations
that it owns, manages or invests in regardless of the stake.
This will be achieved by not developing oil palm plantations on areas that have High Conservation Value (HCV)
and areas of peat regardless of depth and not developing forest areas with High Carbon Stock (HCS); obtaining
free, prior and informed consent from indigenous and local communities; and complying with all relevant laws and
internationally accepted certification principles and criteria.
To implement these commitments, GAR, its subsidiary PT SMART Tbk (SMART), TFT, and Greenpeace (together,
the “Team”) collaborated in a study to develop a practical, scientifically robust and cost effective methodology to
define and identify areas of HCS for conservation. Ultimately, the conserved HCS area can revert to its natural
ecological function as a forest. The methodology was based on the premise that there is a correlation between
vegetation density and above ground living wood volume in trees greater than or equal to 5 cm DBH (diameter
above breast height). This is then converted to tonnes of carbon per hectare (tC/ha). It followed the recommendation
of a number of studies that a combination of remote sensing data analysis with ground-based field data is likely to
provide an effective approach. For the purpose of this study, a provisional threshold for HCS forest of greater than
35 tC/ha of above ground biomass (AGB) was set.
Using a learning and adaptive approach, the methodology is summarised below.
The methodology stratified vegetation cover into different classes through analysing satellite images combined
with data from fieldwork. The fieldwork measured 431 plots in four of GAR’s concessions in Central and West
Kalimantan from the first quarter to last quarter of 2011. As the study focused on undeveloped areas which local Steps to identify HCS forest areas within concessions
Stratify concession into strata Socialise with communities Locate sample plots Measure and collect date Estimate carbon of each
stratum Ground-
truthing Inputs for land-use
communities depended on, a socialisation programme was carried out to ensure that the communities understood
and supported the fieldwork. GAR has also sought to engage broadly with the Government of Indonesia, civil
society organisations, local and indigenous communities, key players and others stakeholders in the Indonesian
palm oil industry.
The study found that six strata of vegetation cover could be identified; High Density Forest (HK3), Medium Density
Forest (HK2), Low Density Forest (HK1), Old Scrub (BT), Young Scrub (BM), and Cleared/Open Land (LT) and
these correlated with different average carbon stocks.
Vegetation cover definitions:
•High Density Forest (HK3) – Remnant forest or advanced secondary forest close to primary condition.
Average 192 tC/ha;
•Medium Density Forest (HK2) – Remnant forest but more disturbed than High Density Forest. Average
166 tC/ha;
•Low Density Forest (HK1) – Appears to be remnant forest but highly disturbed and recovering (may contain
plantation/mixed garden). Average 107 tC/ha;
•Old Scrub (BT) – Mostly young re-growth forest, but with occasional patches of older forest within the stratum.
Average 60 tC/ha;
•Young Scrub (BM) – Recently cleared areas, some woody regrowth and grass-like ground cover. Average
27 tC/ha;
•Cleared/Open Land (LT) – Very recently cleared land with mostly grass or crops, few woody plants. Average
17 tC/ha;
Given the similarities in the carbon stock of strata across the different concessions, we plotted the weighted
average carbon stock of the various strata and noticed that some of the strata’s carbon values overlap.
Strata
Weighted average carbon stock (tC/ha)
The study confirmed that trees with larger diameters (DBH greater than 30 cm) dominated the higher carbon strata
(HK1, 2 and 3) and smaller diameters less than 20 cm dominated the lower strata (BT, BM and LT). In addition,
the BT stratum has occasional characteristics of older forest (as seen in the presence of trees of bigger DBH),
consistent with the observation that BT could be regenerating forest. This supports the provisional HCS threshold
falling between BT and BM, and that the lower carbon classes of HCS forest include a potential for regeneration
of carbon stock.
The HCS forest study approach is relatively simple, practical, quick, and cost-effective and is technically sound
to make carbon stock estimates. However it is not rigorous enough or technically sufficient to be used for carbon
accounting, and this was never the intention.
A number of lessons were learnt during the socialisation process with the local communities in the study
concessions. More time could have been spent to explain the objectives of the HCS forest study and address
issues around compensation and allocation for plasma smallholders for areas that would be marked for HCS
conservation.
There were several limitations with the HCS forest study, including the following:
• ThemethodologydidnotaccountforallAGB(e.g.byexcludingtreeswithDBHlessthan5cm,andAGBdead
matter such as logs and branches) and below-ground biomass, meaning carbon was underestimated;
• Fieldsurveyswerelimitedonlytoareaswherepermissionwasobtainedfromthelocalcommunities;
• Satelliteimageswereoflowtomediumresolutionandtwoyearsold.
Following identification of HCS forest areas, an additional conservation process which analyses the shape, size
including “core” size, connectivity and habitat quality would need to occur to ensure that the medium-term objective
of regenerating an ecologically functioning natural forest is achieved. Additional aspects to consider are the legal
status of the land, free, prior informed consent of the local community, the impact of the HCS areas on plantation
design and management, and overall monitoring. The findings of our HCS forest study indicate that:
• Vegetationcovercanbeusedbroadlytoestimatethelevelofcarbonstocks;
• Vegetationcovercanbestratiiedintodifferentclassestobroadlyrepresentdifferentcarbonstocks;
• Acrosssomeofthedifferentclassesofvegetationcovertherearesigniicantdifferencesinthecarbonstock;
• HK2and3areremnantforests,withsomedisturbance;
• HK1isalsoremnantforest,buthighlydisturbedandhasalargernumberofsmallertrees;
• BTappearstobelargelyregeneratingforest,withoccasionalremnantsofolderforests;
The vegetation stratification indicates that:
• ThesettingoftheprovisionalHCSthresholdasmorethan35tC/hawouldresultinHK1,2and3aswellasBT
being classified as HCS and hence could be considered for conservation;
• BMandLTwouldbelowcarbonstockandbeconsideredasnon-HCS,andcouldbedeveloped,subject
to the HCS conservation process (outlined above) and further research that considers the regeneration
potential of BM.
The HCS forest methodology will facilitate GAR’s commitment to ensure no deforestation footprint as outlined in
the FCP. The HCS forest study findings indicate that there is a practical and robust method to identify HCS forest
in GAR’s concessions in Kalimantan. However, for the methodology to be used as a reliable predictive tool for
HCS forests across Indonesia, further testing and fieldwork would be required.
Furthermore, the Team will be presenting the findings and holding wider discussions with representatives from the
Government of Indonesia, civil society organisations, local and indigenous communities, key players and other
stakeholders in the Indonesian palm oil industry, to gather feedback on the study and the outcomes.
More dialogue is also needed to focus on the ways to up-scale this HCS forest study mapping process to
regional or national levels, as well as the options on how to conserve, manage and protect areas designated
as HCS forests.
Upon gathering the required input and feedback from all stakeholders, GAR intends to develop its action plans for
how it will proceed further with this methodology and will announce this in due course.
To be successful in HCS forest conservation, GAR cannot do this alone. It needs to engage with other stakeholders
to find solutions to the existing challenges. GAR is focused on playing a leading role in developing a strong
multi-stakeholder platform to find solutions to conserve the forests, create much needed employment and ensure
1
Introduction
The tropical forests of Indonesia hold large stores of carbon, harbour important biodiversity, and are critical
for the livelihoods of thousands of local communities. The conversion of these forests to other uses including
agriculture or plantations, in particular those over peat lands, has made Indonesia one of the world’s largest
emitters of greenhouse gases.
The Indonesian government has acknowledged this through committing to a 26% reduction in emissions by
2020 or a 41% reduction with international financial assistance1. This commitment was sealed in a moratorium
on any “new concessions converted from natural forests and peat lands into other land-uses including
plantations” when the Norwegian government promised to contribute US$1 billion to a climate partnership with
the Indonesian government2.
1.1 GAR policy commitments
To contribute to a reduction in greenhouse gas emissions and as part of the aim for sustainable palm oil
production, on 9 February 2011, GAR announced its Forest Conservation Policy (FCP), which committed to no
deforestation footprint in its palm oil operations. This is achieved by not developing oil palm plantations on areas
that have High Conservation Value (HCV) and areas of peat regardless of depth, and not developing areas with
High Carbon Stock (HCS).
The FCP is part of GAR’s holistic approach to sustainability, which includes the launch of a Social and Community
Engagement Policy (SCEP) in November 2011, and a Yield Improvement Policy (YIP) in February 2012.
This is in addition to ensuring legality of all operations, implementing the principles of free, prior and informed consent,
and obtaining certification by the Roundtable of Sustainable Palm Oil for all its operations by 20153. The FCP applies
to all the plantations that GAR owns, manages or invests in regardless of the stake.
1 Statement by the President of Indonesia at the 2009 G20 meeting in Pittsburgh.
2 Government of Norway (2010) “Norway and Indonesia in partnership to reduce emissions from deforestation”, Government of Norway press release, 26 May.
1.2 Working with partners and stakeholders
To assist in realising these commitments, GAR has partnered with TFT and has collaborated with Greenpeace
in the implementation of the FCP.
Further, since the launch of the FCP, GAR has been actively engaging with the Government of Indonesia, civil
society organisations, local and indigenous communities, key players and other stakeholders in the Indonesian
palm oil industry. GAR expects that this multi-stakeholder approach will ensure its policy commitments are well
understood, there is feedback on and participation in their implementation, and that transparency throughout the
whole process will give it credibility.
1.3 Development of the HCS forest study approach
Key to GAR’s FCP is developing a practical and cost effective methodology to define and identify areas of HCS
for possible conservation. While there are accepted definitions and methodologies for identifying peat and HCV,
HCS is a new concept with little agreement on its definition and identification. There was no methodology on how
to identify HCS forests in an accurate, consistent and practical manner.
A further objective of the HCS study is to investigate the issues and review the options to estimate carbon stocks,
while developing a scientifically robust and practical methodology for identifying HCS forests. These findings
can be used by GAR and other businesses with similar requirements to develop land-use planning and other
management tools to ensure no deforestation footprint in its operations.
The discussion of the HCS forest concept started in the fourth quarter of 2010 and several different approaches
were considered. GAR developed maps for 13 concessions that contain forest areas and with plans for
new plantings. The vegetation in these concessions was first stratified (see section 2.3.1 for details) using
canopy cover and incorporating information from earlier aerial surveillance conducted by Greenpeace in some
concessions. Areas that appear to contain more vegetation were identified for field visits at eight sites.
We began our initial fieldwork in the fourth quarter of 2010 in these eight sites in one test concession to assess AGB.
We found that most of the carbon in these forest areas (not peat land areas) is in larger trees. Measuring small
trees less than 5 cm in diameter at breast height (DBH) is laborious and the carbon they contain was viewed as
not significant enough to either alter greatly the outcome of the stratification or justify the time and effort that would
While these initial findings provided a framework for the ongoing discussions, GAR announced its FCP in
February 2011. In order to refine the methodology, a provisional definition of HCS forest was set as being
greater than 35 tC/ha in living AGB.
Between the first and last quarter of 2011, fieldwork was conducted in four concessions: PT Kartika Prima Cipta
(KPC), followed by PT Paramitra Internusa Pratama (PIP) and PT Persada Graha Mandiri (PGM) located in
West Kalimantan, and then PT Buana Adhitama (BAT) in Central Kalimantan.
Using a learning and adaptive approach, we improved our stratification process including reducing the number
of strata from 16 to 6 (see section 2.3.1 and Appendix 1 for a full discussion). We also adjusted our sampling
technique based on the results obtained from the first fieldwork (see section 2.3.2) and also changed the way
we selected the plots (see section 2.3.3). The combined data from the four concessions was analysed to assess
how practical and robust the methodology is for identifying HCS forests.
1.4 Socialisation
4The Government of Indonesia grants an ijin lokasi (land-use permit) to companies for development activities on land that has been used before and is considered to be degraded land. However, these areas are often occupied
by local communities. Before any development can take place it is necessary to engage these communities and
where necessary, complete a process of obtaining free, prior and informed consent, as well as compensate them
for their direct or indirect loss of use of these areas through an open and transparent process.
As our HCS forest study involved areas that are not yet developed and could still belong to local communities, it is
important to ensure that they understood and gave their consent for the fieldwork. We also recognise that as with
HCV areas, community support is vital to the successful conservation of HCS areas.
4 Socialisation involves the interaction and engagement with relevant stakeholders such as government representatives, informal leaders, local communities and
2
The High Carbon Stock Forest Methodology
Quantifying biomass and carbon stocks is one of the key components of addressing emissions reductions from
deforestation and forest degradation (Gibbs et al 2007). A number of methodologies have evolved, in particular
based on the proportional relationship between AGB and the product of wood density, tree diameter and total
height (e.g. Chave et al 2005, Brown 1997, Bryan et al 2010).
This approach of quantifying biomass and carbon stocks has been studied in more detail in Indonesia for Dipterocarp
forests in Kalimantan (e.g. Yamakura et al 1986, Basuki et al 2009), and mixed secondary forest in Sumatra
(Ketterings et al 2001). Given the size of areas to be assessed and limited time and resources, a combination of
remote sensing data analysis with ground-based field data is likely to provide an effective approach, as advocated
by many groups, e.g. DeFries et al (2007) and Gibbs et al (2007) in a global assessment and Bryan et al (2010)
for Papua New Guinea.
2.1 The HCS forest study approach
A number of alternative approaches were also considered in the initial stages. These included using canopy
cover, the 20/30 rule and estimating AGB.
Canopy cover was considered as a proxy for biomass and carbon stock based on the Food and Agriculture
Organization (FAO) definition of forest. The FAO definition of forest is “any area with a minimum size of 0.5 ha and
with at least 10% canopy cover” (FAO 2006). However, preliminary studies and fieldwork identified weaknesses of using canopy cover. These included the difficulty of adding up the 10% canopy cover in a degraded mosaic
landscape, inability to separate natural forest cover from other tree cover, and not taking into account regenerating
areas with substantial biomass that may not yet form a canopy.
We considered the “20/30” rule to define HCS forests. This rule as stipulated by the Indonesian Ministry of Forestry
(Peraturan Menteri Kehutanan no. P. 14/Menhut-II/2011), requires operators to obtain a licence before timber can be harvested in areas containing more than 20 cubic metres of timber in trees measuring more than 30 cm in
diameter at breast height (DBH), at 1.3 m above ground level5.
There were concerns that this could result in a significant variation in forest condition within the same area. In other
words, the forest condition could be highly degraded with a few large trees that contain high timber volumes. On
the other hand, some areas have very few trees above 30 cm DBH but contain dense regeneration giving them
high biomass values and potential for conservation. Expert advice was also sought on the “20/30” approach6, and
the general comment was that other factors such as biodiversity and the landscape need to be considered.
5 DBH is measured at 1.3 m above ground level.
Following the recommendations of international studies assessing AGB, using a combination of remote sensing
data analysis with ground-based field data was chosen as the best option to pursue in the study to define and
identify HCS forest areas. To carry out initial methodology development a number of field sites were selected. In
each of these sites, we identified a main plot7, measuring 20 m by 20 m, and measured all the trees with DBH that
are above 20 cm. Within the main area, a sub plot of 10 m by 10 m was identified to measure all trees taller than
2 m and below 20 cm in DBH.
Next we used these measurements as inputs to calculate the AGB. AGB is calculated using a generic
Asia-wide formula, where wood density of 600kg/m3 is generally accepted as an average density for Asian tropical
tree species. AGB is then converted to tonnes of carbon per hectare (tC/ha) using a conversion factor of 0.47
(IPCC 2006).
These initial measurements indicated that we needed:
• SatelliteimageswithhigherresolutiontoidentifyHCSareasmoreaccurately;
• Morefocusonthestratiicationprocessofthesatelliteimagessoastoestablishpreliminaryestimatesofthe
range of carbon values;
• AmorestructuredapproachinconductinganAGBinventoryusinganappropriateallometric8.
As discussed in section 1.3, a provisional definition of HCS forest as being greater than 35 tC/ha in living AGB is
used. This provisional definition is deliberately conservative as the focus is on a portion of the AGB, meaning that
other AGB and below-ground biomass are not measured. Furthermore, other forest values such as biodiversity
are not accounted for.
While this provisional definition is somewhat subjective in its origin, it is backed up by expert review9, and other
research into carbon sequestration by oil palms: “to avoid carbon debt, conversion should be conducted only from shrub and grassland with an aboveground C stock of less than 40 ton C ha” (cited in Dewi et al, 2009 and Van Noordwijk, 2012)10.
To help develop the methodology we engaged a specialist in timber and carbon inventories11. The methodology
includes the plot size to be measured, sampling technique and a Microsoft Access database which performs
statistical calculations for the data collected during the fieldwork.
7 During the initial fieldwork, we marked out a square area of 20 m by 20 m, which we call a main plot. Within this main plot, we then marked out a smaller area
measuring 10 m by 10 m; which we call a sub-plot.
8 Scaling rule or equation that relates tree biomass, carbon or other similar properties to stem diameter and/or tree height. In our study, we use a formula that relates
DBH to AGB biomass of the tree.
9 E.g. “The use of threshold 35 tC/ha should be acceptable for defining HCS concept when the estimation of the biomass only consider from trees with diameter of more
than or equal to 5 cm.” (de Boer 2011, pers. Comm). Also, research carried out in Jambi found that “the lower carbon stock estimate of the above ground biomass in secondary forest was about 32 tC/ha and had potential to regenerate naturally”. (Wasrin, U.R., Rohiani, A, Putera, A.E. and Hidayat, A. 2000. Assessment of aboveground C-stock using remote sensing and GIS technique. Final Report, Seameo Biotrop, Bogor, pg28)
10 Also see the review paper “Greenhouse Gas Emissions from Palm Oil Production” prepared by the RSPO Greenhouse Gas Working Group (2009); it includes
citations which calculated that over a 25 year rotation, oil palm plantations have mean carbon stock of 35.3 tC/ha.
11 George Kuru, President Director of Ata Marie Group Ltd, a specialist provider of professional services to the Forestry, Agri-Business and Natural Resource
However, given the carbon content (AGB and Below Ground Biomass) of primary equatorial tropical forest may
exceed 200 tC/ha (Gibbs et al 2007), it would therefore follow that ‘high carbon’ would denote forest with carbon
stocks of approximately 150 tC/ha or more. As an objective of the HCS forest study approach is to ensure forest
viability through regenerating to an ecologically functioning state in the medium to long term, this includes a major
element of potential forest carbon i.e. AGB carbon that will be accumulated through the forest regenerating. For
our study, the term High Carbon Stock therefore includes a component of potential carbon stock.
Thus as a provisional threshold, 35 tC/ha can be used to identify actual and potential areas of HCS and, while
based on carbon, it is assumed that it also serves as a proxy for biodiversity and other forest values. For our study,
only living AGB, defined as biomass in trees with a DBH greater than or equal to 5 cm (Brown 1997), is measured.
Plantations and mixed gardens are not part of our study, which is focused on natural forest, but we recognise that
such areas can contain high quantities of carbon.
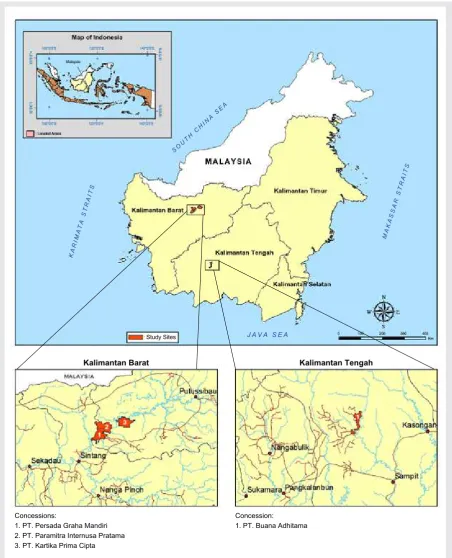
2.2 Location of the study sites/concessions
In total, fieldwork was conducted in four concessions where new plantings are taking place.
These concessions contain large areas that are still covered with vegetation and are subjected to extensive
human disturbances, including timber harvesting and swidden agriculture (BSI-CUC 2010). In addition, these
concessions are selected for ease of access to study locations and community engagement. As with all our
concessions, these four concessions are designated as land for other uses (APL).
Three of the concessions are in West Kalimantan and one is in Central Kalimantan (see Figure 1). They range
from 14,000 ha to 20,000 ha.
The dominant vegetation in West Kalimantan where we conducted our fieldwork is forest types commonly
subject to water inundation (Shorea sp.) as well as dry land forests (Dipterocarpaceae sp.) at higher elevations. These sites also contained heath forest, which is dominated by trees with smaller diameters. However, the
vegetation in Central Kalimantan is less varied, consisting mainly of dry land forests. In both regions, there are
Figure 1 – Map of Kalimantan, Indonesia, with the location of the four HCS forest study concessions. Three concessions are in the province of Kalimantan Barat (West Kalimantan), and one concession is located in the province of Kalimantan Tengah (Central Kalimantan).
Concession:
1. PT. Buana Adhitama Concessions:
1. PT. Persada Graha Mandiri 2. PT. Paramitra Internusa Pratama 3. PT. Kartika Prima Cipta
Kalimantan Barat Kalimantan Tengah
J A V A S E A
2.3 Methodology
Our method is based on the assumption that there is a correlation between vegetation cover and carbon
stock, and that this correlation is broadly consistent across and within similar conditions (MacDicken 1997,
Gibbs et al 2007, Solichin et al 2011).
Since there are no similar studies that can act as a precedent, we refined our methodology as we progressed.
Initially, we grouped or stratified vegetation cover by their canopy densities by analysing satellite images. This
desktop review is supplemented with fieldwork where we measured the carbon for each of the stratum within
sample plots.
In our entire study, carbon is measured indirectly as we are unable to conduct a destructive sampling
experiment12. Instead, we used the DBH of the trees in the sample plot as a proxy to calculate the carbon in
the vegetation within the strata. We extrapolated the results of the sample plots to the rest of the concessions.
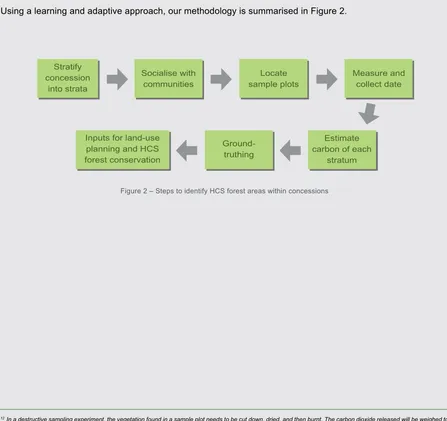
Using a learning and adaptive approach, our methodology is summarised in Figure 2.
Figure 2 – Steps to identify HCS forest areas within concessions
12 In a destructive sampling experiment, the vegetation found in a sample plot needs to be cut down, dried, and then burnt. The carbon dioxide released will be weighed to
provide a measurement of the amount of carbon stored in the vegetation. Stratify
concession into strata
Socialise with communities
Locate sample plots
Measure and collect date
Estimate carbon of each
stratum Ground-
truthing Inputs for land-use
2.3.1 Stratification
The objective of stratification is to classify vegetation into distinct groups and in the process minimise
intra-stratum variance. This can be achieved by interpreting vegetation cover from satellite images of areas being
studied (GOFC-GOLD 2010). Put simply, the colours and textures on the satellite photos approximate different
densities of vegetation and can be grouped accordingly. The process of stratification is discussed in full in
Appendix 1.
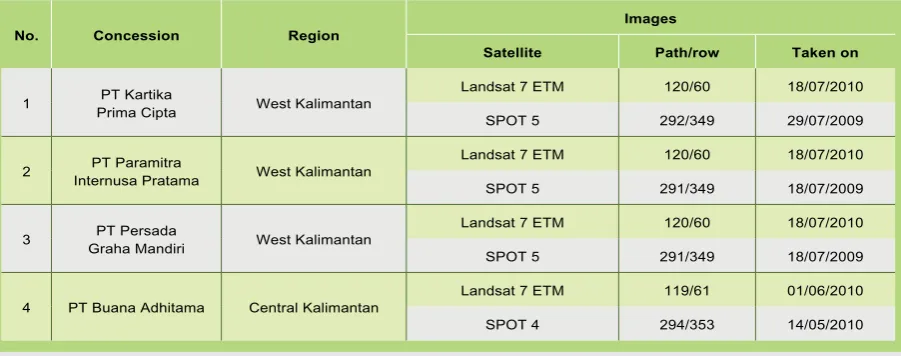
As recent satellite images were not readily available, we used a combination of Landsat images comprising
medium-resolution images such as SPOT-4, with a spatial resolution of 20 m, and SPOT-5, with a spatial
resolution of 10 m. See Table 1 below.
No. Concession Region
Images
Satellite Path/row Taken on
1 PT Kartika
Prima Cipta West Kalimantan
Landsat 7 ETM 120/60 18/07/2010
SPOT 5 292/349 29/07/2009
2 PT Paramitra
Internusa Pratama West Kalimantan
Landsat 7 ETM 120/60 18/07/2010
SPOT 5 291/349 18/07/2009
3 PT Persada
Graha Mandiri West Kalimantan
Landsat 7 ETM 120/60 18/07/2010
SPOT 5 291/349 18/07/2009
4 PT Buana Adhitama Central Kalimantan
Landsat 7 ETM 119/61 01/06/2010
SPOT 4 294/353 14/05/2010
Table 1 – Information on the satellite images used in this study
During our study, we improved the process of stratification as new information and data were collected from the
fieldwork (see Appendix 1 for details). We began with 16 strata classified by the Image Processing Software,
which were later streamlined to only six strata. Through an iterative process of data analysis and fieldwork, we
were able to classify the vegetation into relatively statistically distinct strata.
The six strata are:
• HK3:HighDensityForest(Hutan Lahan Kering 3)
• HK2:MediumDensityForest(Hutan Lahan Kering 2)
• HK1:LowDensityForest(Hutan Lahan Kering 1)
• BT:OldScrub(Belukar Tua)
• BM:YoungScrub(Belukar Muda)
• LT:Cleared/OpenLand(Lahan Terbuka)
We also developed an Interpretation Key (see Appendix 3) to help us interpret satellite images into the six
2.3.2 Sampling
As the fieldwork covered vast areas, we identified sample plots to measure AGB in trees more than or equal
to 5 cm DBH. Furthermore, we focused the sample plots on the strata that we expected would overlap the
provisional threshold of 35 tC/ha. In these strata we planned to measure about 25 plots. For the other strata, we
planned to measure a minimum of 15 plots per stratum.
Using the results from the first fieldwork at PT KPC as a sampling study for the other concessions, the coefficient
of variance for the target strata was calculated using the Winrock Terrestrial Sampling Calculator with a 5%
sampling error (Pearson 2006).
In our final fieldwork at PT BAT, a coefficient of variance of 45% was used for the strata where we envisaged
that the provisional threshold of 35 tC/ha occurs.
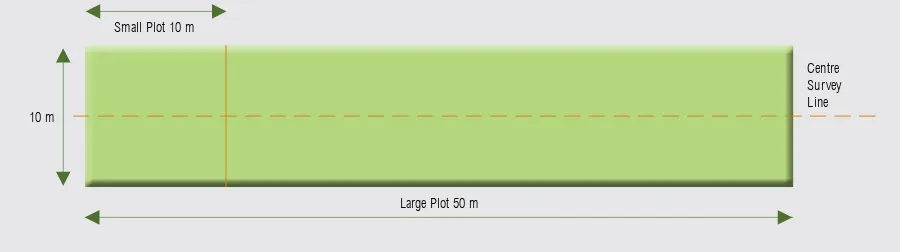
2.3.3 Design of sample plot
We used a rectangular nested design for our sample plots. This design incorporates a smaller 10 m by 10 m
plot, where trees with DBH of greater than or equal to 5 cm and less than 20 cm were measured, within a larger
10 m by 50 m large plot where all trees with DBH greater than or equal to 20 cm were measured (see Figure 3).
We recognise that the smaller plot size is relatively smaller than those used in other studies (e.g. Pearson et al
2005). However, as our study focused on degraded areas with few trees of 20 to 50 cm in DBH, the smaller plot
size is justified as we expect the smaller plot to produce more variable results in more heavily forested areas.
This sample plot design was used in subsequent fieldwork.
During the fieldwork, each tree was assigned a number, and we recorded its DBH and species type. This information
was written on a label that was stapled to the tree for any future quality control checking. In addition to measuring
the trees, we recorded a visual assessment of vegetation cover for comparison purposes. We also assessed the
soil type visually, and took photographs in five different directions, namely North, South, East, West and skywards. 10 m
Large Plot 50 m Small Plot 10 m
Centre Survey Line
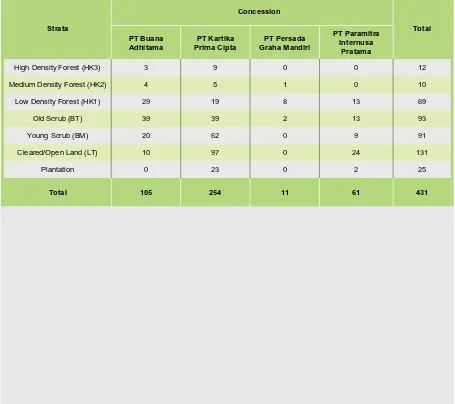
2.3.4 Plot details
Two different techniques were used in designing the 431 plots that were sampled in all the four concessions
(see Table 2 below). In PT KPC, given the lack of baseline data, transect lines were used. Subsequently, we
refined the technique and identified plots randomly.
a) Transect Plots
Plots are systematically located every 200 m across transect lines drawn across the concession.
b) Random plots
Plots were randomly located across the concessions and within targeted strata, although some random
plots were not measured, as they were inaccessible. To navigate to these plots, we used a hand-held
Global Positioning System.
Strata
Concession
Total PT Buana
Adhitama
PT Kartika Prima Cipta
PT Persada Graha Mandiri
PT Paramitra Internusa
Pratama
High Density Forest (HK3) 3 9 0 0 12
Medium Density Forest (HK2) 4 5 1 0 10
Low Density Forest (HK1) 29 19 8 13 69
Old Scrub (BT) 39 39 2 13 93
Young Scrub (BM) 20 62 0 9 91
Cleared/Open Land (LT) 10 97 0 24 131
Plantation 0 23 0 2 25
Total 105 254 11 61 431
3
Data Analysis
We estimated the carbon stock within each stratum and overlaid these estimates with the provisional HCS
threshold of 35 tC/ha. The similarities or differences between each stratum across the four concessions were
also investigated.
3.1 Allometric
A tree’s biomass is estimated from its DBH by using a generic allometric for Tropical Moist Forests (Brown
1997), where
Biomass = 42.69 - 12.800*DBH + 1.242*DBH
2This equation is developed from multiple sources, using trees with DBH between 5 cm and 148 cm, including trees
from East Kalimantan (Brown 1997). This is not a locally developed allometric equation but the data set behind it
does include a large number of trees harvested from Dipteocarp forests in East Kalimantan and thus we assume it would serve our needs. The use of more general equations developed for tropical moist forests is common
practice (e.g. Pearson et al 2005). To develop a local one would be ideal, but this is expensive to develop and not
practical for this project given the time available and the diversity of trees found across Kalimantan.
To calculate the amount of carbon per plot, we used a carbon conversion factor of 0.47 (IPCC 2006) and
converted kilograms of biomass to tonnes of molecular carbon per tree. After the tree carbon weight was
summed for each plot, we calculated the amount of carbon per plot which we then extrapolated to a per hectare
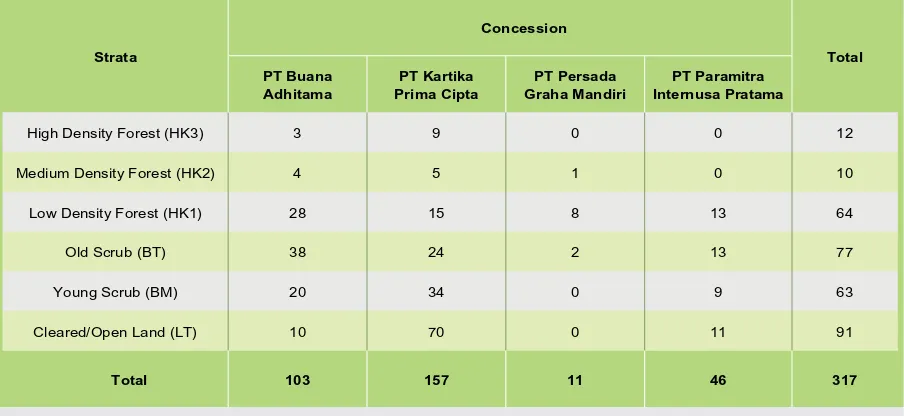
Strata
Concession
Total PT Buana
Adhitama
PT Kartika Prima Cipta
PT Persada Graha Mandiri
PT Paramitra Internusa Pratama
High Density Forest (HK3) 3 9 0 0 12
Medium Density Forest (HK2) 4 5 1 0 10
Low Density Forest (HK1) 28 15 8 13 64
Old Scrub (BT) 38 24 2 13 77
Young Scrub (BM) 20 34 0 9 63
Cleared/Open Land (LT) 10 70 0 11 91
Total 103 157 11 46 317
Table 3 – Number of plots per stratum included in the final data analysis
3.3 Data extrapolation to calculate and estimate carbon stock
Carbon values for each stratum were calculated by averaging plot data to produce a mean carbon value for
each stratum. To calculate the confidence level of our mean, we used a 90 percent confidence level to calculate
our data.
3.2 Data checking
A total of 114 anomalous plots were removed from the final analysis because of uncertainty or inconsistency in
allocating forest cover vegetation classification to specific plots. These plots are in:
• Areaswheretherewasrecenthumanactivitysubsequenttothesatellitemappingsuchastimberharvesting
(12 plots);
• Areasintransitionfromforesttoopenlandorviceversa(14plots);
• Areaswithpoorvisibilityofsatelliteimagesduetocloudcover(3plots);
• Areaswheretherewereplantations,riceields,ormixedgardens(85plots).
The data checking process is based on notes taken during fieldwork. The number of plots used for the final
4
Results and Discussion
4.1 Results
Our findings support research indicating that carbon stock declines correspondingly to a decline in vegetation
canopy density (e.g. Solichin 2011, Dewi 2009). While this is expected, these findings support the use of vegetation
canopy cover to estimate the average carbon stock and therefore as a useful way to define and map HCS.
The results as summarised in Table 4 indicate that there are:
• Similaritiesinthecarbonstockofstrataacrossthedifferentconcessions;
• Differencesinthecarbonstockbetweenstrata.
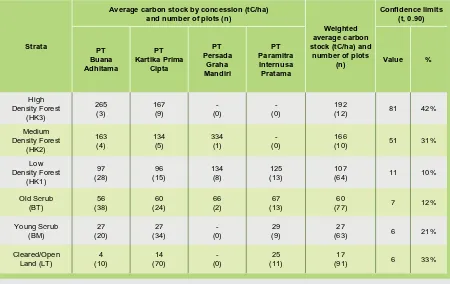
Given the similarities in the carbon stock of strata across the different concessions, we plotted the weighted
average carbon stock of the various strata and noticed that some of the strata’s carbon values overlap.
Strata
Average carbon stock by concession (tC/ha) and number of plots (n)
Weighted average carbon stock (tC/ha) and
number of plots (n) Confidence limits (t, 0.90) PT Buana Adhitama PT Kartika Prima Cipta PT Persada Graha Mandiri PT Paramitra Internusa Pratama Value % High Density Forest (HK3) 265 (3) 167 (9) -(0) -(0) 192
(12) 81 42%
Medium Density Forest (HK2) 163 (4) 134 (5) 334 (1) -(0) 166
(10) 51 31%
Low Density Forest (HK1) 97 (28) 96 (15) 134 (8) 125 (13) 107
(64) 11 10%
Old Scrub (BT) 56 (38) 60 (24) 66 (2) 67 (13) 60
(77) 7 12%
Young Scrub (BM) 27 (20) 27 (34) -(0) 29 (9) 27
(63) 6 21%
Cleared/Open Land (LT) 4 (10) 14 (70) -(0) 25 (11) 17
(91) 6 33%
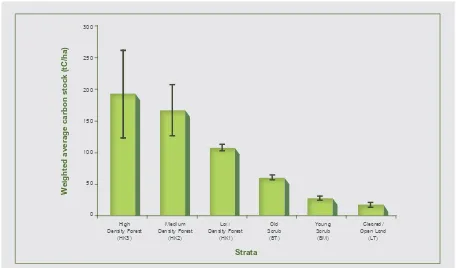
To establish if there is any statistical difference between the weighted average carbon stock across the strata, we
conducted an analysis of variance (ANOVA) which indicated that there are statistically distinct groups (see Table 5).
As the ANOVA results only indicate that a difference exists among means, not which pair or pairs of means are
different, a multiple comparisons test is used to detect where the differences lie.
We chose the Scheffe test as it allows the determination of simultaneous confidence intervals for group only
[image:22.595.84.540.84.352.2]based on the number of groups (strata) and the number of observations (plots).
Table 5 – ANOVA analysis of the six strata
Source DF SS MS F PROB>F
Between 5 701427 140285 54.97 0.000
Within 313 798769 2552
[image:22.595.93.543.449.531.2]Total 318 1500196
Figure 4 – Weighted average carbon stock of the various strata
Strata
Weighted average carbon stock (tC/ha)
300
250
200
150
100
50
0
High Density Forest
(HK3)
Medium Density Forest
(HK2)
Low Density Forest
(HK1)
Old Scrub
(BT)
Young Scrub (BM)
Cleared/ Open Land
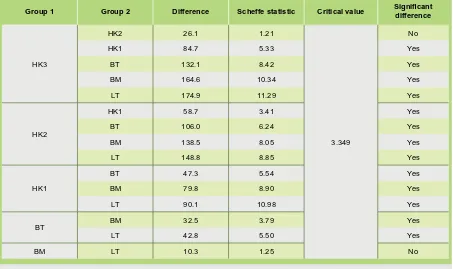
As summarised in Table 6, we found that:
• TherearenosigniicantdifferencesbetweenHK3andHK2;
• TherearenosigniicantdifferencesbetweenBMandLT;
• Otherpairsofstrataaresigniicantlydifferentfromeachother.
From the observations made during the fieldwork, we could describe the strata according to their general
qualitative characteristics (see Appendix 4 for photos):
• HK3 – Remnant forest or advanced secondary forest close to primary condition;
• HK2 – Remnant forest but more disturbed than High Density Forest;
• HK1 – Appears to be remnant forest but highly disturbed and recovering (may contain plantation/mixed garden);
• BT – Mostly young re-growth forest, but with occasional patches of older forest within the stratum;
• BM – Recently cleared areas, some woody re-growth and grass-like ground cover;
• LT – Very recently cleared land with mostly grass or crops, few woody plants.
Group 1 Group 2 Difference Scheffe statistic Critical value Significant difference
HK3
HK2 26.1 1.21
3.349
No
HK1 84.7 5.33 Yes
BT 132.1 8.42 Yes
BM 164.6 10.34 Yes
LT 174.9 11.29 Yes
HK2
HK1 58.7 3.41 Yes
BT 106.0 6.24 Yes
BM 138.5 8.05 Yes
LT 148.8 8.85 Yes
HK1
BT 47.3 5.54 Yes
BM 79.8 8.90 Yes
LT 90.1 10.98 Yes
BT
BM 32.5 3.79 Yes
LT 42.8 5.50 Yes
BM LT 10.3 1.25 No
A further analysis (summarised in Appendix 2) of the diameter of trees found across the different strata indicated
a significant dominance of trees with smaller diameters (DBH less than 20 cm) in the lower carbon strata (BT,
BM and LT). As expected, trees with larger diameters (DBH greater than 30 cm) dominated the higher carbon
strata (HK1, 2 and 3).
In addition, the BT stratum has sporadic presence of trees of larger DBH, consistent with the observation that
old scrub could be regenerating forest.
4.2 Discussion
The approach described and the study that was carried out are tailored specifically for a rapid assessment of
vegetation to determine if there is a difference in the amount of carbon between strata and if they should be
classified as HCS forest or not. Thus the methodology adopted is relatively simple, practical, quick and
cost-effective while maintaining an overall technical robustness. It is not rigorous enough or technically sufficient to
be used for carbon accounting and this was never the intention.
It is significant that three of the strata (HK1, BT and BM) are statistically distinct from each other and the other
strata. The correlated carbon content of these different strata thus provides good information for HCS forest
identification. It is also of interest that HK2 and HK3 are not statistically distinct from each other, most probably
due to the small sample size, so it may be practical for future work to group these two strata into one. BM and
LT are also not statistically distinct. Further study is required to ascertain the reasons for this.
However, with BM and LT clearly classified as low carbon, it allows these areas to potentially be converted
into plantations.
With the BM stratum containing a high proportion of smaller stems of regenerating trees, it is possible that the
decision to exclude stems less than 5 cm in diameter has meant the biomass and carbon could be considerably
higher than currently assessed, to a point that it would exceed the upper tC/ha range of BM. It is possible that if
the factors that caused the forest degradation ceased, BM could restore itself to forest with much higher carbon
values and thus become HCS. Further study on this would be required to determine if this is a realistic scenario
To some degree, by setting the provisional threshold at 35 tC/ha there is a collective decision on needing to draw
the line on what forest lands are substantially degraded and low carbon that they can effectively be considered
non-forest (and therefore can be converted to other uses). This was necessary to be able to be pragmatic in
the field and for on-going land management. Furthermore, in the HCS forest conservation process described
below, viability and regeneration potential of areas are considered in the final boundary setting, connectivity and
rationalisation of blocks for conservation. This will enable some of these areas with high regeneration potential
and high ecological viability to be conserved through being part of or connected to larger blocks of HCS forest.
The considerations for conserving these areas is discussed further in section 4.3.
There were also some challenges and lessons learnt in the socialisation process with the local communities in
the study concessions. More time could have been spent to explain the objectives of the HCS forest study to the
local communities.
While conducting fieldwork in the second and third concessions, it was observed that the communities were
concerned about compensation for areas that would be marked for HCS forest conservation. The communities
were also concerned about the impact of conserving HCS forests on their potential plasma holdings13. In the
interest of maintaining good community relations, the fieldwork was suspended in these two concessions, reducing
the number of plots that could be surveyed.
Learning from this experience, we developed and implemented a comprehensive socialisation programme before
commencing fieldwork in the fourth and final concession, PT BAT. This included face to face meetings and using
visual aids like posters to explain the objectives of the HCS forest study to the local people and community
leaders. During this interactive process, we also obtained feedback from these communities on their attitudes
towards HCS forests, how they must be involved in the conservation of HCS forests, how they view forests and
how they would like to see them being managed. After this comprehensive and concerted socialisation, the
fieldwork in PT BAT was conducted fully.
13 Between 1978 and 2001, the Government of Indonesia and the World Bank provided policy support and financial support respectively, to nucleus-plasma (Perkebunan
Inti Rakyat or PIR) supported grower schemes, in which plantation companies would develop oil palm plots for smallholders in a “plasma” area around their own plantations (“nucleus”). Management of plasma plots, generally 2 ha of oil palm plus 1 ha for other crops, would be transferred to individual smallholders after 3-4 years. The nucleus-plasma schemes were conceived as an integral part of the government’s transmigration programme, where people from Java and other densely populated islands were resettled on less populated islands. In a typical scheme, holders of the plasma plots would be supported in the early years before the oil palms reached maturity, through employment and subsistence agriculture. The management of the plasma area would come officially under a cooperative of smallholders, which would generally contract technical functions back to the nucleus plantation company. Hence, plasma smallholders are often engaged as workers on their plots. They receive additional income through the guaranteed sale of fresh fruit bunches at a price set through a government formula. The plasma scheme evolved from
the original PIR to KKPA (Koperasi Kredit Primer untuk Anggotanya) in 1986, to the current Revitalisation Programme (Pengembangan Perkebunan Melalui Program
4.2.1 Limitations of the study
As a learning and adaptive approach to our HCS forest study was taken, there were a number of limitations and
biases in the study.
The small plot size used is more suited for highly disturbed sites (larger plot sizes should be used for more
intact forests). The methodology did not account for all AGB (e.g. by excluding trees with DBH less than
5 cm, and AGB dead matter such as logs and branches) and below-ground biomass. This means that the
total carbon stored in the area was underestimated and reinforces a conservative HCS threshold. The carbon
estimates generated will thus not be directly applicable for full carbon accounting. We also did not undertake
a full biological survey, so other important elements to consider for conservation, such as species and habitat
diversity and habitat quality, were not directly taken into account.
As the study was limited to areas where permission was obtained from the local communities, this may have
biased our results through not being able to complete a fully statistically valid sampling approach. The study was
also limited to using satellite images that were taken up to two years earlier. Hence there could be subsequent
disturbance resulting in changes to the vegetation canopy cover. The quality of the findings could have been
improved by using more recent satellite images, but there were problems with their availability (especially cloud
free images).
However, with medium-resolution satellite images, there is still a potential for human error being introduced in
the course of their interpretation. It was found that while the boundaries between two very distinct strata could
be differentiated and mapped, such as HK2 and LT, other strata such as HK1 and BT are more difficult to
differentiate as the boundaries between these two strata are not distinct. The use of high-resolution satellite
or aerial imagery along with semi-automated processing is expected to assist in addressing this limitation.
Likewise, the visual interpretation of satellite images of vegetation canopy cover cannot fully identify land use.
Hence, an area mapped as HK1 may well be a timber plantation or mixed garden.
To achieve a scientifically robust method, stratification should be accompanied by extensive ground-truthing,
which in turn can be used to refine the stratification process. Ground-truthing is also necessary to improve
the demarcation of boundaries between the different strata for land use planning such as conservation and
4.3 Conservation of HCS areas
Given the degraded nature of the concessions which are mainly ex-logging areas, we found patches of varying size
and degree of isolation for the different strata throughout the concessions. Studies in tropical forests elsewhere
in the world indicate that the size, shape, connectivity, and quality of these forest patches have a huge influence
on their immediate to medium- or long-term viability to regenerate into an ecologically functioning natural forest.
To ensure that the conserved HCS forest areas can regenerate themselves, the following key principles were
developed to guide the analysis and patch selection process and to provide on-going monitoring and management.
The key principles are to:
• Maximisetheoverallsizeofapatch;
• Maximisethe“corearea”ofapatch(areaofforestsrelativelyunaffectedby“edge”effects);
• Maximisethedegreeofconnectednessbetweenpatchesandcreatecorridorsandlinkagesbetweenpatches.
Based on these principles, landscape level conservation planning tools can be developed to select the HCS forest
areas, as well as to facilitate monitoring or research programmes within these areas.
Given the complexity of this issue, a research and monitoring programme needs to be initiated together with HCS
forest conservation in order to develop a systematic and effective approach to identify which patches should be
conserved versus those that have little conservation value and potentially may be developed.
In addition to the ecological viability considerations, broader social and management issues also need to be
addressed to ensure long-term viability of the patches. These include:
• DeterminingthelegalstatusofHCSconservationareasintheIndonesiancontext,astherecouldbethreatsof
conversion of these conserved areas by other parties;
• Obtainingfree,priorandinformedconsentfromlocalcommunitiestoconserveHCSforests,bearinginmind
that local communities’ support and involvement in forest conservation is vital;
• ManagingtheimpactoftheHCSconservationareasonoilpalmplantationdesignandmanagement;
• Using oil palm plantation design to support inter-rotation connectivity between patches of conserved HCS
forests to facilitate movement of animals, if any.
As pointed out by Wilcove and Koh (2010), “a mixture of regulations and incentives targeted at all sectors of the
5
Conclusion and Recommendations
The findings of HCS forest study indicate that:
• Vegetationcovercanbeusedbroadlytoestimatethelevelofcarbonstocks;
• Vegetationcovercanbestratiiedintodifferentclassestobroadlyrepresentdifferentcarbonstocks;
• Acrosssomeofthedifferentclassesofvegetationcovertherearesigniicantdifferencesinthecarbonstock;
• HK2and3areremnantforests,withsomedisturbance;
• HK1isalsoremnantforest,buthighlydisturbedandhasalargernumberofsmallertrees;
• BTappearstobelargelyregeneratingforest,withoccasionalremnantsofolderforests;
• BMandLTappeartohavebeenclearedrecentlyandarere-growth.
The vegetation stratification indicates that:
• ThesettingoftheprovisionalHCSthresholdasmorethan35tC/hawouldresultinHK1,2and3aswellas
BT being classified as HCS and hence could be considered for conservation;
• BMandLTwouldbelowcarbonstockandconsideredasnon-HCS,andcouldbedeveloped,subjectto
the HCS forest conservation process (outlined above) and further research that considers the regeneration
potential of BM.
The HCS forest methodology will facilitate GAR’s commitment to ensure no deforestation footprint as outlined
in the FCP. The HCS forest study findings indicate that there is a practical and robust method to identify HCS
forest in GAR’s concessions in Kalimantan. However, for the methodology to be used as a reliable predictive
tool for HCS forests across Indonesia, further testing and fieldwork would be required.
Furthermore, the Team will be presenting the findings and holding wider discussions with representatives from
the Government of Indonesia, civil society organisations, local and indigenous communities, key players and
other stakeholders in the Indonesian palm oil industry, to gather feedback on the study and the outcomes.
More dialogue is also needed to focus on the ways to up-scale this HCS forest study mapping process to
regional or national levels, as well as the options on how to conserve, manage and protect areas designated
Upon gathering the required input and feedback from all stakeholders, GAR intends to develop its action plans
for how it will proceed further with this methodology and will announce this in due course.
To be successful in HCS forest conservation, GAR cannot do this alone. It needs to engage with other
stakeholders to find solutions to the existing challenges. GAR is focused on playing a leading role in developing
a strong multi-stakeholder platform to find solutions to conserve the forests, create much needed employment
and ensure long-term sustainable growth of the palm oil industry which is a vital part of the Indonesian economy.
5.1 Recommendations for future research
Further research needs to be conducted on the stratification methodology if it is to be used in other parts of
Indonesia, considering that variations in strata characteristics in these areas that are likely to occur. More study
is needed to determine if our methodology is applicable regionally or nationally. This would in particular be
useful to determine if the strata BM and LT are distinct or if it is more practical to combine them to simplify the
methodology along with combining HK2 and HK3.
Additionally, consideration should be given to updating the methodology to improve the accuracy and reliability of
the outcomes including: allometric equations that include species-specific wood densities, carrying out test plots
on the carbon stored in saplings less than 5 cm DBH, use of circular plots and distance measuring equipment
(DME), or incorporating a Quality Control plan into the standard operating procedure for the methodology.
Given the approach to conduct the study within a limited time frame and resources, existing satellite images were
used with its inherent limitations (outdated and of low to medium resolution). Hence future research and study
could consider using other technology such as LiDAR14 or high resolution imagery to provide better quality data. We
would also recommend that additional Geographic Information System tools be incorporated into the methodology
to allow a semi-automated classification procedure, as well as databases to provide more information on likely
land uses, to improve the speed and consistency of mapping the six strata. As a starting point, we have developed
an interpretation key to guide this process (see Appendix 3).
14 LIDAR (Light Detection And Ranging) is an optical remote sensing technology that can measure distance by measuring the time it takes for a light, or more often
One of the key objectives of conserving HCS forest is that the conserved area can revert to its natural ecological
function as a forest. While potential regeneration and increase in carbon stocks is inherent in the HCS forest study
approach, we need to understand the conditions that are required for nature to take its full course and the impact
on human and economic activities to allow this to happen. Further consideration of how this potential carbon is
incorporated into the HCS forest study approach is needed.
Also given the legal challenges as well as incentives necessary to achieve HCS forest conservation, there is much
to be done to find equitable solutions. We envisage that successful HCS forest conservation needs to involve the
Government of Indonesia, civil society organisations, local and indigenous communities, key players and other
stakeholders in the Indonesian palm oil industry.
Glossary
Above ground biomass (AGB): Biomass above the soil surface, e.g. trees and other vegetation.
Allometry: The morphological evolution of species, based on the relation between an organism’s size and the size
of any part of the organism, i.e. the change in proportion between size and shape as a consequence of growth.
Allometric equation: Scaling rule or equation that relates tree biomass, carbon or other similar properties to stem
diameter and/or tree height.
Biomass: Organic material both above ground and below ground, both living and dead, e.g. trees, crops, grasses,
tree litter, roots, etc.
Carbon stock: The quantity of carbon contained in a “pool”, meaning a reservoir or system which has the capacity
to accumulate or release carbon. In the context of forests it refers to the amount of carbon stored in the world’s
forest ecosystem, mainly in living biomass and soil, but to a lesser extent also in dead wood and litter.
Carbon sequestration: The process of removing carbon from the atmosphere and depositing it in a reservoir.
Carbon dioxide is naturally captured from the atmosphere through biological, chemical or physical processes.
Some sequestration techniques exploit these natural processes while others use artificial processes.
Diameter at breast height (DBH): The standard method of expressing the diameter of the trunk or bole of a
standing tree. Tree trunks are measured at the height of an adult’s breast, which is defined differently in different
countries and situations. In continental Europe, Australia, the UK, and Canada the diameter is measured at 1.3
metres above ground and in the US, New Zealand, Burma, India, Malaysia, and South Africa at 1.4 metres. In
many cases the height makes little difference to the measured diameter.
Landsat: Satellite-based remote sensing technology for earth observation. Medium-resolution Landsat images
are acquired from optical and multi-spectral sensors, which are highly capable of detecting forest and land cover
changes. Due to their limitation to penetrate cloud and aerosols, cloud cover is the biggest problem that hinders
monitoring in tropical areas.
SPOT: Système Pour l’Observation de la Terre (lit. “System for Earth Observation”) a high-resolution, optical
imaging earth observation satellite system operating from space. Medium-resolution Landsat images are acquired
from optical and multi-spectral sensors, which are highly capable of detecting forest and land cover changes. Due
to their limitation to penetrate cloud and aerosols, cloud cover is the biggest problem that hinders monitoring in
Acknowledgements
We would like to acknowledge the following persons for their contribution to the HCS forest study and methodology,
and in the writing and editing of this report:
• GeoffRoberts,DejanLewis(TFT)
• LeonardSoriano,GrantRosoman,KikiTauik,FaridWajdi(Greenpeace)
• Widagdo,TriAgusSugiyanto,DevaraPrawiraAdiningrat,WilliemCahyadi(PTSMART),LeeJweeTat(GAR)
We would also like to thank the following individuals for their valuable contributions in reviewing the methodology,
the data and various versions of this report:
• GeorgeKuru(AtaMarie)
• RizaldiBoer(BogorInstituteofAgriculture,Indonesia)
• SandraBrown(WinrockInternational)
References
Ata Marie, 2011. Procedures for carbon stock inventory for oil palm estate management. Unpublished report prepared for Golden Agri-Resources and The Forest Trust.
Basuki, T., van Laake, P., Skidmore, A., Hussin, Y., 2009. Allometric equations for estimating the above-ground biomass in tropical lowland Dipterocarp forests. Forest Ecology and Management, 257: 1684-1694.
Brown, S., Lugo, A., 1992. Aboveground biomass estimates for tropical moist forests of the Brazilian Amazon.
Interciencia, 17: 8-18.
Brown, S., 1997. Estimating Biomass and Biomass Change of Tropical Forests: a Primer. FAO FORESTRY PAPER 134, Rome: FAO - Food and Agriculture Organization of the United Nations.
Bryan, J., Shearman, P., Ash, J., Kirkpatrick, J., 2010. Estimating rainforest biomass stocks and carbon loss from deforestation and degradation in Papua New Guinea 1972-2002: Best estimates, uncertainties and research needs.
Journal of Environmental Management, 91: 995-1001.
BSI-CUC, 2010. Verifying Greenpeace Claims Case: PT SMART Tbk. Consulting Report, Indonesia: BSI-CUC. http://www.goldenagri.com.sg/pdfs/News%20Releases/2010/IVEX%20Report%20by%20CUC%20and%20BSI%20 10%20Aug%2010.pdf
Chave, J., Andalo, C., Brown, S., Cairns, M.A., Chambers, J.Q., Eamus, D., Folster, H., Fromard, F., Higuchi, N., Kira, T., Lescure, J.P., Nelson, B.W., Ogawa, H., Puig, H., Riera, B., Yamakura, T., 2005. Tree allometry and improved estimation of carbon stocks and balance in tropical forests. Oecologia, 145, 87–99.
DeFries, R., Achard, F., Brown, S., Herold, M., Murdiyarso, D., Schlamadinger, B., de Souza Jr, C., 2007. Earth observations for estimating greenhouse gas emissions from deforestation in developing countries. Environmental Science andPolicy, 10: 385 – 394.
Dewi, S., Khasanah, N., Rahayu, S., Ekadinata, A., van Noordwijk, M., 2009. Carbon Footprint of Indonesian Palm Oil Production: a Pilot Study. World Agroforestry Centre - ICRAF SEA, Regional Office.
FAO, 2006. Global Forest Resources Assessment 2005. FAO, Rome.
Gibbs, H.K., Brown, S., Niles, J.O. and Foley, J.A., 2007. Monitoring and Estimating Tropical Forest Carbon Stocks: Making REDD a Reality. Environmental Research Letter, 2: 1–13
IPCC, 2006. 2006 IPCC Guidelines for National Greenhouse Gas Inventories. Chapter 4: Forest Land, Volume 4, Agriculture, Forestry and Other Land Use. Published by IGES, Japan.
Ketterings, Q., Coe, R., van Noordwijk, M., Ambagau, Y., Palm, C., 2001. Reducing uncertainty in the use of allometric biomass equations for predicting above-ground tree biomass in mixed secondary forests. Forest Ecology and Management,146: 199-209.
Kuru, G., 2011. Personal communication. Ata Marie Group Ltd, Jakarta.
Lawrence, D., 2005. Biomass accumulation after 10-200 years of shifting cultivation in Bornean rain forest. Ecology, 86, no. 1: 36-33.
MacDicken, K.G., 1997. A Guide to Monitoring Carbon Storage in Forestry and Agroforestry Projects. Winrock International Institute.
Pearson, T., Walker, S.M., Brown, S., 2005. Sourcebook for Land Use, Land Use Change, and Forestry Projects. BioCarbon Fund, Winrock International.
RSPO Working Group on Greenhouse Gases, 2009. Greenhouse Gas Emissions from Palm Oil Production. Brinkmann Consultancy.
Solichin, M., Lingenfelder, M., Steinmann, K.H., 2011. Tier 3 Biomass Assessment for Baseline Emission in Merang Peat Swamp Forest. Workshop on Tropical Wetland Ecosystems of Indonesia: Science Needs to Address Climate Change Adaptation and Mitigation. Denpasar, Bali, Indonesia.
Van Noordwijk, M., Dewi, S., Khasanah, N., Ekadinata, A., Rahayu, S., Caliman, J-P., Sharma, M., Suharto, R., 2012. Estimating carbon footprint from biofuel production from oil palm: methodology and results from 2 pilot areas in Indonesia. Paper presented at International Conference on Oil Palm and the Environment (ICOPE) 2010. 23-25 February 2010. Bali, Indonesia.
Wilcove, D.S. and Koh, L.P., 2010. Addressing the threats to biodiversity from oil-palm agriculture. Biodiversity Conservation, 19: 999-1007.
Appendix 1
Process undertaken in stratification and analysis
a) Unsupervised classification, post stratification (first fieldwork - PT KPC)
PT KPC was stratified into 16 strata through an unsupervised classification based on the quantile methodology
using the Image Processing Software. This pre-stratified map was used to provide information on the diversity
of land cover within the concession area. The 16 strata were ranked from dense vegetation to open land. We
started with unsupervised classification to test if we could have an automated method, and thus reduce the
potential for subjectivity.
After the fieldwork at PT KPC was completed, the data was verified to remove anomalous plots and the
carbon content for the different strata was estimated from extrapolated plot data. The results showed a
trend where the estimated carbon content decreases as the strata move from dense vegetation to open
land,