RIP CURRENTS SIGNATURES ZONE DETECTION
ON ALOS PALSAR IMAGE AT PARANGTRITIS BEACH, INDONESIA
Arry Retnowati [email protected]
Research Center for Disaster, Universitas Gadjah Mada
Muh Aris Marfai [email protected]
Faculty of Geography, Universitas Gadjah Mada
J.T. Sri Sumantyo [email protected]
Center for Environmental Remote Sensing, Chiba University
ABSTRACT
Having bay and gulf morphology as cresentic beach, Parangtritis coast has been known po-tentially threat by rip currents hazard. This study aims to identify and detect breaking waves region and surf zone on ALOS PALSAR images, and identify and extract the cove shape shoreline morphology of Parangtritis beach. ALOS PALSAR Fine Beam Single (FBS) HH po-larization acquired on 2nd May 2007 and 17th June 2007, off nadir angle 34.3º, and in des-cending mode level 1.0 were utilized to derive amplitude information using Sigmasar. Shore-line morphology detection showed that the cusps system has not changed much during May to June 2007 when PALSAR images acquired, but might have shifted individually. The use of optical sensor with the same spatial resolution, ALOS AVNIR-2, supports to distinguish the boundary and determine the shoreline morphology of Parangtritis beach.
Keywords : ALOS PALSAR, breaking waves, rip currents, shoreline morphology, surf zone, Parangtritis, Indonesia
ABSTRAK
Sebagai pesisir dengan morfologi tanjung dan teluk yang merupakan cresentic beach, pesisir Parangtritis terkenal dengan ancaman bahaya rip currents. Penelitian ini bertujuan untuk mengidentifikasi breaking waves region dan surf zone menggunakan citra ALOS PALSAR, dan mengidentifikasi morfologi pesisir berupa cove shape shoreline di Pantai Parangtritis. ALOS PALSAR Fine Beam Sigle (FBS) HH polarization yang diperoleh pada tanggal 2 Mei 2007 dan 17 Juni 2007, dengan sudut nadir 34,3º dan mode descending level 1,0 telah digu-nakan untuk memperoleh informasi amplitudo menggudigu-nakan Sigmasar. Deteksi morfologi garis pantai menunjukan bahwa sistem cusps tidak berubah banyak pada Bulan Mei hingga Juni dimana PALSAR diperoleh, namun terjadi pergeseran pada masing-masing cusps. Pe-manfaatan sensor optis dengan resolusi spasial yang sama menggunakan ALOS AVNIR-2 mendukung dalam penarikan batas dan menentukan morfologi garis pantai di Pantai Pa-rangtritis.
Kata kunci : ALOS PALSAR, gelombang pecah, rip currents, morfologi garis pantai, surf zone, Parangtritis, Indonesia
Indonesian Journal of Geography, Vol 43, No.2, June 2012 : 12 - 27
INTRODUCTION
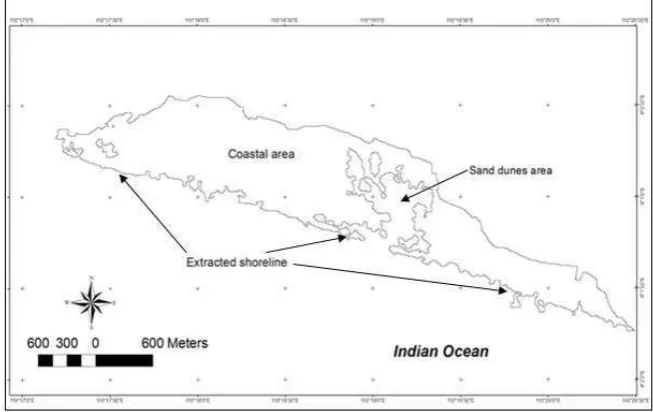
Coastal area is a dynamic system contains important natural environments. South Coastal Area of Bantul, Yogyakarta special region in Indonesia, has been known as iconic tourism area, yet also posses natural hazards. Parangtritis area is situated in two environments, namely coastal area with beach ridge landform filled with sand dunes, and beach area with beach cusps morphology (Figure 1). Potential threat of hazards and disasters in Parangtritis area are due to processes of complex physical and dynamic coastal area [Pusat Studi Bencana (PSBA), 2009]. Rip currents have been known as threat which drowned some visitors along Parangtritis coast. Despite of the fatalities, fishermen utilize the rips to sail out.
Processes of nearshore region, particularly coastal processes, are so complex. One of coastal process is wave breaking events. Nearshore circulation system consists of onshore flow, longshore currents, and rip currents. Fast flowing rip neck of rip currents extend through the surf zone, decelerating and expanding into rip head past the line of breakers [Brander and Short, 2000]. The surf zone is important in
forecasting rip currents potential
occurrence, in term of scientific and management, particularly risk reduction. Understanding the characteristics of Parangtritis beach nearshore phenomenon is considered important in planning and managing Parangtritis coastal area.
Figure1. Parangtritis Coastal Area (Google earth view 2006)
Study of wave breaking events location and frequency in shallow water is interesting since these phenomenons are preponderant forcing mechanism for
several nearshore region processes [Haller
and Lyzenga, 2003]. Nearshore water
regions generate widely fine range of surface signature observable by Synthetic
Aperture Radar (SAR) sensor. Remote
RIP CURRENTS SIGNATURES Arry Retnowati, Muh Aris Marfai and J.T. Sri Sumantyo
et al. 2006 and Wackerman and Colon, 2004], though this study were conducted in small area.
Many observations have been done for rip currents measurements, in statistical modeling, field observation, and remote sensing application. However, field survey and in-situ measurement of Rip currents still remains a challenging observation. Identifying breaking waves and surf zone is only one of complex observations and study need to be conducted to understand the dynamic complex of nearshore and
beach behavior [Haller and Lyzenga,
2003, and Teodoro, et al. 2009] in
particular rip currents phenomenon. Incoming breaking waves direction angle will affect the angle of rip currents events along the coast [Sukirman, 2003].
Breaking waves and surf zone, and shoreline morphology are considered as signatures of rip currents occurrence along Parangtritis beach (Figure 2) in this study.
Shoreline changes or movement
assessment due to accretion and or erosion is important for coastal zone management, either in scientific or management objectives. Nearshore physical processes, in particular rip currents, can be studied by identifying the signatures on airborne or spaceborne satellite images. Coastal processes can not be registered directly due to temporal discrete characteristic of
remotely sensed data [Wieneke, 1991].
This study tried to optimize ALOS
PALSAR spaceborne satellite images to identify and assess coastal process and its signatures.
Figure 2. Rip Current Mechanism at Parangtritis Beach [Sukirman, 2003]
THE METHODS
Research Area
This study was conducted in Parangtritis coastal area which lied between 7º59'14" - 8º1'45" S and 110º16'40" - 110º20'22". Parangtritis coastal area is administratively located in the area of Parangtritis Village, Kretek sub-district, Bantul District,
Indonesian Journal of Geography, Vol 44, No. 1, June 2012 : 12 - 27
Figure 3. Administration Map of Parangtritis Village
Topographicaly, Parangtritis village range between 0 – 35 meter, particularly in the southern part which adjacent to sea. The hills at Northeast reach range height
between 175 – 350 meter [Pujotomo,
2009]. Based on the 25-year-monthly rainfall, this area is included in the tropical wet or dry savanna climate (Aw) in the Köppen climate classification system.
Verstappen [1983] stated that the east wind direction in this area is close to 3250NE [PSBA, 2009]. Geographically, Parangtritis village area boundary is limited by coastal alluvial plain Northward, escarpment Eastward, Indian Ocean Southward, and Opak River Westward.
Data sets
This paper presented rip currents zone signatures identification at Parangtritis beach, namely breaking waves region and surf zone and shoreline morphology. Two
scenes of ALOS PALSAR data level 1.0
(raw data) were utilized in this study. The two scenes are in operational mode of Fine
Beam Single (FBS) HH polarization,
acquired on 2nd May and 17th June 2007,
off nadir angle 34.3º, and in descending
mode. PALSAR satellite image is a
grayscale image, thus consist data matrix which values represent intensities within range 0 – 255 in this study. These images data consist of phase and amplitude information. In pre-processing step, intensity image processing and geo-coding were conducted to derive the information needed. These processes were utilizing
Sigmasar software developed by Shimada
[1999].
Result from intensity image processing
then geo-coded, thus we got PALSAR
images level 1.5. In the processing step, edge detection operator was then applied to identify breaking waves region and surf zone based on the backscattering response reflected on the images. Regioning the breaking waves and surf zone was conducted on MatLab command. The extraction of shoreline morphology was
conducted on ENVI and ArcGIS software.
RIP CURRENTS SIGNATURES Arry Retnowati, Muh Aris Marfai and J.T. Sri Sumantyo
Figure 4. Shoreline morphology extraction procedure
Numerous studies on rip currents based on the mechanisms, namely wave and
structural interaction, have been
conducted. This study conducted mainly
on optimizing PALSAR images to identify,
detect breaking waves and surf zone. The signature of rip currents reflected on the shoreline morphology is considered as parameter along Parangtritis beach as cresentic cuspate beach. This research is considered as preliminary study on dynamic Parangtritis’s beach rip currents. The result can be validated by using
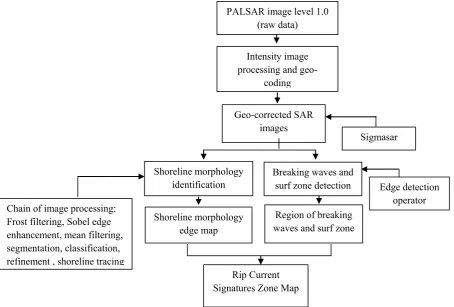
bathymetry data, tidal waves data, and observatory or fieldwork checking, also comparison with previous researches executing the same objects in the same time record. This study might support other research related to rip currents process as coastal hazard, particularly planning and managing coastal area due to risk reduction.Flowchart of this study can be seen in Figure 5.
Figure 5. Flowchart study
Edge detection operator Shoreline morphology
identification
Sigmasar
Chain of image processing: Frost filtering, Sobel edge enhancement, mean filtering, segmentation, classification, refinement , shoreline tracing
Shoreline morphology edge map
Breaking waves and surf zone detection
Region of breaking waves and surf zone
Rip Current Signatures Zone Map
PALSAR image level 1.0 (raw data)
Intensity image processing and
geo-coding
Geo-corrected SAR images Geo-correction of
PALSAR image (level 1.5) Speckle filtering (Frost)
Edge enhancement
(Sobel operator) occurrence (Mean Texture
filtering)
Contour tracing
Indonesian Journal of Geography, Vol 44, No. 1, June 2012 : 12 - 27
RESULTS AND DISCUSSION
Intensity Image Processing and geo-coded Images
SAR imaging process is coherent. SAR
method termed referring to the concept of creating the effect of a very long antenna by signal analysis [Cumming, et al. 2005].
PALSAR raw data were evaluated mainly in the initial calibration phase and exhibit
good characteristics [Shimada, et al.
2009]. Several techniques have been
developed and applied for SAR images
based on the characteristics of RADAR, including multi-looks processing. Ampli-tude information from raw data was first processed to derive study area. Run 4 times multi-look processing to reduce speckle noise, thus the dynamic process of wave breaking which continuously occur onshore can be identified.
Figure 6. Study Area (A) and Study Area Derived from Raw Data in Intensity Image Processing (B)
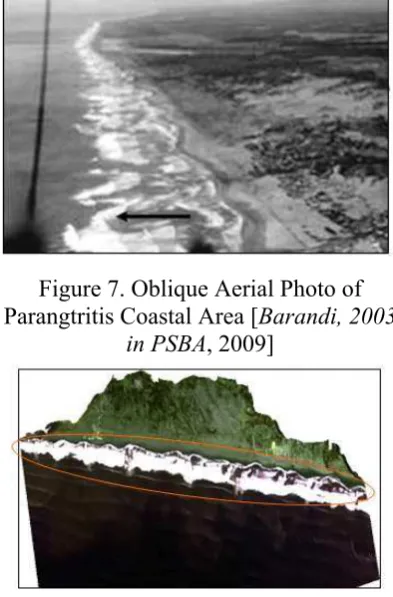
Result from intensity image and geo-code processing is shown in Figure 6. Figure 6 (a) shows most of Parangtritis village where this study conducted. To specify targeted region, the whole scene was cropped particularly at Parangtritis coast and nearshore region (Figure 6b). Nearshore region where breaking waves and surf zone identified are visually shown in Figure 7 and Figure 8.
The arrow in Figure 7 and ellipse on Figure 8 show breaking waves and surf zone where rip currents usually generate and occur. Those figures are optic images utilized here as comparison to L-band microwave. The optical images were taken different years, so they are employed here to help visualizing the region of breaking waves and surf zone.
Figure 7. Oblique Aerial Photo of
Parangtritis Coastal Area [Barandi, 2003
inPSBA, 2009]
Figure 8. Breaking waves and surf zone on AVNIR-2 acquired on 17th June 2008
RIP CURRENTS SIGNATURES Arry Retnowati, Muh. Aris Marfai and J.T. Sri Sumantyo
The whitewater breaking waves signatures are compared to radar backscatter from active breaking regions, as also modeling experiment conducted by Theodoro et al. [2009]. The backscatter increase due to high turbulent rough nearshore water region processes and reflected on the surface pattern when the waves break. Ripples and plumes reflect on the
backscattering [ERSDAC, 2006], due to
roughness of nearshore water region that increase amplitude of the small-scale waves within breaking regions and implied bright radar cross section for breaking
regions [Wackerman and Colon, 2004].
Breaking waves and surf zone in Parangtritis coast located within range 100 m – 300 m. Most of the mass travels to the shoreline and creates currents after break on the shoreline, when waves reach the
breaker zone. Longshore currents
occurrence will generate rip currents. Cove shape shoreline is commonly occurrence location of rip currents. Thus, cove shoreline morphology is considered important to extract as on of rip currents
signatures zone detection from PALSAR
image.
Edge Detection
Radar in remote sensing carries its own
illumination. Illumination changes
contribute to increasing of images intensity changes [Zhenjun and Jianshe, 2000]. In Synthetic Aperture Radar, scene with no texture an edge can be defined as an abrupt change in the reflectivity [Fjortoft, et al. 1999]. This study tried to apply optimum smoothing filter and detect intensity changes at given scale spatial resolution to detect changes of the images reflecting the breaking waves and surf zone due to local luminance change [Zhenjun and Jianshe,
2000, and Grigorescu, et al. 2004]. Apply
edge detection operator to detect intensity changes of the object with strong intensity contrasts from one pixel to the next [Green, 2002].
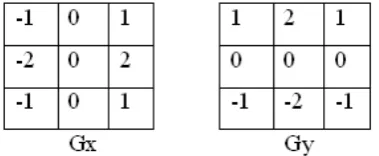
Edge detectors were designed to detect changes or discontinuities in image features to be as close as possible to real edges and good noise rejection property [Sirin, et al. 2005, and Liu and Jezek, 2004], in which SAR images suffer from. This study applied Sobel edge detection operator, performing 2-D spatial gradient measurement on the image refer to equation (1) and equation (2). The actual Sobel edge detector uses a pair of 3 × 3 convolution mask (Figure 9).
Figure. 9. Convolution kernel on 3 × 3
Equation of gradient magnitude
calculation:
Result from applying Sobel edge detection
operator and Gaussian filter on PALSAR
Indonesian Journal of Geography, Vol 44, No. 1, June 2012 : 12 - 27
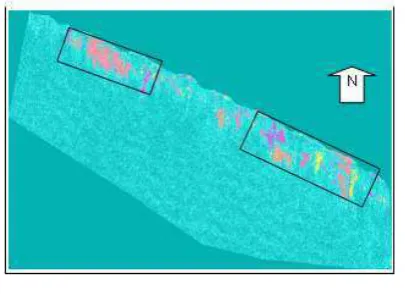
Figure 10. Image acquired on 2nd May
2007
Figure 11. Image acquired on 17th June 2007
Different color shown in Figure 10 and Figure 11 represent varied digital number (DN) of each pixel as processed using edge detector and help visualizing the result. The color did not represent any specific value, but randomly clustered. From the figures, we can see the occurrence of
breaking waves events are mostly located at Eastern part of Parangtritis coast.
Shoreline morphology extraction
Monitoring of the coastal morphology from space borne images is one of interesting field of shoreline extraction study. Shoreline morphology which has a cove form is the mark of the location where rip currents occur generally, because in the cove, the energy of the longshore current and the energy of the breaker are accumulated and released back to the sea through a focused channel. The orientation of the shoreline and the angle of incoming waves are key features to note when assessing the potential for rip currents formation at a particular beach. Parangtritis coastal area has cresentic beach type which usually reflected on the bay and cusps form alternately. This beach morphology tried to be extracted from
PALSAR intensity image processing data. Reference shoreline was used to compare the morphology of the bays and cusps of Parangtritis beach (Figure 12). Result of shoreline morphology extraction can be seen on Figures 13 and Figure 14.
RIP CURRENTS SIGNATURES Arry Retnowati, Muh. Aris Marfai and J.T. Sri Sumantyo
Figure 13. Shoreline morphology extraction from PALSAR image acquired 2nd May 2007
Figure 14. Shoreline morphology extraction from PALSAR image acquired 17th June 2007
In this chapter, application of ALOS
PALSAR and ALOS AVNIR-2 on regioning breaking waves and surf zone, and shoreline extraction will be discussed. Comparison between microwave sensor (PALSAR) and optic sensor (AVNIR-2) to observe rip currents as nearshore phenomenon will be presented here.
Breaking waves and Surf Zone Regioning
Rip currents extend through the surf zone, decelerating and expanding into rip head
past the line of breakers [Brander and Short, 2000]. The circles show possibility of rip currents occurrence (Figure 15). This would require ground check as
validation in the same time as PALSAR
images taken. Quantitative field
Indonesian Journal of Geography, Vol 44, No. 1, June 2012 : 12 - 27
Figure 15. Rip currents possibility of occurrence
Breaking waves and surf zones are commonly high velocity region which reflect on strong backscattering cross-section. Rips are best identified by looking for narrow and persistent dark gaps in the surf zone using optic remote sensing regarding on the spatial resolution as well. Rough surface area has strong backscatter strength and consequently the areas are shown brighter than the other areas. Darker areas have weak backscattering strength and show smooth surface against
microwaves. Due to PALSAR
characteristics, rip currents will be seen darker than surrounding in contrast to high backscatter of breaking waves, instead of brighter image from neighboring objects
(Figure 15b), as also stated in Joseph
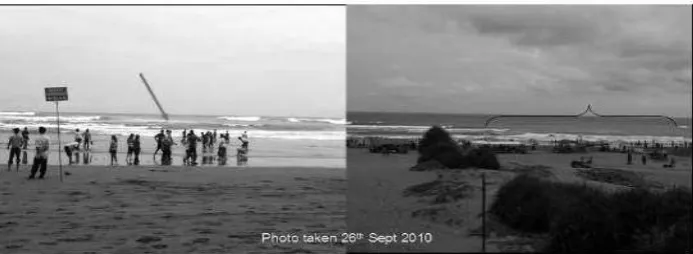
[1993]. To prove that Rip currents occurrence indeed show darker areas, field
observation was conducted on 26th
September 2010. Rip currents can be identified by observing the currents which heading to the sea and cutting the breaker zone which will create a gap, no wave breaking process in this zone (Figure 16).
Figure 16. Rip currents appearance
Synthetic Aperture Radar (SAR) can be complementary to optical satellite images in coastal monitoring. As stated in da
Silva, et al. [2006], and Wackerman and Colon [2004], some studies have achieved success in observing nearshore water
regions surface signatures using SAR,
acquire breaking waves signatures. Breaking waves and surf zone reflect changes of bathymetry. Rip flows commonly within distinct topographic
channel. Bottom morphology of
Parangtritis coast would encourage the validation of rip tunnel.
Shoreline Morphology Extraction
Boundary detection is what shoreline
detection mostly dealing with.
RIP CURRENTS SIGNATURES Arry Retnowati, Muh. Aris Marfai and J.T. Sri Sumantyo
obstructs interpretation process. Shoreline detection obstacle of PALSAR images in this study was defining the exact shape boundary between land and sea due to dynamic process of Parangtritis coast which affected by Indian Ocean and the weather. Shoreline morphology is considered important to monitor in which reflected nearshore dynamic processes, particularly rip currents signatures along Parangtritis cresentic beach.
The precise position and shape of the shoreline needed in this study was preserved using edge-preserving operator to remove the image noise. The Lee filter, Frost filter, Kuan filter, Median filter, and Gamma Maximum a Posteriori filter can
impulse response of the SAR system and it
averages less in the edge areas to preserve the edge [Sheng, 1996]. Frost filter was promising shown good result to reduce the speckle in this study compare to Lee filter to proceed edge enhancement on Sobel low-pass convolution. The texture occurrence then being smooth using mean filtering, to reduce the amount of intensity variation between one pixel and the next. segmentation process to determine the classes or cluster based on grey scale values. To define boundary between land and sea, parallelepiped classification and
majority post-classification were
conducted to extract the shoreline.
This study applied edged-based methods which tried to identify the transitions between different regions as stated in [Fjortoft, 1999]. Some locations which are
actually sea, due to sediment transport of nearshore circulation, reflected same gray
scale digital number (DN) on the PALSAR
images. This affected shoreline
morphology extraction which based on the
DN (Figure 15 and 16). The boundary
between the land and sea could hardly justify due to the same value of DN.
Kernel operation used in this image processing is 3 x 3. The larger the Kernel size applied, the smoother effect on SAR
images. However, this might reduce some information which intentionally derived from. The choice of kernel size is a compromise between a desired noise reduction and keeping the image sharpness. Thus, this study applied 3 x 3 Kernel size aimed to suppress the noise whilst preserving the edges regarding on rip currents assessment on shoreline morphology. Illuminated object on
PALSAR images might have recorded on same digital number which in a way affected segmentation and classification. The result of shoreline morphology extraction as seen in Figure 17 mostly affected by signal return from the sea and land area, related to L-band characteristic. Inadequate contrast and speckle effect generated by coherent signal-scattering complicated the shoreline detection
obstacle as also stated by Lee and
Jurkevich, [1990].
Shoreline morphology extraction of 2nd
May and 17th June 2007 PALSAR image in
Figure 17 shows some changes or shifting at some location, but not wide enough spatially (see the circles). During time
period when PALSAR images acquired on
May – June, the wind blown from Indian Ocean at the same direction within ten months and wider fetch as stated in
Gingele, et al. [2002]. High wave from Indian Ocean might affect nearshore processes at Parangtritis coast.
Indonesian Journal of Geography, Vol 44, No. 1, June 2012 : 12 - 27
upcoming waves and winds from the ocean to the land, and in tropical areas rip currents are also influenced by the season. Some field observations have been conducted related to Parangtritis’s rip currents phenomenon and proved that mechanism of wind and waves affected the Rips [Sukirman, 2003, PSBA, 2009, and
Susmayadi, 2010].
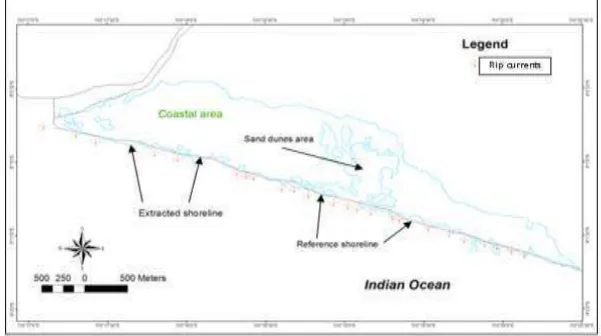
Spatial and temporal resolution of
PALSAR images, Reference shoreline, and rip currents position shown in Figure 18 and 19 are different. These figures were shown only to give visualization possibility of Rip currents occurrence based on the cove of cuspate of Parangtritis cresentic beach.
Figure 17. Shoreline extraction of 2nd May and 17th June 2007 PALSAR images
Figure 18. Shoreline extraction of 2nd May PALSAR on Reference Shoreline 1999 and Rip
RIP CURRENTS SIGNATURES Arry Retnowati, Muh. Aris Marfai and J.T. Sri Sumantyo
Figure 19. Shoreline extraction of 17th June PALSAR on Reference Shoreline 1999 and Rip
Currents Occurrence 2006
ALOS Advanced Visible and Near Infrared Radiometer type-2 (AVNIR-2) for Regioning Breaking Waves and Surf Zone and Shoreline Morphology Detection
The contrast between sea and land can be identified and distinguished visually and directly from optical images with spatial
resolution like AVNIR-2. The challenge is
to extract the same subject using the same approach as applied on SAR images. The
sea in SAR is likely more homogeneous in
grey level than the land, while on optical images the difference is so distinct.
Breaking waves and surf zone
identification and regioning on AVNIR-2
was conducted based on pixel value.
Image processing which conducted on rip currents signatures zone detection using
ALOS PALSAR and AVNIR-2, is one of step to further analyze the vulnerability and risk of coastal area due to natural hazards. Shoreline morphology which
derived from PALSAR image indicating
nearshore dynamic process in the east, sand dune area, and the middle-west along
Parangtritis beach. AVNIR-2 data
extraction to determine the wave breaking region and surf zone associated with rip currents reveals that indeed the rips follow the shoreline morphology distribution pattern that forms a cove (Figures 20 and Figure 21).
Figure 20. Surf zone and Wave breaking region associated with Rip Currents (arrows) on 17th
Indonesian Journal of Geography, Vol 44, No. 1, June 2012 : 12 - 27
The movement of rip currents locations in Parangtritis beach is usually in line with the movement of the cove and headland morphology formed in the shoreline. Figure 21 presents breaking wave region and surf zone associated with Rip currents (arrows) occurrences on 17th June 2008
considered final result of this study which is rip currents signatures zone detection on
ALOS sensor, PALSAR and AVNIR-2
respectively.
This study is considered as preliminary research in using ALOS PALSAR and AVNIR-2 for assessing nearshore region dynamic processes, such as rip current, breaking waves, and shoreline changes. Further validation is the next step to be developed.
Figure 21. Breaking wave region and Surf Zone associated with Rip currents (arrows) on
June 2008 AVNIR-2 image and June 2007 PALSAR image
CONCLUSION
Breaking waves and surfing zone reflect dynamic complex nearshore water region processes. Edge detection operator applied to identify waves breaking region and surf zone shown promising result. Dark patch breaking high backscatter pattern indicates
rip current signatures occurrence.
However, waves breaking were not individually identified, but clustered in the surf zone. This study applied 3 × 3 moving window or kernel which considered as the optimum size due to 10 meters spatial
resolution of PALSAR and AVNIR-2
respectively.
Chain of image processing to extract shoreline morphology still possible to be enhanced further more to get detail
shoreline morphology extraction result. Edge detection and speckle filtering algorithm applied in this study are part of image enhancement, particularly the use spatial filters. Extraction shows that the cusps system has not changed much within one month, but might shifted individually (spatially shown from the images). The direction and intensity of rip currents might be different and this can be justified
by exploring optical sensor, like AVNIR-2
which has same spatial and temporal resolution with PALSAR.
ACKNOWLEDGMENT
RIP CURRENTS SIGNATURES Arry Retnowati, Muh. Aris Marfai and J.T. Sri Sumantyo
International Cooperation, General
Secretariat, Ministry of Education and Culture Indonesia for the opportunity of the research in Center for Environmental
Remote Sensing (CEReS) Chiba
University Japan and Master Program in Planning and Management of Coastal Area and Watershed, Gadjah Mada University. Thanks to Prof. Dr. F. Nishio for the Morphodynamics of a large-scale rip
current system at Muriwai Beach, New
Zealand, Mar. Geol. (165)27–39.
Cumming, I.G, and F.H. Wang, (2005),
Digital processing of synthetic aperture radar data; Algorithm and Implementation, Artech House, Inc., Norwood, MA.
da Silva, C.B. Jose, F. Sancho, and L. Quaresma (2006), Observation of rip currents by synthetic aperture radar (Published Conference Proceeding Sytle) in Proceeding of SEASAR,
Advances in SAR Oceanography from ENVISAT and ERS missions, ESA publication SP-613, Franscati.
Earth Remote Sensing Data Analysis
Center (ERSDAC) (2006), PALSAR
reference guide, 3rd edition.
Fjortoft, R, A. Lopes, J. Bruniquel, and P. Marthon (1999), Optimal edge detection and edge localization in complex SAR images with correlated
speckle, IEEE Trans, Geoscience and
Remote Sensing, 37(5) 2272 – 2281.
Gingele, X. Franz, Girault, A. Patrick De Deckker, and Guichard, François. (2002), History of the South Java
Current over the past 80 ka.
Palaeogeography, Palaeoclimatology, Palaeoecology 183(3-4), 247-260.
Green, B. “Edge Detection Tutorial”
(2002), Available (URL):
http://www.pages.drexel.edu/~weg22/r aster.html.
Grigorescu, C, N. Petkov, M.A. Westenberg, (2004), Contour and boundary detection improved by surround suppression of texture edges,
Image and Vision Computing, (22)609 – 622.
Haller, M.C, and D.R. Lyzenga, (2003), Comparison of radar and video observation of shallow water breaking
waves. IEEE Trans. Geoscience and
Remote Sensing, 41(4), 832-844.
Joseph, A.K. (1993), Instrumentation for coastal zone management. Available (URL):http://drs.nio.org/drs/bitstream/ 2264/2818/2/Trg_Course_Coast_Zone _Manage_1993_91.pdf.
Lee, J.S, andI.Jurkevich (1990), Coastline detection and tracing in SAR images.
IEEE Trans. Geoscience and Remote Sensing, 28(4),662-668.
Liu, H, and K.C. Jezek (2004), Automated extraction of coastline from satellite imagery by integrating Canny edge
detection and locally adaptive
thresholding, International Journal
Remote Sensing, 25(5) 937 – 958.
Pujotomo, M.S. (2009), Coastal Changes Assessment Using Multi Spasio-Temporal Data for Coastal Spatial
Planning Parangtritis Beach
Yogyakarta Indonesia. Thesis. Gadjah Mada University, Yogyakarta and ITC.
Pusat Studi Bencana (PSBA) (2009), Multirisk Assessment of Disaster in
Parangtritis Coastal Area; a
Indonesian Journal of Geography, Vol 44, No. 1, June 2012 : 12 - 27
Public Awareness towards Various Events of Disaster (in Indonesian),
Penaksiran multirisiko bencana di wilayah kepesisiran Parangtritis, suatu analisis serbacakup untuk membangun kepedulian masyarakat terhadap berbagai kejadian bencana. Ed. Sunarto, A. M. Marfai, D. Mardiatno, reviewed by Sutikno and Lavigne, F. Research Center for Disaster Gadjah Mada University.
Sheng, Y, and Z.G. Xia (1996), A
Comprehensive Evaluation of Filters for Radar Suppression. IEEE.
Shimada, M. (1999), Verification pro-cessor for SAR calibration and interferometry, Adv. Space Res., 23(8), 1477-1486.
Shimada, M, O. Isoguchi, T. Tadono, and K. Isono (2009), Palsar radiometric and
geometric calibration, IEEE Trans.
Geoscience and Remote Sensing, 47 (12).
Sirin et al. (2005), Edge Detection in Multispectral Remote Sensing Images.
IEEE Xplore journal. Avalaible: http://ieeexplore.ieee.org/stamp/stamp.j sp?arnumber=01512625 (URL).
Sukirman, B. (2003), Rip current: features, location, and prediction of shifting cycles at Parangtritis coast Yogyakarta
Special Province (in Indonesia) Rip
Current: Ciri-ciri, Posisi, dan Prediksi Siklus Pergeserannya di Kawasan Pantai Parangtritis, Daerah Istimewa Yogyakarta. Undergraduate Thesis, Faculty of Geography, Gadjah Mada University, Yogyakarta.
Susmayadi, I Made (2010), Spatial and Temporal Analysis of Parangtritis
Beach Morphoynamic during 1976 – 2009 (in Indonesia) Analisis Spasial dan Temporal Morfodinamik Pantau Parangtritis tahun 1976 - 2009.
Postgraduate Thesis, Master
Programme in Management of the Coastal area and Watershed of Geography Faculty, Gadjah Mada University, Yogyakarta.
Teodoro, A.C, J. Pais-Barbosa, F.Veloso-Gomez, and F. Taveira-Pinto, (2009), Evaluation of beach hydromorpholo-gical behaviour and classification using image classification technique, Journal of Coastal Research, SP (56) 1607-1611.
Verstappen, H. Th. (1983), Applied
Geomorphology: Geomorphological
Surveys for Environmental
Development. Elsevier: Amsterdam.
Wackerman, C.C and Clemente-Colon, P. (2004), Wave refraction, breaking and other near-shore processes, in Jackson
and Apel, Synthetic Aperture Radar
Marine User’s Manual, U.S. Department of Commerce and NOAA, ch. (6)171 – 187.
Wieneke, F. (1991), The use of remote
Sensing in Coastal Research.
GeoJournal, 24(1)74 – 76.
Zaart, El A, D. Ziou, S.Wang, and Q. Jiang (2002), Segmentation of SAR
images. Pattern Recognition Society
Journal, (35)713 – 724.
Zhenjun, T. and S. Jianshe (2000), A multi-scale morphological approach to
SAR image edge detection, Journal of
Electronic, 17(3).
![Figure 2. Rip Current Mechanism at Parangtritis Beach [Sukirman, 2003]](https://thumb-ap.123doks.com/thumbv2/123dok/853999.815507/3.595.182.424.371.502/figure-rip-current-mechanism-parangtritis-beach-sukirman.webp)