Frost tolerance and bud dormancy of container-grown yellow
birch, red oak and sugar maple seedlings
SOPHIE CALMÉ,1 FRANCINE J. BIGRAS,2 HANK A. MARGOLIS1 and
CAROLE HÉBERT2
1 Centre de recherche en biologie forestière, Université Laval, Sainte-Foy, Quebec G1K 7P4, Canada 2 Natural Resources Canada, Canadian Forest Service--Quebec Region, P.O. Box 3800, Sainte-Foy,
Quebec G1V 4C7, Canada
Received December 14, 1993
Summary
Container-grown seedlings of red oak (Quercus rubra L.), sugar maple (Acer saccharum Marsh.) and yellow birch (Betula alleghaniensis Britton) in their first year of growth were overwintered outdoors. Tolerance of roots and stems to freezing were compared from late summer to the following spring. Mitotic activity in the apical bud was related more closely to air temperature than to bud dormancy as defined by days-to-bud-break. In all species, stem hardening was observed before days-to-bud-break reached a maximum. Dormancy release (days-to-bud-break equal to zero) of yellow birch coincided with loss of stem hardening in the spring. Roots hardened more slowly, had a lower frost tolerance than stems in fall and winter, and dehardened earlier than stems in the spring. There were differences in stem and root hardiness among the species, with yellow birch being the most tolerant, followed by sugar maple and red oak. Primarily because of root sensitivity to frost, winter was a critical period for all three species, but particularly for red oak.
Keywords: Quercus rubra, Betula alleghaniensis, Acer saccharum, root, shoot, bud break, mitotic fre-quency.
Introduction
In 1993, red oak (Quercus rubra L.), sugar maple (Acer saccharum Marsh.) and yellow birch (Betula alleghaniensis Britton) represented 90% of the production of hardwood seedlings in Quebec (G. Couture, personal communication). Because these species are at the northern limit of their distribution in Quebec, their frost tolerance is likely to be a key determinant in their ability to survive in both the nursery and the plantation.
et al. 1980, Carlson 1985, Colombo et al. 1989, Fielder and Owens 1989, Cannell et al. 1990, Kainer et al. 1991, Williams and South 1992). Several authors have found a difference in the patterns of development of bud dormancy and mitotic activity (Lavender 1985, Kainer et al. 1991), and some have even concluded that no direct relationship exists between these two variables in the terminal bud (Cannell et al. 1990, Williams and South 1992).
The objectives of this study were to compare yellow birch, sugar maple and red oak with respect to (i) frost tolerance of shoots and roots from late summer to spring, (ii) timing of bud set, and (iii) changes in mitotic frequency and days-to-bud-break that occur following apical bud formation.
Materials and methods
Seedling production
Yellow birch seeds (YB) (provenance: 46°30′ N, 78°50′ W) were sown on March 26, 1992, in Styroblock 20 containers (45 cavities per container, 340 cm3 per cavity; Beaver Plastic Ltd., Edmonton, Alberta). Sugar maple (SM) (provenance: 46°08′ N, 70°38′ W) and red oak seeds (RO) (provenance: 45 °38′ N, 73 °15′ W) were sown in Ventblock 28 containers (28 cavities per container, 340 cm3 per cavity; Beaver Plastic Ltd.). The substrates were a 2/1 (v/v) mix of peat moss/vermiculite for yellow birch and red oak, and a 4/1/1 (v/v) mix of peat moss/sand/vermiculite for sugar maple. Seedlings were grown according to the cultural conditions used at the provincial nursery in Berthier, Quebec (46°06′ N, 71°34′ W), in plastic-covered greenhouses with irrigation and fertilization provided automatically. The plastic covers were removed from the greenhouses in mid-July. On August 4, 1992, the seedlings were transferred to the Laurentian Forestry Centre, Sainte-Foy, Quebec, repotted in Sty-roblock® 20 containers and kept outdoors. Seedlings were irrigated when necessary and fertilized individually with soluble commercial preparations every second week, following the schedule of the provincial nursery. Fertilization stopped on September 21, at which time it totaled 84.4 mg N, 23.6 mg P and 46.5 mg K per seedling for yellow birch, 181.8 mg N, 36.2 mg P and 91.2 mg K for red oak, and 180.1 mg N, 33.0 mg P and 91.4 mg K for sugar maple. Morphological characteristics measured at the end of August are presented in Table 1. During the course of the experiment at the Laurentian Forestry Centre, substrate temperatures (in the center and at a depth
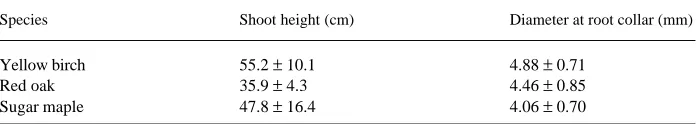
Table 1. Average (± standard error) shoot height and root collar diameter as measured at the beginning of the experiment (August 26) by species (n = 60).
Species Shoot height (cm) Diameter at root collar (mm)
Yellow birch 55.2 ± 10.1 4.88 ± 0.71
Red oak 35.9 ± 4.3 4.46 ± 0.85
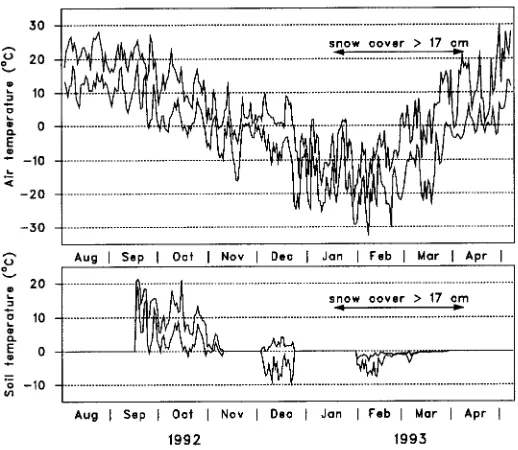
of one-third of the cavity) and air temperatures (30 cm above the containers) were recorded on an hourly basis with copper constantan thermocouples connected to a data logger (model CR10, Campbell Scientific Inc., Logan, Utah).
Freezing tests and viability tests
In winter, the seedlings were thawed in a cold room at 4 °C until the substrate was free of ice. The root systems of whole seedlings were gently washed under tap water to remove the substrate. Once the roots had been washed, the seedlings were individually put in black plastic bags and placed in modified programmable freezers. Controls were placed in a cold room at 4 °C. Freezer temperature was maintained at 2 °C for about 6 h, and then decreased at a rate of 3 °C h−1, with a 1-h plateau following each 3 °C drop in temperature. Temperatures were recorded in the bags with copper constantan thermocouples connected to a data logger (model 21X, Campbell Scientific Inc., Logan, Utah). The real temperatures obtained for each step of the test, i.e., each drop--plateau sequence, were calculated as the mean of the 20 coldest minutes recorded, and thus differed from test to test.
Seedlings were sampled at the end of each step and immediately placed in a cold room at 4 °C for 14 days. Freezing damage to roots was then evaluated. Excised roots, cut just above the primary lateral roots, were examined under a stereo microscope, and dead roots were removed with dissecting forceps and a razor blade. Primary dead roots were identified by the brown color of the cambial zone; fine dead roots exhibited a translucent and mushy cortex. Remaining roots were dried in a forced-air oven at 75 °C for 24 h and then weighed. The basal end of each shoot was placed in a 22 × 175 mm test tube filled with water and kept in a climate chamber at 24.4 ± 0.7 °C in a 16-h photoperiod with a photon flux density of 360 µmol m−2 s−1 (photosyn-thetically active radiation, PAR, 400--700 nm) for 6 days. Brown discolored phloem and cambium were observed by cutting the shoots lengthwise with a razor blade. The percentage of damage was determined by dividing the length of brown phloem and cambium by the total shoot length.
Bud set
Apical bud formation was monitored during the fall. Buds were considered to be formed when scales were entirely closed. Bud formation was considered complete when about 80% of the seedlings had set terminal buds. Measurements of days-to-bud-break (DBB) and mitotic frequency were begun on October 19.
Days-to-bud-break
Mitotic frequency
Excised apical buds were put in McClintock’s fixative (ethanol/acetic acid, 3/1, v/v) (Johansen 1940) for at least 7 days. Longitudinal sections were then cut with a razor blade while the bud was held in position in an elder core bit. Sections were placed in Warmke’s solution (95% ethanol/5% HCl, v/v) (Johansen 1940) for 20 min to remove pectins from the middle lamella, and then in Carnoy’s solution (ethanol/ace-tic acid/chloroform, 6/1/3, v/v) (Johansen 1940) for another 20 min to halt cell wall softening. Sections were stained with 0.5% orcein in 45% acetic acid (w/v) for 20 min. Bud scales were then removed and sections were placed on a covered slide and slightly warmed over a flame for about 3 min. Sections were observed under a microscope at 400 × magnification. The mitotic frequency was the number of dividing cells, as identified by the presence of chromosomes in prophase, metaphase, anaphase and telophase, per unit of surface, i.e., per field of observation in the microscope. Observations were made on three to seven sections. For sectioned samples, mitotic frequency gives results that are similar to those obtained with mitotic index (Owens and Molder 1973). However, unlike mitotic index, mitotic frequency does not require a complete cell count and, for this logistical reason, it was chosen as the measure of mitosis in this study.
Experimental design and statistical analyses
The experimental design was a split plot with 14 Styroblocks (whole plots) com-pletely randomized within each of the four blocks. Each Styroblock corresponded to one sampling date and contained the three species as subplots. Thus the experiment consisted of a total of 2520 seedlings, i.e., 4 blocks × 13 sampling dates × 3 species × 15 seedlings.
One seedling was sampled per block, date and species, for each variable except bud set, for which all 15 seedlings were observed. There were 13 sampling dates, but bud-related variables were observed only before or after bud set. The sampling dates were August 26, September 17, October 5, October 19, November 2, November 16 and December 7 in 1992, and January 11, February 1, March 1, March 29, April 26 and May 10 in 1993.
Results
Freezing tolerance
Red oak, and to a lesser extent sugar maple, were damaged by severe frosts at the end of December, because the seedlings, and particularly the root plugs, were not protected by snow cover (Figure 1). Consequently, subsequent data for freezing tolerance had to be discarded for these two species.
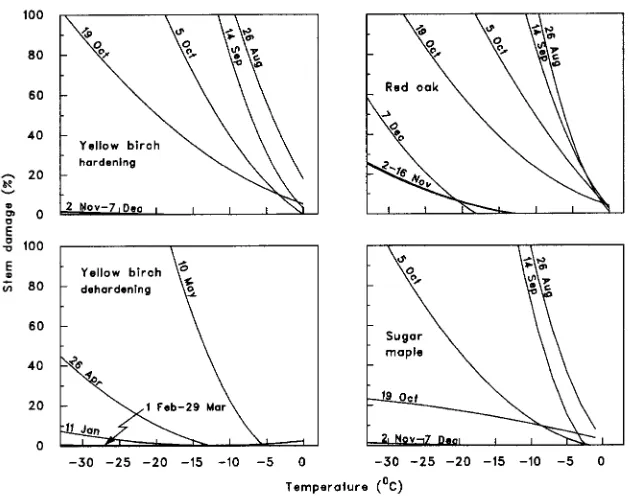
Shoot damage increased with decreasing temperature in a way that depended on sampling date (P ≤ 0.0001 for both interactions between linear and quadratic temperature effects and sampling date), but not on species (P > 0.05 for all interac-tions involving temperature and species, Table 2, Figure 2). In all three species, the highest shoot frost tolerance was reached on or after November 2 (Figure 2) when damage at −33 °C was at most 2% for yellow birch and sugar maple, and between 25 and 60% for red oak. Yellow birch stems remained deeply hardened until March 29, but had started to deharden by April 26 (Figure 2).
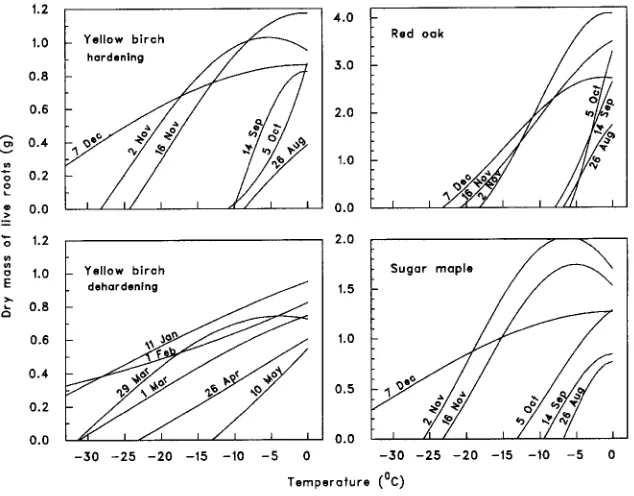
Live root dry mass decreased with decreasing temperature, and the shape of the relationship varied with both date and species (most interactions involving the linear or the quadratic component of the temperature effect were significant at the 5% level, Table 2, Figure 3). A 2.4- to 3.8-fold increase in root mass, depending on the species,
was observed from August 26 to November 2, indicating that roots continued to grow in the fall as long as the temperature of the growing medium was above 0 °C. Root
Table 2. Observed significance levels (P > F) associated with the analysis of covariance of freezing tolerance.
Source of variation Stem damage Live root dry mass
df P > F df P > F
Block (B) 3 0.0108 3 0.4878
Date (D) 12 0.3535 12 0.3363
B × D --1 35 0.0046
Species (S) 2 0.3171 2 0.0001
D × S 12 0.8499 11 0.9154
Temperature (T) 1 0.0001 1 0.0001
T qua 1 0.0001 1 0.0001
T × D 12 0.0001 12 0.0253
T qua × D 12 0.0001 12 0.3711
T × S 2 0.0696 2 0.0001
T qua × S 2 0.1541 2 0.0020
T × D × S 12 0.0622 11 0.0132
T qua × D × S 12 0.0635 11 0.0408
1 A dash appears where a sum of squares was pooled to obtain a new error term.
growth was visible as an increase in root volume and was probably associated with an accumulation of carbohydrates. Afterward, seedling root mass tended to decrease as freezing temperatures caused root mortality. Root hardening of the three species began between October 5 and November 2, when minimum temperatures became negative (Figure 3). Red oak roots reached a maximum tolerance at their last test on December 7, with a lethal temperature of −23 °C, whereas on the same date, some sugar maple root tissue remained alive at temperatures as low as −33 °C (Figure 3). At least one third of the root tissue remained alive in yellow birch at the minimum test temperature (about −33 °C) between December 7 and February 1. Yellow birch roots dehardened slowly from March 1 onward (Figure 3).
In all three species, shoots hardened more rapidly than roots. Hardening of the aerial parts started on October 5 and reached a maximum on November 2, whereas the root systems hardened on and after November 2, reaching their maximum on December 7. Shoots also became more frost tolerant than roots, with no stem damage at the lowest temperature tested (−33 °C) for yellow birch and sugar maple, whereas roots still suffered some damage at this temperature. For red oak, stem damage varied between 25 and 60% at −33 °C from November 2 until December 7, whereas all roots were killed between −18 and −23 °C at the same dates.
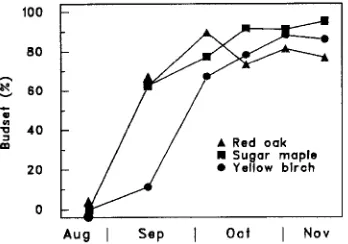
Bud set
Bud set varied with time according to species (P ≤ 0.0007 for the date × species interaction, Table 3, Figure 4), but never reached 100%. In yellow birch, bud set reached a maximum of around 90% on November 2, and sugar maple reached 98% on November 16. Red oak buds were 95% formed when a warm period in October caused another growth flush. Afterward, most of these seedlings did not set bud again, probably because of a drop in temperature.
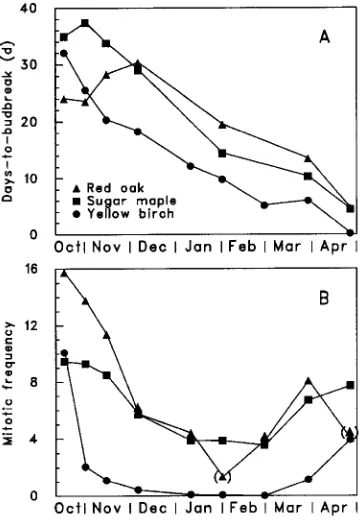
Days-to-bud-break
The time required for bud burst progressively decreased until the end of April, when buds broke naturally outdoors (P ≤ 0.0001 for the main effect of date, Table 3, Figure 5). The average time to bud break differed significantly among species (P ≤ 0.0001 for the main effect of species, Table 3, Figure 5), and the difference between any two species was constant over sampling dates (P = 0.1544 for the date × species interaction, Table 3, Figure 5).
Table 3. Observed significance levels (P > F) associated with the analysis of variance of bud set, days-to-bud-break and mitotic frequency.
Source of variation Bud set Days-to-bud-break Mitotic frequency
df P > F df P > F df P > F
Block (B) 3 0.6492 3 0.1715 3 0.8358
Date (D) 4 0.0001 8 0.0001 8 0.0001
B × D --1 -- 23 0.0483
Species 2 0.0003 2 0.0001 2 0.0001
D × S 8 0.0007 16 0.1544 16 0.1032
B × D × S -- -- 39 0.0001
1 A dash appears where a sum of squares was pooled to obtain a new error term.
Mitotic frequency
Mitotic frequency varied over time (P ≤ 0.0001 for the main effect of sampling date, Table 3, Figure 5) and among species (P ≤ 0.0001), but the three species exhibited similar developmental patterns (P = 0.1032 for the date × species interaction). The general trend was a decrease until January 11, with a minimum of zero dividing cells for yellow birch, and about four for sugar maple and red oak. After March 1, mitotic frequency began to increase until it could no longer be measured because buds had broken. It should be noted that for red oak, values for February 1 and May 10 may have been underestimated because buds in only two of the four blocks could be observed; the others had been damaged by frost previously. Because it is unlikely that cell mitotic activity continued once maximum temperatures had fallen below the freezing point, or that it resumed during the short time spans when temperatures were positive between January 11 and March 1 (Figure 1), results for all species are discussed assuming that mitotic frequency was constant for the January 11, Febru-ary 1 and March 1 tests.
Discussion
Freezing tolerance, as evaluated by artificial freezing tests, differed greatly between red oak and the two other species. Natural freezing damage confirmed this difference. Only a few (about 7%) red oak seedlings survived the winter outdoors. On the other hand, artificial freezing tests do not reflect all aspects of freezing tolerance. Thus, sugar maple and yellow birch, which appeared to be similar when tested in the freezer, did not suffer the same damage outdoors, showing about 50 and 100% survival, respectively, in the spring (data not shown). Because each artificial freezing test temperature was maintained for only 1 h and estimated as the 20 coldest minutes recorded, whereas outdoor frost can last many hours, freezing tolerance could be overestimated (Lindström 1986a). Some researchers have found that prolonging the exposure time to freezing conditions does increase damage (Levitt 1980, Zhurova and Patlai 1981 in Lindström 1986a), but others have detected no effect of freezing duration on tissue damage for up to 24 h (Levitt 1956, Lindström 1986b).
For both stems and roots, red oak was the least frost tolerant, followed by sugar maple and yellow birch. Another experiment on red oak and yellow birch seedlings of the same age and nursery of origin as the seedlings used in our experiment, conducted at the same location using the same freezing test method, showed similar results: stem frost tolerance (LT50) increased from −15 °C to −30 °C for yellow birch and from −15 °C to −20 °C for red oak between October 18 and November 1 (H. Margolis, unpublished data).
Stems of yellow birch were hardy until March 29, but had started to deharden by April 26. In contrast, roots began to deharden slowly as early as March 1, at which time the minimum temperature they were able to survive was about −31 °C. Earlier in February, the temperature in the containers had risen to a minimum of about −2 °C and a maximum of about −0.75 °C. Roots may have been sensitive to this increase, because the temperature of the substrate and frost tolerance paralleled each other for about two months.
Maximum rest (i.e., when DBB is at its maximum) indicates that a chilling requirement is needed for bud dormancy release. This occurred at least 49 to 67 days before the minimum bud mitotic activity. The difference in timing between maxi-mum rest and minimal apical cell division varies with species, provenance and year (Carlson 1985, Cannell et al. 1990, Kainer et al. 1991, Williams and South 1992). On the other hand, the onset of bud dormancy appeared to correspond to decreasing bud cell activity (Figure 5). For red oak and sugar maple, mitotic frequency started to decrease before maximum rest had occurred, although the dates were different for each species. A similar pattern was observed in studies that measured both mitotic index and DBB of slash pine (Pinus elliottii Engelm.) and loblolly pine (Kainer et al. 1991, Williams and South 1992).
at that time, but not dormant. It is possible that red oak was more sensitive to the warm temperatures recorded between October 5 and October 19, or to the heavy precipitation around October 9, or both. Species that show a cyclic growth pattern during the juvenile stage, such as many oaks, usually flush in response to favorable environmental conditions (Dupré et al. 1985).
According to Cannell et al. (1990), mitotic activity is strongly dependent on temperature and 5 °C represents the lower limit. In our study, cell activity virtually ceased for all species between January 11 and March 1, when maximum air tempera-ture was below 0 °C. Because cell mitotic activity roughly parallels temperature (Carlson 1985, Williams and South 1992), it is surprising that both red oak and sugar maple exhibited a mitotic frequency of four during the winter. However, the finding that mitotic frequency was not zero may not necessarily mean cell activity was maintained, because freezing temperatures could have stopped mitosis at the stages the cells had reached at that time.
To our knowledge, no published data on mitotic activity of temperate hardwood seedlings exist. Carlson (1985) and Williams and South (1992) found a stem apex mitotic activity index slightly below 5 and 1%, respectively, for loblolly pine seedlings, and Kainer et al. (1991) obtained a minimal mitotic index of about 1.8% for slash pine seedlings. However, all of these studies were conducted in regions where winters are relatively mild. Nevertheless, these results are contrary to other reports on evergreen species where the mitotic index became nil in wintertime (Owens and Molder 1973, Carlson et al. 1980, Cannell et al. 1990, Williams and South 1992).
We observed that mitotic activity resumed in all three species in early March when temperatures increased above the freezing point. Mitotic activity increased more slowly in yellow birch than in sugar maple and red oak, although yellow birch had a lower DBB requirement and bud break occurred earlier in May than in sugar maple and red oak. It is doubtful, therefore, that a direct relationship exists between bud dormancy and spring mitotic activity. This observation is supported by work on Sitka spruce (Picea sitchensis (Bong.) Carr.), Douglas-fir (Cannell et al. 1990) and loblolly pine (Williams and South 1992). A possible explanation proposed by Fielder and Owens (1989) is that, because cell division in the rib meristem and pith precedes cell elongation, it cannot be related to bud flushing. Moreover, mitotic frequency in the overall bud could show a different pattern than mitotic frequency in the rib meristem and subtending pith.
We conclude that overwintering outdoors results in damage to species that are not well acclimated, especially because of root sensitivity to frost. Adequate winter protection may improve survival. During the 1992 season of this study, snow arrived late following severe frosts, and the snowpack was thin during the entire winter of 1992--1993.
three species, stem hardening was observed before maximum DBB occurred. Dor-mancy release (DBB = 0) coincided with the loss of stem hardening in the spring for yellow birch. Roots hardened more slowly and had less frost tolerance than stems in fall and winter, but roots dehardened earlier than stems, perhaps in response to a rise in minimum temperatures in the containers.
Acknowledgments
We thank Annie Grimard for the determination of mitotic frequency and Yves Dubuc for his technical assistance throughout the project. We thank Michèle Bernier-Cardou for reviewing the first draft of the manuscript and three anonymous reviewers. We are also grateful to the staff at the provincial nursery of Berthier for supplying the seedlings. This research was funded by the ministère des Ressources naturelles du Québec, the Canadian Forest Service--Quebec Region and the Natural Sciences and Engineering Research Council of Canada.
References
Bernier-Cardou, M. and C. Genest. 1992. Factors influencing root growth capacity of spruce seedlings: report on a statistical analysis. Can. J. Stat. 20:488--500.
Boyer, J.N. and D.B. South. 1985. Dormancy, chilling requirements, and storability of container-grown loblolly pine seedlings. In Proc. Int. Symp. Nursery Manag. Practices for the Southern Pines. Ed. D.B. South. Auburn, AL, pp 372--379.
Cannell, M.G.R., P.M. Tabbush, J.D. Deans, M.K. Hollingsworth, L.J. Sheppard, J.J. Philipson and M.B. Murray. 1990. Sitka spruce and Douglas-fir seedlings in the nursery and in cold storage: root growth potential, carbohydrate content, dormancy, frost hardiness and mitotic index. Forestry 63:9--27. Carlson, W.C. 1985. Seasonal variation in mitotic index in the stem apex of loblolly pine seedlings. In
Proc. Int. Symp. Nursery Manag. Practices for the Southern Pines. Ed. D.B. South. Auburn, AL, pp 303--310.
Carlson, W.C., W.D. Binder, C.O. Feenan and C.L. Preisig. 1980. Changes in mitotic index during onset of dormancy in Douglas-fir seedlings. Can. J. For. Res. 10:371--378.
Colombo, S.J., C. Glerum and D.P. Webb. 1989. Winter hardening in first-year black spruce (Picea
mariana) seedlings. Physiol. Plant. 76:1--9.
Cox, D.R. 1970. Analysis of primary data. Methuen’s Statistical Monographs, Methuen & Co. Ltd., London, 142 p.
Dupré, S., B. Thiébaut and E. Teissier du Cros. 1985. Polycyclisme, vigueur et forme des jeunes hêtres plantés. Rev. For. Fr. 37:456--465.
Fernandez, G.C.J. 1992. Residual analysis and data transformation: important tools in statistical analysis. HortScience 27:297--300.
Fielder, P. and J.N. Owens. 1989. A comparative study of shoot and root development of interior and coastal Douglas-fir seedlings. Can. J. For. Res. 19:539--549.
Garber, M.P. and J.G. Mexal. 1980. Lift and storage practices: their impact on successful establishment of southern pine plantations. N.Z. J. For. Sci. 10:72782.
Johansen, D.A. 1940. Plant microtechnique. McGraw-Hill, New York, 523 p.
Kainer, K.A., M.L. Duryea, T.L. White and J.D. Johnson. 1991. Slash pine bud dormancy as affected by lifting date and root wrenching in the nursery. Tree Physiol. 9:479--489.
Lavender, D.P. 1985. Bud dormancy. In Evaluating Seedling Quality: Principles, Procedures, and Predictive Abilities of Major Tests. Ed. M.L. Duryea. For. Res. Lab., Oregon State Univ., Corvallis, pp 7--15.
Lavender, D.P. 1991. Measuring phenology and dormancy. In Techniques and Approaches in Forest Tree Ecophysiology. Eds. J.P. Lassoie and T.M. Hinckley. CRC Press, Boca Raton, FL, pp 403--422. Levitt, J. 1956. The hardiness of plants. Academic Press, New York, 278 p.
Lindström, A. 1986a. Outdoor winter storage of container stock on raised pallets----effects on root zone temperature and seedling growth. Scand. J. For. Res. 1:37--47.
Lindström, A. 1986b. Freezing temperatures in the root zone----effects on growth of containerized Pinus
sylvestris and Picea abies seedlings. Scand. J. For. Res. 1:371--377.
Milliken, G.A. and D.E. Johnson. 1984. Analysis of messy data. Vol. 1. Designed experiments. Van Nostrand Reinhold, New York, 473 p.
Owens, J.N. and M. Molder. 1973. A study of DNA and mitotic activity in the vegetative apex of Douglas-fir during the annual growth cycle. Can. J. Bot. 51:1395--1409.
Owens, J.N. and M. Molder. 1976. Bud development in Sitka spruce. I. Annual growth cycle of vegetative buds and shoots. Can. J. Bot. 54:313--325.
Williams, H.M. and D.B. South. 1992. Effects of fall fertilizer applications on mitotic index and bud dormancy of loblolly pine seedlings. For. Sci. 38:336--349.