Full Terms & Conditions of access and use can be found at
http://www.tandfonline.com/action/journalInformation?journalCode=ubes20
Download by: [Universitas Maritim Raja Ali Haji] Date: 13 January 2016, At: 01:06
Journal of Business & Economic Statistics
ISSN: 0735-0015 (Print) 1537-2707 (Online) Journal homepage: http://www.tandfonline.com/loi/ubes20
Business Cycle Duration Dependence
Reconsidered
Thomas W Zuehlke
To cite this article: Thomas W Zuehlke (2003) Business Cycle Duration Dependence Reconsidered, Journal of Business & Economic Statistics, 21:4, 564-569, DOI: 10.1198/073500103288619241
To link to this article: http://dx.doi.org/10.1198/073500103288619241
View supplementary material
Published online: 01 Jan 2012.
Submit your article to this journal
Article views: 41
View related articles
Business Cycle Duration Dependence
Reconsidered
Thomas W. Z
UEHLKE,
Department of Economics, Florida State University, Tallahassee, FL (tzuehlke@mailer.fsu.edu)
Sichel estimated a Weibull hazard model using the National Bureau of Economic Research business cycle chronology and found evidence of duration dependence only for prewar expansions and postwar contrac-tions. The article updates the postwar sample through the end of the most recent expansion and uses a generalized Weibull model that provides much greater exibility at the expense of one additional parame-ter. This model nds evidence of duration dependence for all samples and is statistically superior to the conventional Weibull model for all samples except postwar contractions.
KEY WORDS: Bootstrap; Generalized Weibull; Hazard function; Nonlinear.
1. INTRODUCTION
Sichel (1991, p. 254) asked “Are periods of expansion or con-traction in economic activity more likely to end as they become older?” At the time, the United States was nearing the end of its longest peacetime expansion in history. The expansion of the 1990s lasted even longer. A recent National Bureau of Eco-nomic Research (NBER) decision dates the end of this cycle as March 2001, which corresponds to a 120-month-longexpan-sion. Sichel’s question is as relevant today as it was a decade earlier.
Sichel (1991) used a Weibull hazard model to test for dura-tion dependence in the NBER business cycle chronology. The choice of the Weibull model was motivated by the relatively low power exhibited by nonparametric tests of duration depen-dence. Even with time series dating back to the mid-1800s, the sample size (which is determined by the number of distinct pe-riods of expansion or contraction) is relatively small. Sichel found evidence of positive duration dependence in prewar ex-pansions and postwar contractions, but no evidence of duration dependence in prewar contractions or postwar expansions. This suggests that in the postwar period, the probability that an ex-pansion will end is unrelated to its current duration.
The fundamental assumption of the Weibull model is a lin-ear relationship between the log of the hazard function and the log of duration. Diebold, Rudebusch, and Sichel (1993) used an exponential-quadratic hazard model, which assumes that the log-hazard function is quadratic in duration. The exponential-linear hazard model is a restricted case where the log-hazard function is linear in duration. One advantage of the exponential-quadratic model is that it allows nonlinear and nonmonotonic time proles for the log-hazard function.
A comparison of the results of Sichel (1991) and Diebold et al. (1993) is complicated by several factors. First, the exponential-quadratic model does not nest the Weibull model. Consequently, the point estimates are not directly comparable. This is most obvious when comparing the Wiebull model with the exponential-linear model. With the Weibull model, the log-hazard function is linear in the log of duration and the dura-tion elasticity is constant, whereas with the exponential-linear model, the log-hazard function is linear in duration and the du-ration elasticity is proportional to dudu-ration. Second, the method of correcting for censoring of cycles of relatively short dura-tion differs. Both articles estimated a censoring threshold,
de-noted by± here, as one period less than the minimum value of observed duration in the sample. They differ, however, in that Sichel estimated the censoring threshold from the NBER data, whereas Diebold et al. used a pooled sample of inter-national data. Sichel then corrected for censoring by using the conditional density for duration given that it exceeds±, whereas Diebold et al. simply subtracted± from observed du-ration and used the unconditionaldensity function for dudu-ration. Finally, Sichel tested hypotheses using bootstrappedtstatistics, whereas Diebold et al. reportedpvalues for asymptotic Wald statistics.
Despite these differences, it is probably not surprising that the results obtained by Diebold et al. (1993) with the exponential-linear model arequalitativelysimilar to those of the Weibull model reported by Sichel (1991). Both studies nd statistical evidence of a positive duration elasticity only for prewar expansions and postwar contractions. Furthermore, the exponential-quadratic model provides little evidence of a non-linear time prole for the log-hazard function. The estimated coefcient of the quadratic term is not signicant at conven-tional levels for any of the samples of U.S. data considered.
Diebold et al. (1993, p. 91) cautioned that the “exponential-quadratic hazard is used only as alocalapproximation,” be-cause “certain parameterizations of the exponential-quadratic hazard do not, strictly speaking, qualify as proper hazard func-tions.” Specically, a hazard function must be nonnegativewith a survivor function that approaches 0 as duration approaches innity. These restrictions may limit the inherent exibility of the quadratic approximation, particularly in the tails of the dis-tribution. Mudholkar, Srivastava, and Kollia (1996) presented a generalized Weibull model (henceforth, the Mudholkar model) that provides much greater exibility than the Weibull model, at the expense of one additional parameter. The Mudholkar model nests the Weibull model. It also allows nonlinear and non-monotonic proles for the log-hazard function, while providing a “proper” hazard function for all parameter values. In light of these advantages, the Mudholkar model may be better suited to detect nonlinear duration dependence than the exponential-quadratic model.
© 2003 American Statistical Association Journal of Business & Economic Statistics October 2003, Vol. 21, No. 4 DOI 10.1198/073500103288619241 564
Zuehlke: Business Cycle Duration Dependence 565
This article extends Sichel’s work in two directions. First, the Mudholkar model is estimated using the NBER data. Estimates of the Weibull model are included for the purpose of com-parison. There seems little reason to estimate the exponential-quadratic model, given that the estimates are not comparable with either the Weibull model or the Mudholkar model. Sec-ond, the sample period is extended through March 2001. This will allow us to determine whether Sichel’s ndings are sensi-tive to the log-linear specication inherent in the Weibull model or to the new sample information reected in the most recent expansion.
2. METHODOLOGY
A hazard model may also be specied in terms of its survivor function. The survivor function of the Weibull model is
S.t/Dexp.¡®t¯C1/; (1) This is the fundamental assumption of the Weibull specica-tion, a linear relationship between the log of the hazard function and the log of duration. The parameter¯is the duration elastic-ity of the Weibull hazard model. The Weibull hazard function is monotone in duration and exhibits positive (negative) dura-tion dependence when¯ is positive (negative). The parameters
® and¯ in this article correspond to ¹ and ®¡1 of Sichel (1991).
Mudholkar et al. (1996) presented a generalized Weibull model that provides much greater exibility at the expense of one additional parameter. Their generalized model allows hazard functions that are monotically increasing, monotoni-cally decreasing, U-shaped, and inverted U-shaped. The sur-vivor function of the Mudholkar model is
S.t/D£1¡¸®t.¯C1/¤¸¡1
; (4) where® >0,¯ >¡1, and the sample space oftis.0;1/for
¸·0 and.0; .®¸/¡.1=¯ //for¸ >0. The survivor function of
the Mudholkar model converges to that of the Weibull model as
¸approaches 0. The hazard function of the Mudholkar model is
h.t/D®.¯C1/t¯[S.t/]¡¸ (5) or, in log terms,
ln[h.t/]Dln[®.¯C1/]C¯ln.t/¡¸ln[S.t/]: (6) Because the log transformation is monotonic and the survivor function is decreasing in duration and bounded by the unit in-terval, the hazard function is monotonically increasing in dura-tion if both¯ and¸are positive, monotonically decreasing if both¯ and¸are negative, U-shaped if ¯ is negative and¸is
positive, and inverted U-shaped if ¯ is positive and¸is neg-ative. The parameters®; ¯, and¸in this article correspond to
¾¡.1=®/; .1=®/¡1, and¸of Mudholkar et al.
Even when the hazard function of the Mudholkar model is monotone in duration, its log-hazard function is generally non-linear in log-duration. The duration elasticity of the Mudholkar model is
@ln[h.t/]
@ln.t/ D¯C
1¡S.t/¸
S.t/¸ .¯C1/: (7)
In general, the duration elasticity depends on the signs and rel-ative magnitudes of both¯and¸.
In the Weibull model, a signicant estimate of ¯ provides statistical evidence of duration dependence. In the Mudholkar model, a signicant estimate ofeither ¯ or¸ provides statis-tical evidence of duration dependence. A signicant estimate of¸also provides evidence of the statistical superiority of the Mudholkar model relative to the Weibull model, because a non-linear time prole for the log-hazard function can only occur when¸is nonzero.
Sichel (1991) modeled the sequences of expansions and con-tractions separately. His log-likelihood function corrects for two types of censoring. First, when a cycle is still in progress at the ending date of the sample, its complete duration is censored. All that is known is that the complete duration of the cycle is no less than its observed value. The log-likelihood function for a sequence of expansions (contractions) with observed durations,
ti, is
whereJiis a binary variable that indicates whether the cycle is
complete,Nis the number of expansions (contractions) in the sequence, and wheref.¢/andF.¢/are the density function and distribution function for duration. Second, expansions (contrac-tions) of relatively short duration may be censored. Diebold and Rudebusch (1996, p. 604) argued that “a cycle is designated in the NBER methodology only if it has achieved a certain ma-turity.” Sichel controlled for this second form of censoring by using the density and distribution functions for duration, con-ditional on duration exceeding some minimum, denoted by±. This censoring threshold is estimated as one period less than the minimum value of observed duration for the sample period. The resulting log-likelihood function is
lnL.®; ¯; ¸/D Given that the survivor function is the complement of the dis-tribution function, and the density function is the product of the hazard function and survivor function, this log-likelihood func-tion may be written as
lnL.®; ¯; ¸/D model or as (4) and (5) for the Mudholkar model.
The parameters are estimated by the method of maximum likelihood (ML). The score equations for®; ¯, and¸are a set of simultaneousnonlinear implicit functions and must be solved numerically. Typically, asymptotic standard errors are reported with nonlinear ML estimates. This article follows the work of Sichel (1991), however, and reports bootstrapped standard er-rors, as well aspvalues for bootstrappedtstatistics, because of the relatively small sample sizes found in the NBER chronol-ogy. Efron and Tibshirani (1993) gave a detailed discussion of the bootstrap method, and Bickel and Freedman (1981) consid-ered the asymptotic validity of bootstrappedtstatistics.
3. RESULTS
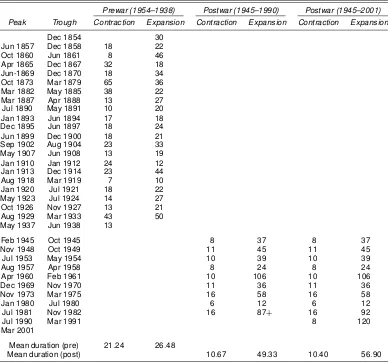
The NBER business cycle chronology is available from nu-merous sources, including the NBER website, atwww.nber.org. Sichel (1991) used the NBER series for the period December 1854–February 1990. This article extends the sample through the end of the most recent expansion, March 2001. The data are presented in Table 1, with the duration of each contraction and expansion listed adjacent to its starting date.
Tables 2 and 3 present the estimates obtained for business cy-cle expansions and contractions, respectively. ML estimates of
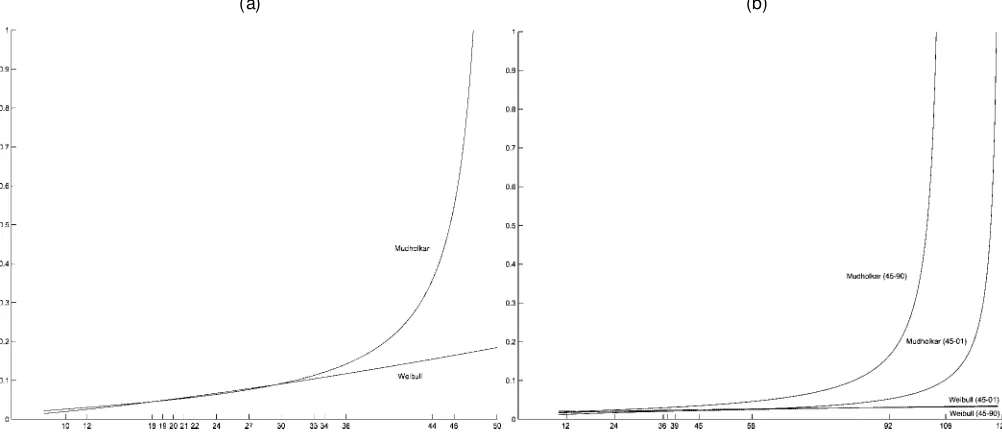
the parameters of the Weibull and Mudholkar models are pre-sented, along with standard errors based on 500 bootstrapped samples, and thep value of the correspondingtstatistic. Fol-lowing Sichel (1991), thesep values are calculated for a one-tailed test using the bootstrapped standard errors. Figure 1 plots the relationship between the hazard function and duration for prewar and postwar expansions,whereas Figure 2 does likewise for prewar and postwar contractions. Because of differences in the range of sample variation, the horizontal axis of each gure is scaled to match the observed range of sample variation. The gradations on the horizontal axis correspond to the observed values of duration within the sample.
The rst panel of Table 2 provides estimates for expansions in the prewar sample period (December 1854–June 1938). The duration elasticity of the Weibull model,¯, is estimated at 1.38 and is signicantly positive at the 5% level. The estimate of
¯ in the Mudholkar model is not signicantly positive at con-ventional levels. Evidence of positive duration dependence is provided by the estimate of¸, however, which is signicantly positive at the 5% level. As noted in the previous section, a sig-nicant estimate of¸ not only provides evidence of duration dependence, but of the statistical superiority of the Mudholkar model relative to the Weibull model as well. The nature of the improvement provided by the Mudholkar model is evident in
Table 1. NBER Chronology
Prewar (1954–1938) Postwar (1945–1990) Postwar (1945–2001)
Peak Trough Contraction Expansion Contraction Expansion Contraction Expansion
Dec 1854 30
Jun 1857 Dec 1858 18 22
Oct 1860 Jun 1861 8 46
Apr 1865 Dec 1867 32 18
Jun-1869 Dec 1870 18 34
Oct 1873 Mar 1879 65 36
Mar 1882 May 1885 38 22
Mar 1887 Apr 1888 13 27
Jul 1890 May 1891 10 20
Jan 1893 Jun 1894 17 18
Dec 1895 Jun 1897 18 24
Jun 1899 Dec 1900 18 21
Sep 1902 Aug 1904 23 33
May 1907 Jun 1908 13 19
Jan 1910 Jan 1912 24 12
Jan 1913 Dec 1914 23 44
Aug 1918 Mar 1919 7 10
Jan 1920 Jul 1921 18 22
May 1923 Jul 1924 14 27
Oct 1926 Nov 1927 13 21
Aug 1929 Mar 1933 43 50
May 1937 Jun 1938 13
Feb 1945 Oct 1945 8 37 8 37
Nov 1948 Oct 1949 11 45 11 45
Jul 1953 May 1954 10 39 10 39
Aug 1957 Apr 1958 8 24 8 24
Apr 1960 Feb 1961 10 106 10 106
Dec 1969 Nov 1970 11 36 11 36
Nov 1973 Mar 1975 16 58 16 58
Jan 1980 Jul 1980 6 12 6 12
Jul 1981 Nov 1982 16 87C 16 92
Jul 1990 Mar 1991 8 120
Mar 2001
Mean duration (pre) 21:24 26:48
Mean duration (post) 10:67 49:33 10:40 56:90
NOTE: The duration of each expansion or contraction is listed adjacent to its starting date. TheCindicates the effective duration of the incomplete expansion (as of Feb 1990) used by Sichel (1991).
Zuehlke: Business Cycle Duration Dependence 567
Table 2. Parameter Estimates for Business Cycle Expansions
Weibull Mudholkar
MLE SE p value MLE SE p value
Prewar sample (December 1854–June 1938)
® :00035 .00054 .26175 .00279 .00686 .34454 ¯ 1:38038 .42078 .00197 .71110 .69092 .15851
¸ 0 .44380 .20111 .02028
Sichel’s postwar sample (February 1945– February 1990)
® :00656 .02337 .39354 .00969 .04682 .42145 ¯ :28295 1.57546 .43128 .17507 .90979 .42688
¸ 0 .43040 .32407 .11621
Updated postwar sample (February 1945–March 2001)
® :00279 .00652 .34008 .05199 .19910 .40076 ¯ :44887 .43836 .16791 ¡.31172 .71584 .33817
¸ 0 .71290 .37379 .04908
NOTE: SE denotes bootstrap standard errors;pvalue denotes the marginal signicance level of a one-sided test using the bootstrap standard errors.
Figure 1(a). The signicant estimate of¸results in a positive andincreasingduration elasticity. The durations elasticities of the Weibull and Mudholkar models are quite similar for ex-pansions of relatively short duration. For exex-pansions exceeding 30 months, however, the duration elasticity of the Mudholkar model increases rapidly. The improvement in t with the Mud-holkar model occurs in the tail of the distribution.
The second panel of Table 2 provides estimates for ex-pansions in Sichel’s postwar sample period (February 1945– February 1990). The estimated duration elasticity for the Weibull model is .28, but it is not statistically signicant. The estimates of¯and¸in the Mudholkar model are also insigni-cant. The Mudholkar model does provide some weak evidence of duration dependence, however. Though insignicant at con-ventional levels, the estimate of¸is marginally signicant at an
®level of roughly 12%.
The third panel of Table 2 provides estimates for expansions in the updated postwar sample period (February 1945–March 2001). The estimated duration elasticity for the Weibull model rises to approximately .45. It is still insignicant, although its
pvalue does fall to approximately .17. The estimate of¯in the Mudholkar model remains insignicant, but the estimate of¸
is now signicantly positive at the 5% level. The hazard plots provided in Figure 1(b) for both postwar samples are qualita-tively similar to those of the prewar sample in Figure 1(a). The duration elasticities of the two models are similar for expan-sions of relatively short duration. The duration elasticity of the Mudholkar model increases rapidy, however, once an expansion exceeds roughly 70 months in length.
A comparison of the results for the two postwar samples sug-gests that the greater exibility of the Mudholkar model and the new sample information in the latest expansion are both im-portant to the nding of positive duration dependence for ex-pansions in the postwar period. Using the updated sample by itself does not lead to a signicant duration elasticity in the Weibull model. Using the Mudholkar model with the postwar sample of Sichel does not result in a nding of signicant du-ration dependence. Only when the Mudholkar model is used in conjunction with the updated sample is signicant duration de-pendence obtained. These results suggest the not too-surprising conclusion that, given the relatively small sample of 9 or 10 ob-servations in the postwar period, using a more exible model or the addition of new observations improves the precision of the estimates. The insignicant duration elasticities for the post-war period found in previous studies may be, at least in part, a small-sample problem.
An anonymous referee suggested an alternative explanation. The sharp increase in the duration elasticity of postwar expan-sions occurs only at relatively long values of duration. Stock and Watson (2002) provided evidence of a dramatic reduction in economic volatility beginning in the early 1980s. Chauvet and Potter (2001) suggested that the drop in volatility may have resulted in longer expansions. If there was a regime shift in the early 1980s that resulted in expansions of relatively longer du-ration, then pooling the two most recent expansions with the earlier postwar data might provide the appearance of positive
(a) (b)
Figure 1. Hazard Plots for (a) Prewar Business Cycle Expansions and (b) Postwar Business Cycle Expansions.
Table 3. Parameter Estimates for Business Cycle Contractions
Weibull Mudholkar
MLE SE p value MLE SE p value
Prewar sample (December 1854–June 1938)
® :01831 .01978 .18306 .00914 .01410 .26252 ¯ :34506 .32400 .15011 .55395 .47418 .12898
¸ 0 .16670 .09142 .04245
Sichel’s postwar sample (February 1945–February 1990)
® :00065 .00147 .33561 .00001 .00001 .47429 ¯ 2:02252 .75267 .01561 5.18221 .90979 .05112
¸ 0 .04930 .32407 .17962
Updated postwar sample (February 1945–March 2001)
® :00097 .00192 .31323 .00001 .00001 .44917 ¯ 1:90088 .68250 .01187 5.02094 2.09914 .02402
¸ 0 .04810 .03775 .12163
NOTE: SE denotes bootstrap standard errors;pvalue denotes the marginal signicance level of a one-sided test using the bootstrap standard errors.
duration dependence. The referee concluded that there is no ob-vious way to distinguish these explanations given the limited sample of available data.
This is not the rst article to nd evidence of positive dura-tion dependence in postwar expansions. Kim and Nelson (1998) provided Bayesian estimates of the dynamic factor model with regime switching proposed by Diebold and Rudebusch (1996). Although not directly comparable in methodology, their esti-mates of the posterior probability of a recession closely track the contractions of the NBER business cycle chronology. They also provided limited evidence of positive duration dependence in postwar business cycle expansions. The estimated posterior probability of no duration dependence is quite low for certain choices of prior distribution. The evidence is limited in the sense that the results are not robust to the choice of prior distri-bution.
The rst panel of Table 3 provides estimates for the prewar sample of business cycle contractions. The estimated duration elasticity of the Weibull model is .35, but it is not signicantly
positive at conventional levels. For the Mudholkar model, the estimate of¯ is not signicant, but the estimate of¸is signi-cantly positive at the 5% level. As in the previous cases, the du-ration elasticity is positive and increasing, and the Mudholkar model represents a signicant improvement over the Weibull model. For the prewar sample of contractions, the Mudholkar model is capable of detecting duration dependence when the Weibull is not.
The second panel of Table 3 reports the estimates obtained with Sichel’s postwar sample of contractions. Strong evidence of positive duration dependence is found. The estimated dura-tion elasticity of the Weibull model is 2.02 and is signicantly positive at the 5% level. In this sample, however, the estimate of
¯ in the Mudholkar model is signicantly positive at approxi-mately the 5% level, whereas the estimate of¸is not signicant at conventional levels. The postwar sample of contractions is the only sample in which the Mudholkar model does not pro-vide a statistical improvement over the Weibull model.
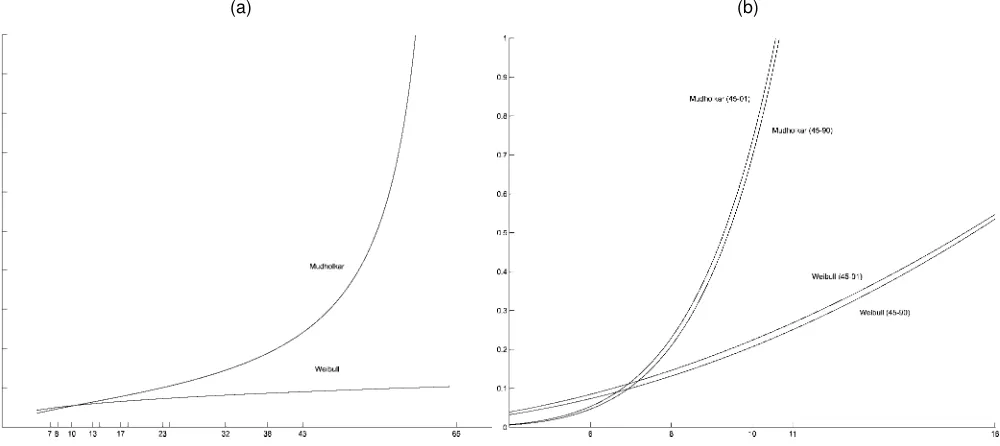
The third panel of Table 3 presents the estimates obtained with the updated postwar sample. The point estimates are quite similar to those obtained with Sichel’s postwar sample of contractions. The estimated duration elasticity of the Weibull model falls slightly to 1.90, but it remains signicantly positive at the 5% level. Likewise, the estimate of¯in the Mudholkar is signicantly positive, whereas the estimate of¸is insignicant at conventional levels. There is weak evidence of a nonlinear hazard prole, however, because the estimate of¸is marginally signicant at an®level of roughly 12%. The new information in the updated postwar sample again improves the precision of the estimates for both models. Figure 2 presents hazard plots for prewar and postwar contractions. The plots are qualitatively similar to those found with expansions. The duration elasticities of the Weibull and Mudholkar models are similar for contrac-tions of relatively short duration, with the duration elasticity of the Mudholkar model increasing as the contraction persists.
(a) (b)
Figure 2. Hazard Plots for (a) Prewar Business Cycle Contractions and (b) Postwar Business Cycle Contractions.
Zuehlke: Business Cycle Duration Dependence 569
4. CONCLUSION
The Weibull estimates presented in the rst two panels of Ta-bles 2 and 3 replicate the results of Sichel (1991). The estimated duration elasticities of Sichel, obtained by subtracting one from his estimate of®, are virtually identical to those reported here, and signicant evidence of duration dependence is only found for prewar expansions and postwar contractions. Use of the up-dated postwar samples does not change the qualitative nature of the results obtained with the Weibull model.
The estimates of the Mudholkar model obtained with the prewar and updated postwar samples provide a different set of conclusions. With the prewar samples, evidence of positive duration dependence is found for both expansions and con-tractions. Furthermore, the estimate of the parameter¸, which distinguishes the two models and provides a statistical test of the superiority of the Mudholkar model, is found to be statisti-cally positive for both expansions and contractions. When ap-plied to theupdatedpostwar samples, the Mudholkar model again nds evidence of positive duration dependence for both expansions and contractions, and the estimate of¸is found to be signicantly positive for postwar expansions. In this applica-tion, the statistical advantage of the Mudholkar model relative to the Weibull model appears to lie in its ability to allow positive and increasing duration elasticities.
ACKNOWLEDGMENTS
The author thanks an associate editor and anonymous refer-ees for helpful comments on an earlier draft of this article.
[Received May 2001. Revised December 2002.]
REFERENCES
Bickel, P. J., and Freedman, D. A. (1981), “Some Asymptotic Theory for the Bootstrap,”The Annals of Statistics, 9, 1196–1217.
Chauvet, M., and Potter, S. (2001), “Recent Changes in the Business Cycle,” Staff Report 126, Federal Reserve Bank of New York.
Diebold, F. X., and Rudebusch, G. (1996), “Measuring Business Cycles: A Modern Perspective,”Review of Economics and Statistics, 78, 67–77. Diebold, F. X., Rudebusch, G., and Sichel, D. E. (1993), “Further Evidence
on Business Cycle Duration Dependence,” inBusiness Cycles, Indicators, and Forecasting, eds. J. H. Stock and M. W. Watson, Chicago: University of Chicago Press, pp. 87–116.
Efron, B., and Tibshirani, R. J. (1993),An Introduction to the Bootstrap, New York: Chapman & Hall.
Kim, C. J., and Nelson, C. R. (1998), “Business Cycle Turning Points, A New Coincident Index, and Test of Duration Dependence Based on a Dynamic Factor Model With Regime Switching,”Review of Economics and Statistics, 80, 188–201.
Mudholkar, G. S., Srivastava, D. K., and Kollia, G. D. (1996), “A Generaliza-tion of the Weibull DistribuGeneraliza-tion With ApplicaGeneraliza-tion to the Analysis of Survival Data,”Journal of the American Statistical Association, 91, 1575–1583. Sichel, D. E. (1991), “Business Cycle Duration Dependence: A Parametric
Ap-proach,”Review of Economics and Statistics, 73, 254–260.
Stock, J. H., and Watson, M. W. (2002), “Has the Business Cycle Changed and Why?,” Working Paper W9127, National Bureau of Economic Research.