Copyright © 2017 (Adam S. Richards and Edward L. Fink). Licensed under the Creative Commons Attribution Non-commercial No Derivatives (by-nc-nd). Available at http://ijoc.org.
Attributional Chromatics: How Does the Color of
Written Communication Affect Interpersonal Perceptions?
ADAM S. RICHARDS
Texas Christian University, USA
EDWARD L. FINK
Temple University, USA
This study investigated how the color of written communication influences interpersonal attributions. An experiment was conducted whereby students read a peer’s graded essay that varied according to the color of the ink used by the instructor. Feedback in red, compared with green or black, generally elicited more negative perceptions. Students reading feedback in red experienced greater negative emotion, gave the essay a lower grade, and judged the student-author to be less capable. A mediation model whereby negative emotion intervened between the color manipulation and the assessments made toward the essay, the student, and the instructor was supported. Nonrecursivity between student and instructor characteristics was found. Positive perceptions of student ability reduced perceptions of instructor competence, whereas positive perceptions of instructor competence increased perceptions of student ability.
Keywords: attribution, color, emotion, nonverbal communication
Anecdotally, fewer and fewer teachers use red pens because red is thought to upset students (e.g., Turvill, 2014). The purpose of this study is to understand the process by which color used for a written message affects attributions made about the target and source of the communication. We investigate this question in the specific context of the student–instructor relationship by assessing how color, in the form of an instructor’s written feedback on students’ assignments affects students’ perceptions of the graded academic work, their peers, and their instructors.
Colors as nonverbal cues communicate a great deal. For example, studies show that the color of a person’s clothing (Elliot & Pazda, 2012) or of a written message (Elliot, Maier, Moller, Friedman, & Meinhardt, 2007) affect behavior. Yet the process by which color affects interpersonal behavior has received relatively little attention (Knapp, Hall, & Horgan, 2014). By integrating Elliot and Maier’s (2012) color-in-context theory and Weiner’s (1986) attributional model of motivation and emotion, we argue that
Adam S. Richards: [email protected] Edward L. Fink: [email protected]
the color of written instructional feedback influences interpersonal attributions about students and instructors via initial emotional responses. Our study diverges from previous research (Dukes & Albanesi, 2013) by emphasizing the primary role of emotion within the color–perception relationship. Further, we seek to assess how the attributions made by student-observers who have seen an evaluative communication made by an instructor toward another student are processed. The academic context of instructional feedback allows for a practically important and theoretically relevant study of interpersonal attribution via color cues.
Thus, we frame the present study with regard to two questions. First, what attributions do students make about the quality of an essay, its student-author, and its instructor-grader after receiving feedback made in red? Second, by what process does red feedback affect students’ emotional and interpersonal responses? To answer these questions, we conducted an experiment in which students made attributions about a student and instructor after reading a paper with feedback in red, green, or black, or without any feedback.1
Theoretical Approach to Color
Color-in-context theory (Elliot & Maier, 2014) explains people’s varying responses to color cues. The theory states that colors communicate meanings that influence cognitions and behaviors. Colors can elicit either positive associations, which evoke approach-oriented responses, or negative associations, which evoke avoidance-oriented responses. Colors’ effects on psychological functioning frequently go unrecognized because of the brain’s automatic and implicit processing of colors (Elliot et al., 2007).
According to Elliot and Maier (2012), a color’s meaning is interpreted in the environment in which it is encountered. Contexts that affect color perceptions include additional visual information, such as the shape or texture of the object on which the color is seen. This idea explains why red has different connotations depending on context. In affiliative situations, people wearing red clothing are perceived to be more attractive than those adorned in other colors (e.g., Elliot & Pazda, 2012).
However, in achievement situations, red is associated with negative or avoidant responses (Thorstenson, 2015). Red is associated with failure and green with success in intellectual achievement contexts in which one’s competence is evaluated (Moller, Elliot, & Maier, 2009). For example, seeing red on a test booklet resulted in participants choosing easier intellectual tasks (Elliot & Maier, 2012) and physically distancing themselves from the test booklet (Elliot, Maier, Binser, Friedman, & Pekrun, 2009), which indicates avoidance. The color of a test-giver’s shirt caused participants to choose easier questions to answer (Tanaka & Tokuno, 2011). Red lowered scores on intelligence tests if it appeared as the color of the test booklet cover (Maier, Elliot, & Lichtenfeld, 2008), particularly for those with little self-control (Bertrams, Baumeister, Englert, & Furley, 2015).The color of the ink used to write an identification number on the cover of the test booklet elicited similar results (Elliot et al., 2007). Red progress bars and forward arrows in Web-based testing diminished cognitive abilities (Gnambs, Appel, & Batinic, 2010). People who received red feedback also performed worse in subsequent trials, making more errors in a
rapid-response task (Houtman & Notebaert, 2013) and making poorer financial decisions (Shavit, Rosenboim, & Cohen, 2013). The effects hold for children: Red screens led to worse scores on reading comprehension tests and on other cognitive tasks (Brooker & Franklin, 2016).
Despite the evidence showing the negative effects of red in achievement contexts, the color– emotion relationship has not been well explained (Elliot & Maier, 2014). We seek to demonstrate that color’s influence on cognition is mediated by emotion. Although color-in-context theory acknowledges that color acts as an implicit affective cue, the theory does not designate emotion as necessarily antecedent to cognition. Current theorizing about color has focused on cognitive and behavioral outcomes, but not necessarily on the process by which these outcomes are brought about.
How the color of instructional feedback comes to influence interpersonal perceptions in achievement contexts may be explained by attribution theory, which accounts for the process by which people make causal explanations to observed stimuli (Heider, 1958). Weiner’s (1986) attributional model of motivation and emotion, in particular, may account for the process by which color influences interpersonal attributions. The model asserts that people make causal ascriptions about a person’s achievement (e.g., ability and effort) and personality subsequent to experiencing unexpected negative emotion from a stimulus. Thus, outcome-dependent affect—affect that is a direct response to a subjective experience—is theorized to precede interpersonal attributions: Only after people experience negative affect do they make causal ascriptions about others. The purpose of the current investigation is to assess whether the effect of instructional feedback color on interpersonal attributions is mediated by negative affect. Because red elicits negative responses in achievement contexts (Elliot & Maier, 2012), the possibility exists for such responses to cause student (under)achievement according the process theorized by Weiner.
In addition to the color red affecting a person’s own avoidant responses, research shows that the color red affects evaluative attributions toward other people in achievement contexts for both physical and intellectual tasks. For example, hypothetical sparring opponents who were imagined to wear red were perceived as more dominant and threatening (Feltman & Elliot, 2011). Taekwondo referees assigned greater success to combatants who wore red compared with blue (Hagemann, Strauss, & Leißing, 2008). Boxers wearing red are perceived as more brave and aggressive compared with ones wearing blue (Sorokowski & Szmajke, 2007). Mock negotiators perceived their partners as more intimidating when the others bargained using red tokens as opposed to tokens of other colors (Ten Velden, Baas, Shalvi, Preenen, & De Dreu, 2012). Even red shapes, compared with blue shapes, are considered more dominant, aggressive, and likely to win a physical fight against a black shape (Little & Hill, 2007). Outside of competitive settings, men wearing red are also perceived by others as more aggressive, dominant, and angry (Wiedermann, Burt, Hill, & Barton, 2015).
essay that they read a lower grade (Rutchick et al., 2010). If instructors grade more harshly in red, it seems likely that students interpret feedback in red as more critical as well. Indeed, given what we know about how red affects instructors’ grading behaviors, students who judge feedback given in red to be more negative may be quite accurate.
Only one study that we know of has explored the question of how students evaluate instructors based on an instructor’s feedback in various colors. Dukes and Albanesi (2013) had students read a student-peer’s essay and an instructor’s feedback in either red or aqua. They found that the instructor was evaluated as less expressive (i.e., less nice, enthusiastic, or with good rapport) when using red feedback compared with aqua feedback, but no differences were found for the level of the perception of instructor’s knowledge. This research serves as suitable foundation for the current study, but we seek to extend it in a number of ways. First, we seek to increase the ecological validity of their study by using an alleged actual student’s and instructor’s comments in the context of a departmental assessment—Dukes and Albanesi presented participants with a hypothetical student’s essay and hypothetical instructor’s comments. Second, we present written feedback to students in actual handwriting—their study presented feedback written in a computer font that was meant to approximate handwriting. Third, we assess students’ attributions of the student-author of the essay as well as attributions regarding the instructor. We believe it possible that attributions of one are related to the other. Finally, Dukes and Albanesi concluded that “one potential trigger in the emotional experience of receiving criticism, the color of the grading pen, affects perceptions of teaching” (p. 99). However, the authors made this claim without demonstrating whether red affected perceptions of the instructor via emotional response. We seek to model emotion as intervening between the effect of color and interpersonal attributions.
Research supports the idea that negative interpersonal attributions result from exposure to feedback in red as compared with feedback in other colors. In the present research, we seek to assess whether such attributions result from the arousal of negative emotion elicited by the color of ink used by instructors to write feedback on a paper.
We propose the following hypotheses. Compared with feedback in green or black:
H1: Feedback in red causes recipients of the feedback to be viewed as experiencing more negative emotion.
H2: Feedback in red causes a student-author’s work to be perceived to be of lower quality.
H3: Feedback in red causes a student-author to be perceived to be of lower ability.
In the course of investigating these four hypotheses, we will first evaluate whether instructional feedback, regardless of color, has an effect on the perception of the quality of the person responsible for the material that is being evaluated. Thus, we ask the following research question:
RQ1: Regardless of color, does the presence of feedback affect the perception of work quality?
A number of academic achievement studies have found no difference between chromatic colors like green or blue and achromatic hues like black, white, or gray (Elliot et al., 2007; Houtman & Notebaert, 2013; Moller et al., 2009; Shavit et al., 2013; Tanaka & Tokuno, 2011). We have no theoretical reason to suspect that comments in green differ on the variables of interest from comments in black; we will treat this matter as a research question:
RQ2: Does feedback in black differ from feedback in green in terms of the assessment of work, the assessment of the student who provided the work, or the assessment of the instructor who provided the feedback for the work?
In recognition of Weiner’s (1986) view that negative emotional responses precede interpersonal causal ascriptions, we seek to identify if and how emotion generates responses to an instructor’s colored feedback by causing attributions regarding the student and the instructor. Indeed, red is associated with negative emotions like anger (Fetterman, Robinson, Gordon, & Elliot, 2011; Wiedermann et al., 2015) and unhappiness (Brooker & Franklin, 2016). Negative emotion is expected to mediate the relationship between the color of the feedback provided by an instructor and the attributions toward the academic work, the student, and the instructor. Further, we expect that attributions toward the academic work precede attributions toward the instructor and student. Finally, we predict that interpersonal attributions toward the student and instructor are nonrecursive: Assessments of student ability influence observers’ assessments of instructor competence and vice versa. We test other plausible models to distinguish whether the hypothesized attribution model provides a superior explanation for color’s effect on attributions compared with competing explanations. We propose:
H5: Emotion mediates the effect of feedback color on assessments of the student’s work, the student-author, and the instructor who provided the evaluation.
Method
Participants
Procedure
Participants were recruited via an online research management system. After agreeing to participate, they were directed to an online survey. Participants were informed that the alleged purpose of the study was a departmental review of students’ and instructors’ academic performance. After giving informed consent, participants were randomly assigned to a color condition. They were directed to review a scanned copy of an essay allegedly written by an undergraduate student for a communication course at their university that was evaluated by the course instructor. After reviewing the essay, the participants answered questions about their assessment of the essay, the student who allegedly wrote it, and the instructor who allegedly graded it. Participants then were debriefed as to the purpose of the study.
Experimental Stimuli and Design
Participants were randomly assigned to one of four levels of the independent variable, the color of the ink allegedly used by an instructor to provide feedback on a student’s essay (i.e., feedback in red, green, or black, or no feedback at all).
An undergraduate student’s essay previously written for a communication course was adapted to serve as the assignment reviewed by participants. The researchers shortened the essay and added spelling, grammatical, and logical errors. Using a fine-point marker, feedback was written in the margins, and other corrective markings were added within the text. This feedback was designed to lack obvious evaluative connotations. The student’s name, professor’s name, course number, and alleged grade were excised by overwriting them with black ink to give the impression that identifying information was removed to preserve student and instructor anonymity.
Measures
The variables that exhibited significant skewness were transformed to meet the assumptions of the general linear model. These transformations reduced skewness, and the transformed variables were used in the analyses that follow. When variables were transformed, both their transformed and original descriptive statistics are reported here, whereas statistics reported in the Results section reflect the transformed variables.
We measured emotional response in a number of ways. Participants answered questions about the emotions and emotionally laden impressions they imagined they would feel if they were the student receiving this instructor’s feedback on the assignment. A modified version of the scale used by Dillard, Plotnick, Godbold, Freimuth, and Edgar (1996) consisted of two items (1 = none of this feeling, 7 = a great deal of this feeling) used to assess each emotional impression. For each emotion, the relevant two items were averaged. These means were fear (afraid and scared, M = 3.81, SD = 1.67, α = .75), anger (angry and irritated, M = 3.94, SD = 1.44, α = .70), worry (anxious and worried, M = 4.61, SD = 1.52, α = .75), sadness (sad and happy, reverse coded, M = 5.29, SD = 1.27, α = .74), surprise (astonished and surprised, M = 3.34, SD = 1.43, α = .77), hope (encouraged and hopeful, M = 2.51, SD = 1.22, α = .74), shame (ashamed and guilty, M = 4.11, SD = 1.60, α = .69), and stupidity (stupid and smart, reverse coded, M = 5.14, SD = 1.31, α = .58). A principal components analysis (PCA) indicated that the eight emotion composites reflected two dimensions accounting for 70% of total variance. The first component represented overall negative emotion (eigenvalue = 4.10, accounting for 51% of the explained variance), and the second represented overall positive emotion (eigenvalue = 1.52, accounting for 19% of the explained variance). Because only one emotion (i.e., hope) strongly loaded on the second component, which accounted for a relatively small proportion of the total variance of the emotion composites, all 16 emotion items—two indicators for each of eight distinct emotions—were used as indicators for a single latent negative emotion construct for the structural equation model. We expected the hope indicator to have a negative loading on the latent emotion variable.
Participants assessed the essay in a number of ways.On 0 to 100 scales, participants indicated the grade they would assign to the essay as a percentage (M = 72.16, SD = 9.53) as well as the grade they estimated that the instructor gave to the essay as a percentage (M = 72.92, SD = 7.18). Participants reported their estimate of the number of errors in the essay (M = 16.93, SD = 10.34; transformed: M = 1.97, SD = 0.29). They also estimated the number of instructor comments that were negative (M = 7.97, SD = 5.36; transformed: M = 2.64, SD = 1.00), positive (M = 1.90, SD = 1.95; transformed: M = 1.06, SD = 0.88), and neutral (M = 4.03, SD = 4.15; transformed: M = 1.74, SD = 1.01). The sum of these estimates form the total number of instructor comments (M = 13.86, SD = 6.67; transformed sum: M = 3.61, SD = 0.90).2 Participants also responded to two items indicating the amount of comments the instructor gave on a 1 to 7 scale (few to many and a little to a lot), which were averaged to create a single score (M = 5.15, SD = 1.37, α = .94).
Essay engagement was assessed with a modified version of a message effectiveness scale (Mitchell, Brown, Morris-Villagran, & Villagran, 2001). Participants rated their agreement (1 = strongly disagree, 7 = strongly agree) on five items about whether the essay was interesting, enjoyable, logical, objective, and whether it held their attention (M = 3.30, SD = 1.04, α = .84). Essay quality was assessed with four 7-point semantic differential items modeled after general attitude measures (e.g., McCroskey & Richmond, 1989) about whether the student’s work was bad versus good, weak versus strong, foolish versus wise, and hard to understand versus easy to understand (M = 3.07, SD = 1.13, α = .86).
To assess the ability of the alleged author of the essay, participants indicated their agreement with four items modeled after McCroskey and Teven’s (1999) competence measure. Participants rated their agreement (1 = strongly disagree, 7 = strongly agree) with statements about the student seeming intelligent, to do well in college, capable, and logical (M = 3.57, SD = 1.11, α = .88).
Finally, participants rated their agreement with eight descriptors of the instructor modeled after McCroskey and Teven (1999): Participants rated their agreement (1 = strongly disagree, 7 = strongly agree) with statements about the instructor as negative, fair, critical, severe, careless, wrong, illogical, and subjective. A PCA indicated that two components accounted for 60% of the variance. The first component (eigenvalue = 3.10, accounting for 39% of the variance) represented the competence of the instructor. The second component (eigenvalue = 1.72, accounting for 21% of the variance) represented the severity of the instructor. The two factors align with previous research showing differences in instrumental and expressive assessments of instructors in response to the color used to assess students’ work (Dukes & Albanesi, 2013). These two component scores were used for group mean comparisons. Two latent constructs were used in the structural equations, with each latent construct consisting of the indicators that loaded most strongly on their relative component. The items fair, careless, wrong, illogical, and subjective formed the indicators of instructor competence, whereas the items severe, critical, and negative formed the indicators of instructor severity.
Structural Equation Modeling
Structural equation modeling was used to assess relationships among the latent variables and compare the fit of different models. Seven latent constructs, each with multiple indicators, were modeled to represent emotion (16 indicators), essay quality (four indicators), essay engagement (five indicators), essay grade (two indicators), attributions of student ability (four indicators), attributions of instructor competence (five indicators), and instructor severity (three indicators). A dummy code was assigned to the experimental manipulation of color (0 = green or black and 1 = red), and the variable’s measurement error variance was fixed to zero. Measured items served as indicators for the dependent latent variables, and a single loading for each latent construct was fixed to 1.00 to provide a metric. Finally, the measurement errors of three indicators that referenced whether the object was viewed as logical (i.e., one for essay quality, one for student ability, and one for instructor competence) were allowed to covary due to the expectation that that a general method effect would cause these indicators to covary.
color’s effect, which were compared according to the models’ parsimonious fit statistics. Four structural models were tested to assess competing explanations for the process by which the feedback color affected perceptions and emotional responses associated with receiving feedback on a graded assignment. The seven latent variables were divided into four panels of latent constructs: negative emotion, assessments of the essay (consisting of essay quality, essay engagement, and essay grade), attributions made about the student (student ability), and attributions made about the instructor (consisting of instructor competence and instructor severity).
Results
Manipulation Fidelity and Induction Checks
After all the items assessing the essay, the student-author, and the instructor were completed, participants were asked if they were colorblind. Those who responded affirmatively then indicated on a checklist the colors that they were unable to distinguish. No participants who indicated an inability to see red or to confuse red with another color had been randomly assigned to the red condition, and no participants who indicated an inability to see green or to confuse green with another color had been randomly assigned to the green condition.
A chi-square test was conducted to assess whether participants exposed to red, green, or black feedback correctly reported the color in which the feedback was written. Results indicated an overwhelming percentage of participants correctly reported the color of feedback to which they were exposed, 2(1, N = 140) = 97.88, p < .001, φ2 = .70. Thus, the manipulation was deemed to be successful.
Does the Presence of Feedback Matter?
Does the Particular Color of the Feedback Matter?
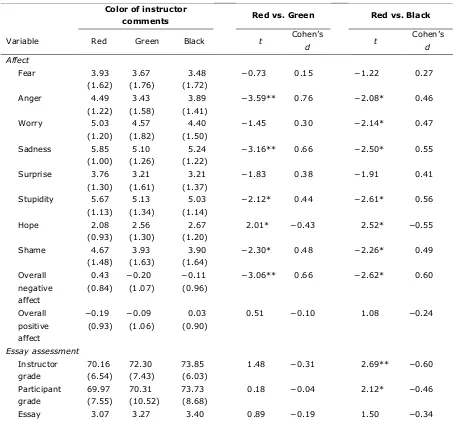
We hypothesized that feedback in red, as compared with green or black, would negatively affect perceptions of the student’s essay, the student, and the instructor. Green and black were not expected to be different, so predictions emphasized how these colors independently related to red. Independent-sample t tests were conducted to assess whether the red condition significantly differed from the black condition and from the green condition on the dependent variables. Table 1 reports these results.
Table 1. Means (Standard Deviations) of Responses to Essay by Color of Feedback.
Color of instructor
comments Red vs. Green Red vs. Black
engage (1.02) (1.13) (0.95)
Feedback in red, in comparison to green, caused participants to imagine being more angry, more sad, more stupid, less hopeful, and more shamed if they were the student-author. The participants imagined feeling more negative emotion overall. Feedback in red, in comparison to black, caused participants to imagine being more angry, more worried, more sad, more stupid, less hopeful, and more shamed if they were the student-author. The participants imagined feeling more negative emotion overall. These findings supported H1: Compared with feedback in green or black, feedback from an instructor that was in red caused participants to experience more negative emotions when imagining themselves as the student receiving the feedback.
Feedback in red, as compared with feedback in green, resulted in the perception that the instructor gave the essay more total comments overall.3 Feedback in red, as compared with feedback in black, resulted in the perception that the essay would receive a lower grade from the instructor, and the
participant also assigned it a lower grade as well; that the essay was of lower quality; that the essay was of lower quality; and that the instructor gave the essay more comments overall. Particularly for the red– black comparison, these results provided support for H2: Feedback from an instructor that was in red caused the student’s work to be perceived to be of lower quality.
Red, in comparison to black, caused the student-author to be viewed as less capable. These findings partially supported H3: Compared with feedback in black, feedback from an instructor that was in red caused the student who wrote the essay to be perceived to have lower ability. However, the green– red comparison, while trending in the expected direction, was not significant.
Feedback in red, as compared with feedback in green, caused no difference in the perception of the instructor as either more incompetent or more severe. However, feedback in red, as compared with feedback in black, led to the perception of the instructor being significantly less severe. These findings did not support H4: Compared with feedback in green or black, feedback from an instructor that was in red did not cause the instructor who graded the essay to be perceived to be more critical. Red, compared with black, actually appeared to cause the instructor to be viewed as less critical.
RQ2 asked whether the feedback in green differed from the feedback in black on our variables of interest. To answer this question, an analysis of variance with the three color conditions entered as levels of the independent variable was conducted for a post hoc examination of the green versus the black conditions. Bonferroni post hoc tests indicated that, although the differences between the red condition and the black and green conditions were consistent with the results reported above, there were no significant differences between the green and black conditions on any outcomes.
Model Testing
The fifth hypothesis predicted that negative emotion would mediate the effect of color on perceptions regarding the essay, the student, and the instructor. Feedback color, the experimental variable, was treated as a dummy variable, with red = 1 and green or black = 0. A number of competing causal models using the experimental variable and seven latent constructs were assessed and compared. The dependent variables were divided into four panels (consisting of a total of seven latent constructs): (1) latent negative emotion, (2) assessments of the essay (consisting of latent essay quality, latent essay engagement, and latent essay grade), (3) attributions made about the student (consisting of latent student ability), and (4) attributions made about the instructor (consisting of latent instructor competence and latent instructor severity). The different causal structures with which these constructs were modeled are detailed below.
A confirmatory factor analysis of the measurement model representing the aforementioned latent constructs resulted in acceptable model fit, 2(434, N = 138) = 760.44, p < .001, 2/df = 1.75, RMSEA = .07, 90% CI [.065, .082], CFI = .95, SRMR = .09.
to specify the causal ordering among the endogenous variables. The errors of prediction of all seven endogenous latent constructs were allowed to covary. Thus, this model estimated the same parameters as were predicted in the measurement model and therefore results in identical acceptable fit statistics,
2
(434, N = 138) = 760.44, p < .001, 2
/df = 1.75, RMSEA = .07, 90% CI [.065, .082], CFI = .95, SRMR = .09.
The second model ordered the latent variables to correspond to their sequence on the questionnaire. This model treated potential mediation as a methodological artifact of the data collection process. The idea was that responses to later items were assumed to reflect the effect due to the prior assessments. The survey was originally arranged according to the specificity of the information being assessed on each scale, with items assessing the essay preceding the items assessing the student, the emotional responses, and finally, the instructor. Thus, a serial mediation model was constructed (feedback color essay assessments student attributions emotion instructor attributions); the error of prediction terms among three latent constructs within the essay assessments panel and two latent constructs within the instructor attributions panel were allowed to covary. This model had marginally acceptable fit, 2(449, N = 138) = 818.52, p < .001, 2/df = 1.82, RMSEA = .08, 90% CI [.069, .086], CFI = .95, SRMR = .13.
The third model accounted for the basic theoretical relationship suggested by attribution theory and color-in-context theory, whereby negative emotion mediates the relationship between color and perceptions. A single-stage mediation model was constructed, with negative emotion intervening between the feedback color manipulation on the other perceptual assessments (feedback color emotion essay assessments, student attributions, and instructor attributions); the error of prediction terms of the six latent constructs in the final panel were allowed to covary. This model had acceptable fit, 2(440, N = 138) = 765.44, p < .001, 2/df = 1.74, RMSEA = .07, 90% CI [.065, .082], CFI = .95, SRMR = .09.
Model Comparison and Selection
The Akaike information criterion (AIC; Akaike, 1974) and Bayesian information criterion (BIC; Schwarz, 1978) were used to assess the success of each structural model in fitting the data. AIC and BIC values allow for comparison of nonnested models, with the latter imposing a more severe penalty for model complexity. Burnham and Anderson (2002) indicated that AIC differences greater than 3.0 provide positive evidence of model nonequivalency, with the lower value indicating the superior model. Kass and Raftery (1995) noted that BIC differences greater than 6.0 serve as strong evidence that the model with the lower value is superior. The fourth model, which tested the observer’s attribution effect, had lower AIC (5,838.33) and BIC (6,081.30) values compared with the first (nonmediation) model (AIC = 5,847.20, Model 4 difference = 8.87; BIC = 6,122.36, Model 4 difference = 41.06), the second (questionnaire order-effects mediation) model (AIC = 5,875.28, Model 4 difference = 36.95; BIC = 6,106.54, Model 4 difference = 25.24), and the third (emotion-as-mediator) model (AIC = 5,840.20, Model 4 difference = 1.87; BIC = 6,097.79, Model 4 difference = 16.49). Taken together, these results provide strong evidence for the superiority of the observer’s person-attribution model, and this model is displayed in Figure 2. Thus, H5 was supported, with emotion mediating the effect of color on attributions.
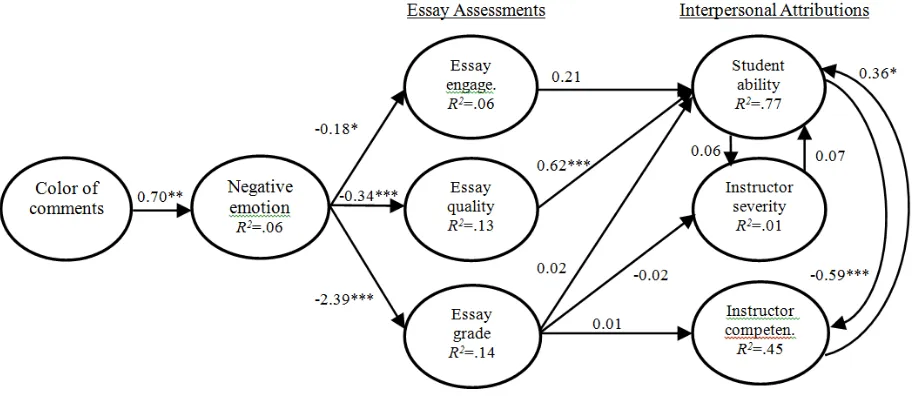
Figure 2 shows the results, and the significant unstandardized relationships are reported. Red feedback significantly increased the experience of negative emotion (B = 0.70). Negative emotion significantly caused a reduction in essay grade (B = −2.39), essay quality (B = −0.34), and essay engagement (B = −0.18). Student ability was significantly affected by essay quality (B = 0.62). Essay grade did not have a significant association with student ability, instructor severity, or instructor competence. Finally, student ability caused a reduction in perceived instructor competence (B = −0.59), and instructor competence caused an increase in perceived student ability (B = 0.36), but neither causal path between student ability and instructor severity was significant. No modification indices suggested adding any paths that would significantly improve model fit.4
Discussion
This study assessed the effect of color used by instructors when providing feedback to students on graded assignments. Results showed that red feedback, as compared with green or black feedback, caused a negative emotional response and negative evaluative attributions toward the student-author. Model tests indicated that red indirectly led to perceptions of poorer quality work and a poorer quality student and, subsequently, a more competent instructor. This research has both theoretical and practical implications for specific instructional contexts as well as for general contexts when written messages are used.
Figure 2. Structural equation model.
Coefficients are unstandardized estimates. Errors of the three latent essay assessment variables were allowed to covary, and errors of the two instructor attribution variables were allowed to covary, although these covariances do not appear in this representation of the model. Color was coded so 0 = black or green and 1 = red. *p < .05. **p < .01. ***p < .001, two-tailed.
Our findings add to the body of theoretical knowledge about how people respond to color in achievement contexts. These results agree with previous research regarding associations between red and failure in achievement settings (Moller et al., 2009). Written communication given in red appears to affect perceptions of a student’s intellectual ability, as evidenced by lower grade estimates, lower perceived essay quality, and lower perceived student ability. Students appear to judge their peers to be less intelligent because of feedback in red, just as actual intelligence has been shown to suffer after exposure to the color (e.g., Elliot et al., 2007). These findings largely replicate previous research on the effects of instructor feedback written in red versus aqua (Dukes & Albanesi, 2013). However, contrary to Dukes and Albanesi, our data suggest that negative attributions were directed toward the student rather than instructor, with instructors using red ink being perceived as less severe than instructors using black ink. Further evidence for this unexpected finding—red caused students, but not instructors, to be perceived negatively—emerged in the emotion-attribution model, which we will now discuss.
perceptions positively influenced attributions of a student’s ability. In short, red elicited more negative attributions toward a student-peer through emotion and subsequent essay assessments. We also found that the effect of red on negative emotions does not translate into general negative interpersonal attributions: Our model showed that red feedback had a positive indirect effect on attributions of instructor competence. The nonrecursive student-instructor link indicates that the positive perceptions of student ability results in a decrease in the perceived competence of the instructor, whereas the perceptions of a highly competent instructor increases perceived student ability. Such a finding qualifies previous research on this issue: Whereas Dukes and Albanesi (2013) found that red diminished positive attributions toward an instructor, our model showed this to be the case in regard to instructor competence only when students were first perceived as capable.
Asking participants to make attributions about the student and the instructor provided insightful details regarding how color affects interpersonal attributions. We predicted that red would elicit greater negative attributions toward both the student and instructor. Instead, we found that red indirectly lowered attributions of the student’s ability, but it indirectly increased attributions of the instructor’s competence. It appears that when feedback is in red, the academic work and the student’s ability are perceived as worse, but this lower quality is attributed to the student rather than to the instructor. That is, with red feedback, instructors are perceived as more competent when the quality of the work and capability of the student are perceived to be poor. In regard to black feedback, with the work being perceived as having better quality and the student as having greater aptitude, the very same feedback given by an instructor is perceived as indicating less instructor competence. These data provide support for color-in-context theory (Elliot & Maier, 2012) by emphasizing the importance of context when interpreting color’s effect. Further, these findings extend color-in-context theory by identifying a boundary condition in regard to the effect of red on dependent multiperson attributions. Instead of red eliciting attributions of negativity across the board, the negativity associated with an instructor is understood in light of the negativity associated with other elements (here, the essay and student) in the situation. These results provide insight into observer attributions because students appeared to think that the instructional feedback was justified when the student was viewed as less competent due to feedback in red.
(Smith & King, 2004). Similarly, it is possible that red ink negatively affects students with high feedback sensitivity and not those who are less sensitive.
Ours findings suggest that educators may be in a double bind regarding the color to use to provide written feedback, given concerns for their saving their own face and their students’ face. Using red may lead students to feel worse about their abilities, but they also perceive the instructor to be less severe. Using black (and, to a lesser extent, green) for feedback may lead students to feel better about their abilities, but they also perceive the instructor to be more severe. Instructors should be prepared with facework strategies in both situations, by supporting students after using red or by facilitating one’s own reputation of kindness after using green.
As in all research, this study has some limitations. First, some may question the ecological validity of this study because students were asked to evaluate another student’s essay rather than their own. It is possible that students respond differently after reading feedback about their own academic work compared with a peer’s. For example, students attribute positive instructional feedback internally, but negative instructional feedback externally (Booth-Butterfield, 1989), so red feedback may not lead to lower perceptions of student aptitude when evaluating oneself. However, the present context of student-observers retains a level of ecologically validity: It is reasonable and consistent with our experience to assume that students share and compare their graded assignments, which result in observer assessments of classmates and instructors.
This study limited its color choices to red, green, and black, although there are other colors that teachers use to grade. It is possible that our findings are color specific, and the differences between red and green or black may not translate into feedback given in other colors, like blue and purple, or alternative shades of the colors tested here, like maroon, turquoise, or gray. Further, because the study was conducted online, participants used different computers to complete the task. Thus, it is possible that computer monitors’ color settings varied such that people within the same experimental condition saw slightly different hues. That participants were randomly assigned to color conditions somewhat minimizes this issue, as systematic variations in hue between conditions were unlikely. Because of the importance of systematizing hue presentation in color research (Elliot & Maier, 2014), future studies should use greater control when exposing participants to color conditions.
We sought to clarify the mechanism by which the color of instructional feedback influences students’ perceptions. Color directly affected emotion, which then had cognitive and interpersonal effects. This research supports the notion that red does indeed prompt negative emotion, which in turn acts as a catalyst for making attributions toward others. However, as was shown in this particular context of students’ perceptions of instructional feedback, not all interpersonal attributions in response to red in achievement contexts need be negative.
References
Akaike, H. (1974). A new look at the statistical model identification. IEEE Transactions on Automatic Control, 19, 716–723. doi:10.1109/TAC.1974.1100705
Bertrams, A., Baumeister, R. F., Englert, C., & Furley, P. (2015). Ego depletion in color priming research: Self-control strength moderates the detrimental effect of red on cognitive test performance. Personality and Social Psychology Bulletin, 41, 311–322. doi:10.1177/0146167214564968
Booth‐Butterfield, M. (1989). The interpretation of classroom performance feedback: An attributional approach. Communication Education, 38, 119–131. doi:10.1080/03634528909378745
Brooker, A., & Franklin, A. (2016). The effect of colour on children’s cognitive performance. British Journal of Educational Psychology, 86, 241–255. doi:10.1111/bjep.12101
Burnham, K. P., & Anderson, D. R. (2002). Model selection and multimodel inference: A practical information-theoretic approach (2nd ed.). New York, NY: Springer-Verlag.
Dillard, J. P., Plotnick, C. A., Godbold, L. C., Freimuth, V. S., & Edgar, T. (1996). The multiple affective consequences of AIDS PSAs: Fear appeals do more than scare people. Communication Research, 23, 44–72. doi:10.1177/009365096023001002
Dukes, R. L., & Albanesi, H. (2013). Seeing red: Quality of an essay, color of the grading pen, and student reactions to the grading process. Social Science Journal, 50, 96–100.
doi:10.1016/j.soscij.2012.07.005
Elliot, A. J., & Maier, M. A. (2012). Color-in-context theory. In P. Devine & A. Plant (Eds.), Advances in experimental social psychology (Vol. 45, pp. 61–125). New York, NY: Academic Press. doi:10.1016/B978-0-12-394286-9.00002-0
Elliot, A. J., Maier, M. A., Binser, M. J., Friedman, R., & Pekrun, R. (2009). The effect of red on avoidance behavior in achievement contexts. Personality and Social Psychology Bulletin, 35, 365–375. doi:10.1177/0146167208328330
Elliot, A. J., Maier, M. A., Moller, A. C., Friedman, R., & Meinhardt, J. (2007). Color and psychological functioning: The effect of red on performance attainment. Journal of Experimental Psychology: General, 136, 154–168. doi:10.1037/0096-3445.136.1.154
Elliot, A. J., & Pazda, A. D. (2012). Dressed for sex: Red as a female sexual signal in humans. PLoS ONE, 7, e34607. doi:10.1371/journal.pone.0034607
Feltman, R., & Elliot, A. J. (2011). The influence of red on perceptions of dominance and threat in a competitive context. Journal of Sport & Exercise Psychology, 33, 308–314.
Fetterman, A. K., Robinson, M. D., Gordon, R. D., & Elliot, A. J. (2011). Anger as seeing red: Perceptual sources of evidence. Social Psychological & Personality Science, 2, 311–316.
doi:10.1177/1948550610390051
Gnambs, T., Appel, M., & Batinic, B. (2010). Color red in Web-based knowledge testing. Computers in Human Behavior, 26, 1625–1631. doi:10.1016/j.chb.2010.06.010
Hagemann, N., Strauss, B., & Leißing, J. (2008). When the referee sees red. . . . Psychological Science, 19, 769–771. doi:10.1111/j.1467-9280.2008.02155.x
Heider, F. (1958). The psychology of interpersonal relations. New York, NY: John Wiley & Sons.
Houtman, F., & Notebaert, W. (2013). Blinded by an error. Cognition, 128, 228–236. doi:10.1016/j.cognition.2013.04.003
Kass, R. E., & Raftery, A. E. (1995). Bayes factors. Journal of the American Statistical Association, 90, 773–795. doi:10.2307/2291091
Knapp, M. L., Hall, J. A., & Horgan, T. G. (2014). Nonverbal communication in human interaction (8th ed.). Boston, MA: Wadsworth.
Little, A., & Hill, R. A. (2007). Attribution to red suggests special role in dominance signaling. Journal of Evolutionary Psychology, 5, 161–168. doi:10.1556/JEP.2007.1008
Maier, M. A., Elliot, A. J., & Lichtenfeld, S. (2008). Mediation of the negative effect of red on intellectual performance. Personality and Social Psychology Bulletin, 34, 1530–1540.
McCroskey, J. C., & Richmond, V. P. (1989). Bipolar scales. In P. Emmert & L. L. Barker (Eds.), Measurement of communication behavior (pp. 154–167). New York, NY: Longman.
McCroskey, J. C., & Teven, J. J. (1999). Goodwill: A reexamination of the construct and its measurement. Communication Monographs, 66, 90–103. doi:10.1080/03637759909376464
Mitchell, M. M., Brown, K. M., Morris-Villagran, M., & Villagran, P. D. (2001). The effects of anger, sadness and happiness on persuasive message processing: A test of the negative state relief model. Communication Monographs, 68, 341–359. doi:10.1080/03637750128070
Moller, A. C., Elliot, A. J., & Maier, M. A. (2009). Basic hue-meaning associations. Emotion, 9, 898–902. doi:10.1037/a0017811
Rutchick, A. M., Slepian, M. L., & Ferris, B. D. (2010). The pen is mightier than the word: Object priming of evaluative standards. European Journal of Social Psychology, 40, 704–708.
doi:10.1002/ejsp.753
Schwarz, G. E. (1978). Estimating the dimension of a model. Annals of Statistics, 6, 461–464. doi:10.1214/aos/1176344136
Shavit, T., Rosenboim, M., & Cohen, C. (2013). Does the color of feedback affect investment decisions? International Journal of Applied Behavioral Economics, 2, 15–26. doi:10.4018/ijabe.2013070102
Smith, C. D., & King, P. E. (2004). Student feedback sensitivity and the efficacy of feedback interventions in public speaking performance improvement. Communication Education, 53, 203–216.
doi:10.1080/0363452042000265152
Sorokowski, P., & Szmajke, A. (2007). How does the “red win” effect work? The role of sportswear colour during sports competitions. Polish Journal of Applied Psychology, 5, 71–79.
Sorokowski, P., & Szmajke, A. (2011). The influence of the “red win” effect in sports: A hypothesis of erroneous perception of opponents dressed in red—a preliminary test. Human Movement, 12, 367–373. doi:10.2478/v10038-011-0043-5
Tanaka, A., & Tokuno, Y. (2011). The effect of the color red on avoidance motivation. Social Behavior and Personality, 39, 287–288. doi:10.2224/sbp.2011.39.2.287
Ten Velden, F. S., Baas, M., Shalvi, S., Preenen, P. T., & De Dreu, C. K. (2012). In competitive interaction displays of red increase actors’ competitive approach and perceivers’ withdrawal. Journal of Experimental Social Psychology, 48, 1205–1208. doi:10.1016/j.jesp.2012.04.004
Turvill, W. (2014, March 19). School bans red ink and tells teachers to mark in green instead (and get pupils to respond in purple). Daily Mail. Retrieved from http://www.dailymail.co.uk/news/article-2584672/School-bans-red-ink-tells-teachers-mark-green-instead-pupils-respond-purple.html
Weiner, B. (1986). An attributional theory of motivation and emotion. New York, NY: Springer-Verlag.