T H E J O U R N A L O F H U M A N R E S O U R C E S • 47 • 4
Disability, Earnings, and Divorce
Perry Singleton
A B S T R A C T
This study measures the longitudinal effect of disability on earnings, mar-riage, and divorce. The data come from the Survey of Income and Program Participation matched to administrative data on longitudinal earnings. Us-ing event-study methods, the results show that the onset of a work-prevent-ing disability is associated with a precipitous decline in earnwork-prevent-ings and an increase in divorce. Consistent with theory, the association between dis-ability and divorce is greatest among young and educated males who expe-rience a work-preventing, rather than a work-limiting, disability.
I. Introduction
An important motivation for marriage is to insure against shocks to earnings and health (Stevenson and Wolfers 2007). For example, marriage may in-sure against financial hardship (Di Tella and MacCulloch 2002; Hess 2004; Weiss 1997), longevity (Kotlikoff and Spivak 1981), and accidents or injuries (Arnott and Stiglitz 1991). At the same time, shocks to earnings and health are considered a major catalyst for divorce (Becker, Landes, and Michael 1977). Thus, it remains unclear whether marriages—and the promises of insurance that sustain them—are robust, particularly during times of adversity.
To address this question for a specific but important case, this study examines whether a marriage is more likely to dissolve due to the onset of a work-limiting
Perry Singleton is an assistant professor of economics at Syracuse University and a senior research as-sociate at the Center for Policy Research, Syracuse University. For helpful comments and suggestions, the author would like to thank Kimberly Burham, Richard Burkhauser, Mark Duggan, Jeffrey Kubik, Joyce Manchester, Bruce Meyer, David Pattison, Elizabeth Powers, Christopher Rohlfs, Seth Sanders, Mircea Trandafir, four anonymous referees, and seminar participants at Cornell University and the Uni-versity of Illinois at Urbana-Champaign. This research is financially supported by a Steven H. Sandell Grant, which is administered by the Center for Retirement Research at Boston College and funded by the U.S. Social Security Administration. All comments and errors are the authors and do not reflect the views of the Social Security Administration. The survey data used in this article can be obtained begin-ning May 2013 after publication through April 2016 from Perry Singleton; Syracuse University; 426 Eggers Hall; Syracuse, NY 13202; psinglet@syr.edu. Instructions on obtaining the administrative data used in this article can be requested from Perry Singleton.
[Submitted March 2011; accepted November 2011]
disability. In the United States, nearly one-fifth of male heads-of-household between the ages of 22 and 64 report being disabled (Meyer and Mok 2008), yet the economic welfare of the disabled is one of the most understudied topics in labor economics (Burkhauser, Moffit, and Scholz 2010). Ostensibly, marriage is intended to insure against disabilities, as couples often vow to remain together “in sickness and in health.” But if a disability is unanticipated, or has a large effect on marital value, then a disability may precipitate divorce.
The main data come from topical module two of the Survey of Income and Program Participation, panel years 1990 through 1996. These data contain retro-spective information on marriage, divorce, and disability onset. The SIPP data are matched to administrative data on longitudinal earnings, maintained by the Social Security Administration. The administrative data, named the Detailed Earnings Rec-ord, are useful to examine the longitudinal effect of disability on earnings. The study focuses on shocks to males, similar to most economic studies on marital instability, though the results for females are briefly discussed.
Using event-study methods, the results show that the effect of disability onset on divorce is greatest among males who experience a work-preventing, rather than a work-limiting, disability. Moreover, the effect of a work-preventing disability is greatest among males who are younger and more educated. The results are robust to controls for the type of disabling condition, which is shown to vary by age and education. The results are consistent with the proposed model of disability and di-vorce, as the young and educated have greater expected earnings, longer remaining work-years, and a lower incidence of disability onset. To suggest that the results are not driven by reverse causation, they are compared to a recent study on divorce and mental stress.
The results differ from those of Charles and Stephens (2004), who find no asso-ciation between disability onset and divorce. The difference in findings may reflect that Charles and Stephens, using the Panel Survey of Income Dynamics, measure the effect of disability on divorce across all marriages, regardless of disability se-verity.1A similar result occurs when using the SIPP: When the effect of any dis-ability is estimated among the full sample, regardless of severity, the result is sta-tistically insignificant (not shown). Thus, this study suggests that measuring the effects of shocks on divorce at the population level may obscure heterogeneous effects at sublevels, especially if the shocks occur predominately among those whose divorce decisions change the least; in this case, disability onset among the aged. This study shows that disability not only affects divorce in some cases, but does in a manner consistent with theory.
II. Background
A. Conceptual Framework of Marriage and Divorce
The conceptual framework of marriage and divorce is developed respectively by Becker (1974) and Becker, Landes, and Michael (1977). According to Becker,
riage occurs if the joint benefit of marriage exceeds the joint benefit of remaining single. The proposition is premised on the notion that welfare is transferable between spouses. If the welfare of each partner increases independently upon marriage, then both partners agree to marry without the need for transfers. If the welfare of one partner declines, then one partner can transfer welfare to the other such that both partners agree to marry. This framework lends to the prevailing model of marital instability: Divorce occurs when the combined benefit of separating exceeds the combined benefit of remaining married.
From these models, Becker, Landes, and Michael (1977) raise an important ques-tion: What factors determine the gains from marriage to explain the observed patterns of divorce? The authors discuss two factors. The first factor is initial match quality. Intuitively, a union between any two individuals yields a level of match quality, and only couples whose quality surpasses a specific threshold will result in marriage. However, this threshold declines as search costs to finding a mate increase or traits for a successful match become harder to find. Lower-quality marriages, in turn, are more susceptible to divorce. The second factor is that the value of marriage is dynamic and uncertain, so individuals must rely on expectations of value when deciding to marry. Over time, however, the expected value of marriage may deviate from the realized value. These deviations, referred to as “shocks” in the literature, affect the value of marriage and the value of outside alternatives such that any shock—for better or for worse—increases the likelihood of divorce.
B. Disability and Divorce
The theory of marital instability provides a framework for a dynamic model of disability and divorce. The model presented here is similar to the models of Weiss and Willis (1997) and Charles and Stephens (2004). In the model, the dynamic value of marriage between individualsi andjis defined by the function ϕ(gi,gj), where is a disability status indicator that equals one if disabled and zero otherwise. g
Disability onset decreases marital wealth by affecting the ability to earn income and to produce in the home. Other factors that affect the value of marriage, such as education and religiosity, are suppressed for brevity. The dynamic value of the al-ternatives to marriage is given by the termsAi(gi,gj)andAj(gi,gj), which also de-crease with disability onset. According to Becker (1974), marriage occurs if and only ifϕ(gi,gj)≥Ai(gi,gj) +Aj(gi,gj).
To characterize the effect of disability on divorce, the value of marriage is sepa-rated into its contemporaneous and future value:
∗ ∗ ∗
ϕ(gi,gj) =V(gi,gj) +ΩEt
{
max[
ϕ (gi,gj),Ai(gi,gj) +Aj(gi,gj)] }
.The first term is the contemporaneous value of marriage and is known with certainty; the second term is the future value of marriage—discounted by the factorΩ—and is known with uncertainty. As shown, the future value of marriage reflects the option to divorce next period. According to the framework of marital instability, divorce is expected if
∗ ∗ ∗
The realized divorce decision may deviate from the expected decision due to the onset of a work-limiting disability. Without additional constraints, the effect of dis-ability on divorce is ambiguous because a disdis-ability decreases both the value of the current marriage and the value of outside alternatives. However, the framework of Becker, Landes, and Michael (1977) suggests that the effect of disability on divorce is nonnegative, as the decline in the value of marriage would exceed the decline in the value of outside alternatives.2
The magnitude of the effect depends in part on the deviation between the expected and realized values of marriage. To characterize this deviation due to a disability, three assumptions are made: No one is initially disabled, the likelihood that person becomes disabled is zero, and the incidence of disability for person is . In this
j i di
case, expected marital value is
∗ ∗
diϕ (1,0) + (1−di)ϕ (0,0);
and if person becomes disabled, realized marital value is ∗ . Thus, the
dif-i ϕ (1,0)
ference between the expected and realized value is given by,
∗ ∗
(1−di)
[
ϕ (0,0)−ϕ (1,0)]
.This term is positive because0≤ and ∗ ∗ . According to Becker, di≤1 ϕ (0,0) >ϕ (1,0)
Landes, and Michael (1977), as this term increases, so too does the effect of dis-ability on divorce.
This term has two implications for the effect’s magnitude. First, the expected value of marriage reflects the likelihood of disability onset, so unanticipated disabilities, measured by the incidence of disabilitydi, have a greater effect on marital value than anticipated disabilities. Second, the effect of disability on divorce increases with dis-ability severity, measured by the change in marital value
[
∗ ∗ .Ac-ϕ (0,0)−ϕ (1,0)
]
cording to the equation above, disability incidence and disability severity interact, so disability’s greatest effect on divorce occurs when disability has a large effect on marital value and is unanticipated.
While the effect of disability on divorce depends on the decline in marital value, the divorce decision ultimately depends on whether the decline leaves the value of marriage lower than the value of outside alternatives. Thus, given the same incidence and severity of disability, lower-quality marriages are more likely to dissolve than higher-quality marriages.
III. Data
A. Survey Description and Sample Selection
The empirical objective is to estimate the dynamic associations between disability, earnings and divorce. The data come from the Survey of Income and Program
ticipation (SIPP), which is representative of the noninstitutionalized U.S. population. To increase the sample size, SIPP data are pooled from panel years 1990, 1991, 1992, 1993, and 1996. Subsequent panels in 2001 and 2004 are not used because they do not differentiate work limitations by severity. Demographic information, marriage histories, and divorce histories come from topical module two of the panel, which corresponds with the panel’s eighth month.
In regards to disability, respondents first report whether they have a health con-dition that limits the kind or amount of work they can do and, if so, the month and year in which it began. Work-limited respondents then report whether the condition prevents them from working at a job or business and, if so, the month and year in which they became unable to work. The SIPP measure of disability, defined by the ability to work, is similar to the measure used by Charles and Stephens (2004) using the Panel Survey of Income Dynamics. Because the precise timing of the work limitation or prevention is essential for the analysis, observations are dropped if the dates of disability onset are missing. Of the 5,020 disabled male respondents between the ages of 30 and 54, 662 respondents (13.2 percent) have missing disability onset dates.
In regards to marriage, respondents report the number of previous marriages and the dates of marriage, separation, and divorce. The module collects information for up to three marriages, so respondents who report four or more marriages are dropped. This restriction eliminates less than 1 percent of the sample.
To examine the effect of disability on earnings, the data are matched to the De-tailed Earnings Record (DER). The data, which come from the Social Security Ad-ministration, report earnings on an annual basis from 1978 to 2004. Earnings are measured as the sum of taxable wage earnings, taxable self-employment earnings, and income deferred to 401(k) or similar type accounts.3 When these data are re-quired, the sample is necessarily restricted to SIPP respondents matched to admin-istrative records, which depends on whether the respondent consented to the match.4 The dynamic association between disability, earnings and divorce is examined using event-study methods. Under this method, the association is measured longi-tudinally by the change in earnings and divorce around the time of disability onset. Because of the methodology, and because the disability and marriage data are ret-rospective, two restrictions to the sample are imposed. First, the disabled sample is restricted to males whose first disability occurs within seven years of the survey year. This ensures at least five years of earnings before disability onset—the earliest SIPP year is 1990, and the earliest year of earnings is 1978, leaving five years of predisability earnings for those disabled in 1983. This restriction also reduces mea-surement error in the dates of marriage, divorce, and disability onset, because the period of recall is shorter. Second, disabled respondents are dropped if the first onset of disability occurs during the same year in which the survey was conducted. This is because, for these respondents, the divorce outcome is not observed during the full calendar year of disability onset, as the data used for the analysis are entirely
retrospective.5 These two restrictions reduce the disabled sample from 4,358 to 2,196. Additionally, the sample is restricted to males whose age is 30 to 54 during the reference year. For the disabled, the reference year is the year of disability onset; for the nondisabled, it is the sixth year before the survey. The final sample consists of 30,809 nondisabled respondents and 1,951 disabled respondents.
As mentioned, the analysis relies solely on retrospective data on disability and marriage and does not use data recorded during the SIPP panel. The first reason is that few transitions from nondisabled to disabled occur during the panel, as some panels are less than three years in length. Additionally, if disability has a lagged effect on divorce, then some divorces may not be observed. The second reason is sample attrition, where a large number of respondents exit the survey nonrandomly with each successive wave.6Sample attrition poses serious econometric problems if attrition is related to life altering events such as disability onset or divorce.
B. Sample Summary
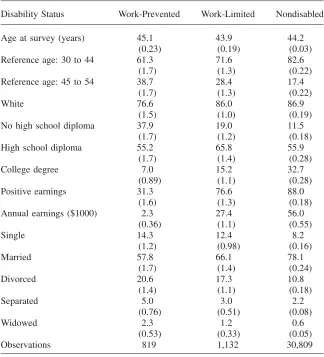
Table 1 presents sample statistics for three mutually exclusive groups: the work-prevented, the work-limited, and the nondisabled. The table shows that, compared to the nondisabled, the disabled are less likely to be white or educated. The disabled are also less attached to the labor force. According to earnings data from the DER, while an estimated 31.3 percent of work-prevented respondents have positive earn-ings, their average earnearn-ings, including zeros, is only $2.3 thousand (in 2004 dollars). In comparison, 88.0 percent of nondisabled respondents have positive earnings, av-eraging $56.0 thousand.
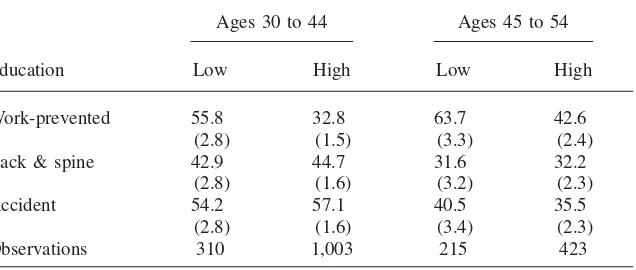
The disabled also fare poorly in the marriage market. According to Table 1, the disabled are less likely to be married and more likely to be single, divorced, sepa-rated, or widowed. On one hand, the association between disability and divorce may reflect causal characteristics that lead to both disability onset and divorce; for ex-ample, carelessness or low risk-aversion. On the other hand, the association may reflect the causal effect of disability on divorce through its effect on marital value. The event-study methodology proposed here, which measures the discrete change in divorce at the time of disability onset, attempts to disentangle these two mechanisms. Table 2 presents summary statics on the disabling condition by education and age, conditional on being work limited or work prevented. The first row reports the prevalence of work-preventing, rather than work-limiting, disabilities; the second row reports the prevalence of disabilities related to the back or spine; and the third row reports the prevalence of accidental disabilities. As shown, the prevalence of work-preventing disabilities is greater among the less educated and the aged, whereas the prevalence of disabilities related to the back or spine and accidental disabilities are more common among the young.
5. For example, rotation group one of the 1996 panel was interviewed for topical Module 2 in July of 1996, and some respondents reported becoming disabled in January to July of 1996. For these respondents, divorce is not observed retrospectively for the 1996 calendar year.
Table 1
Sample Summary by Work Disability: Males Reference Ages 30 to 54
Disability Status Work-Prevented Work-Limited Nondisabled
Age at survey (years) 45.1 43.9 44.2
(0.23) (0.19) (0.03)
Reference age: 30 to 44 61.3 71.6 82.6
(1.7) (1.3) (0.22)
Reference age: 45 to 54 38.7 28.4 17.4
(1.7) (1.3) (0.22)
White 76.6 86.0 86.9
(1.5) (1.0) (0.19)
No high school diploma 37.9 19.0 11.5
(1.7) (1.2) (0.18)
High school diploma 55.2 65.8 55.9
(1.7) (1.4) (0.28)
College degree 7.0 15.2 32.7
(0.89) (1.1) (0.28)
Positive earnings 31.3 76.6 88.0
(1.6) (1.3) (0.18)
Annual earnings ($1000) 2.3 27.4 56.0
(0.36) (1.1) (0.55)
Single 14.3 12.4 8.2
(1.2) (0.98) (0.16)
Married 57.8 66.1 78.1
(1.7) (1.4) (0.24)
Divorced 20.6 17.3 10.8
(1.4) (1.1) (0.18)
Separated 5.0 3.0 2.2
(0.76) (0.51) (0.08)
Widowed 2.3 1.2 0.6
(0.53) (0.33) (0.05)
Observations 819 1,132 30,809
Data: Survey of Income and Program Participation, panels 1990 through 1996.
Note: For the disabled, the reference year is the year of first disability onset; for the nondisabled, the reference year is the sixth year prior to the survey. Annual earnings (in 2004 dollars) come from the Detailed Earnings Record and correspond with the calendar year of the survey. All figures are in percent, unless otherwise noted. Standard errors are in parentheses.
IV. Results
A. Graphical Analysis
Table 2
Nature of Work Disability by Age and Education: Males Reference Ages 30 to 54
Ages 30 to 44 Ages 45 to 54
Education Low High Low High
Work-prevented 55.8 32.8 63.7 42.6
(2.8) (1.5) (3.3) (2.4)
Back & spine 42.9 44.7 31.6 32.2
(2.8) (1.6) (3.2) (2.3)
Accident 54.2 57.1 40.5 35.5
(2.8) (1.6) (3.4) (2.3)
Observations 310 1,003 215 423
Data: Survey of Income and Program Participation, panels 1990 through 1996.
Note: The sample is conditioned on work-limited and work-prevented respondents. Low education refers to no high school diploma; high education refers to at least a high school diploma. Figures are in percent. Standard errors are in parentheses.
figures, estimates are calculated for calendar years preceding and proceeding the reference year. For the disabled, the reference year is the year of first disability onset; for the nondisabled, the reference year is the sixth year prior to the survey.
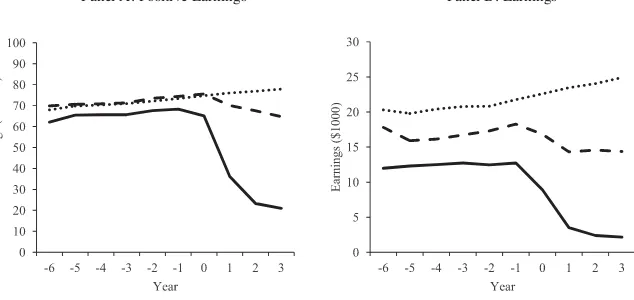
Figure 1 plots two measures of earnings: The percent with any positive earnings in Panel A and average annual earnings in Panel B. The first observation is that, before disability onset, earnings are lower among the disabled groups relative to the nondisabled group. Second, both disability groups exhibit a decline in earnings at the time of disability onset, but the drop is greater for those who become completely prevented from work.7And finally, earnings of the disabled do not recover by year three after disability onset.8 Together, the graphs confirm that the reported date of disability is associated with a decline in earnings and that the decline increases with disability severity.
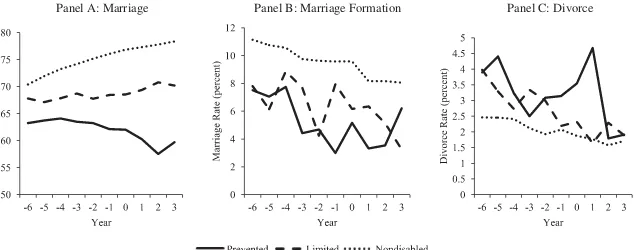
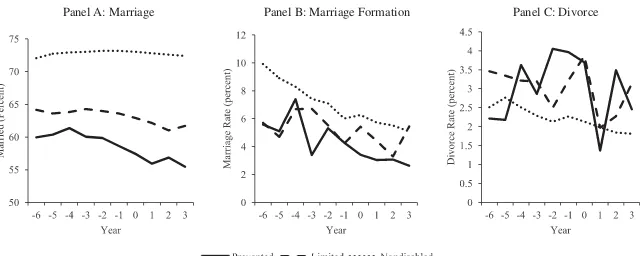
Figure 2 plots three measures of marriage. The first measure, in Panel A, is the percent married, which is defined as the percent of individuals who are married at any time during the calendar year. Among work-limited and nondisabled respon-dents, the percent married trends upward prior to the reference year, with no break in trend around the reference year. In contrast, the percent married among the work-prevented trends downward prior to disability onset, with a discrete decline in trend at the time of onset. From two years before onset to two years after, the percent married declines from 63.2 to 59.1, a change of 4.2 percentage points. In comparison,
7. The precipitous decline in earnings at the time of disability onset mitigates the concern for measurement error in the reported date of disability onset. Charles (2003) and Meyer and Mok (2008), using the Panel Survey of Income Dynamics, find that the drop in earnings slightly predates disability onset.
Panel A: Positive Earnings Panel B: Earnings
Figure 1
Earnings by Disability Status: Males Reference Ages 30 to 54 Data: Survey of Income and Program Participation, panels 1990 through 1996.
Note: “Year” is relative to the reference year, which is the year disability onset for the disabled. Earn-ings figures in panel B are adjusted to 2004 values.
Panel A: Marriage Panel B: Marriage Formation Panel C: Divorce
Figure 2
Marriage and Divorce by Disability Status: Males Reference Ages 30 to 54 Data: Survey of Income and Program Participation, panels 1990 through 1996.
from six years before onset to two years before, the percent married declines by only 0.007 percentage points.
The decline in the percent married at the time of disability onset may reflect a decrease in marriage formation, an increase in divorce, or both. To disentangle these two mechanisms, Panels B and C of Figure 2 plot the rate of marriage formation and divorce, respectively. The marriage formation rate reflects the percent of individuals who enter a marriage during the calendar year, conditional on not being married during the previous calendar year. The divorce rate reflects the percent of individuals who exit a marriage during the calendar year, conditional on being married during the same calendar year. Divorce is defined as either separation or legal divorce, whichever occurs first, and does not reflect separations due to the death of a spouse.9
Among the work prevented, the rates of marriage formation and divorce exhibit downward, albeit noisy trends. However, only the divorce rate changes discretely at the time of disability onset. In fact, the highest rate of divorce occurs in the year following disability onset, reaching 4.7 percent. Thus, the discrete decline in marriage among the work-prevented, illustrated in panel A, is driven predominately by divorce.
B. Model of Divorce
The graphs show that the dynamic effect of disability on divorce is concentrated among the work-prevented. To quantify the effect, the following event-study model of divorce is estimated:
g g g g
Yit=α+βXit+
∑(
γ Di+∑
δtDit) +εit.g t
The unit of observation is person and calendar year. The variableYit is an indicator whether individual in year exits a marriage through separation or divorce, which-i t ever occurs first. The vector of coefficients β represents the effects of covariates . Demographic covariates include age and its square (in years), race (white versus Xit
other) and educational attainment (no high school diploma, high school diploma, and college degree). To control for different age profiles by race and education, age and its square are interacted with the indicators of race and educational attainment. Marriage covariates, intended to control for marriage quality, include marriage tenure and its square (in years) as well as indicators for the second and third marriage. The termεitis an error that is correlated within person over time.
The index g corresponds to the two disability groups: the work-limited and the work-prevented. The indicatorsDgcontrols for baseline differences between the
dis-i
ability groups and the nondisabled; it equals one for those belonging to disability groupgand zero otherwise. The variableDg allows for divorce among the disabled
it
to change relative to baseline; it equals one for those belonging to disability group in period , defined relative to the reference year, and zero otherwise. The model
g t
therefore allows for the rate of divorce to vary over time by disability severity. This event-study type model is preferred, as it is similar to the model of Charles and Stephens (2004).
The divorce model is estimated using both disabled and nondisabled respondents. Initially, the sample of disabled respondents is restricted around the time of disability onset, from three years before to three years after.10 The index t references three periods relative to the reference year: Years−2 and−1, Years 0 and 1, and Years 2 and 3. The nondisabled sample is then restricted to cover the range of ages and years spanned by the disabled sample—ages 27 to 57 and years 1980 to 1998—up to five calendar years after the reference year. (Among the nondisabled, the sixth calendar year after the reference year corresponds with the year of the survey, which is not observed in retrospect.)
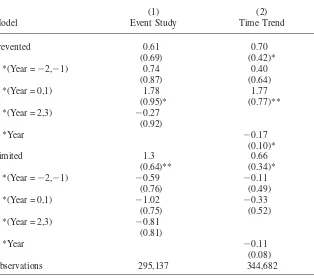
The estimates of the model are presented in Column 1 of Table 3. The baseline difference in divorce rates, in Year−3, is positive for both disability groups, but is statistically significant only for the work limited. As time elapses, the divorce rate among the work limited declines, reaching a level comparable to the nondisabled by Years 2 and 3. In contrast, the divorce rate among the work prevented increases then decreases, peaking to 1.78 percentage points in the year of and immediately after disability onset (Year = 0,1). Although the estimate suggests that disability onset precipitates divorce, the coefficient is statistically insignificant at the 5 percent level. Statistical significance, however, appears to be a matter of statistical power. A less-parameterized alternative to the event-study model controls for disability-spe-cific trends in divorce, with deviations from trends in the years before and after disability onset. To properly estimate the trends in divorce, the sample of disabled respondents is expanded to include six years before to three years after disability onset. The estimates of this alternative model, which includes the same set of con-trols as the event-study model, are presented in Column 2 of Table 3. As shown, the onset of a work-preventing disability increases the rate of divorce by an estimated 1.77 percentage points, which is similar to the 1.78 percentage point increase from the event-study model.11Moreover, the estimate is statistically significant at the 5 percent level. The trends in divorce, measured by the interaction of disability status and “Year,” are negative, but statistically insignificant at the 5 percent level. The negative trend may reflect that, as marriages dissolve, average, unobserved marital quality increases, decreasing the divorce rate over time.
C. Heterogeneous Effects by Disabling Condition
The SIPP data contain information on the health conditions that limit work. One question, then, is whether the effect of disability on divorce depends on the nature of the disabling condition. The question is addressed using the event-study model of divorce. Conditions of the back and spine, the most commonly reported disability, are differentiated from all other health conditions. As before, the model also differ-entiates work-preventing from work-limiting disabilities. The indexgtherefore
cor-10. The analysis ends at Period 3 because the disabled sample declines as time since disability onset elapses, which occurs because the data are retrospective. In particular, the sample declines from 1,284 in Year 0 to 579 in Year 3 and 236 in Year 5.
Table 3
Linear Probability Model of Divorce Rate: Males Reference Ages 30 to 54
(1) (2)
Model Event Study Time Trend
Prevented 0.61 0.70
(0.69) (0.42)*
*(Year =−2,−1) 0.74 0.40
(0.87) (0.64)
*(Year = 0,1) 1.78 1.77
(0.95)* (0.77)**
*(Year = 2,3) −0.27
(0.92)
*Year −0.17
(0.10)*
Limited 1.3 0.66
(0.64)** (0.34)*
*(Year =−2,−1) −0.59 −0.11
(0.76) (0.49)
*(Year = 0,1) −1.02 −0.33
(0.75) (0.52)
*(Year = 2,3) −0.81
(0.81)
*Year −0.11
(0.08)
Observations 295,137 344,682
Data: Survey of Income and Program Participation, panels 1990 through 1996.
Note: The unit of analysis is person and calendar year. The sample is conditioned on respondents who are married during the calendar year. The model includes controls for race, education, age, and marriage tenure and number. “Year” is relative to the reference year, which is the year disability onset for the disabled. Estimates are in percentage points. Standard errors, clustered by person, are in parentheses. *, **, and *** indicate significance at the 10, 5, and 1 percent level, respectively.
responds to four groups: back and spine conditions that prevent work, back and spine conditions that limit work, all other conditions that prevent work, and all other conditions that limit work.
Table 4
Linear Probability Model of Divorce Rate: Males Reference Ages 30 to 54
(1) Medical Condition (2) Accident
Back or Spine Other Accidental Not Accidental
Prevented −0.47 1.33 0.3 0.92
(0.84) (0.99) (0.95) (0.98)
*(Year =−2,−1) 2.31 −0.3 1.33 0.17
(1.3)* (1.2) (1.25) (1.2)
*(Year = 0,1) 3.89 0.4 2.28 1.3
(1.4)*** (1.3) (1.4)* (1.3)
*(Year = 2,3) −1.04 0.15 0.31 −0.8
(0.85) (1.4) (1.4) (1.2)
Limited 1.48 1.18 1.59 1.02
(1.0) (0.81) (0.97) (0.85)
*(Year =−2,−1) −0.73 −0.49 −0.95 −0.22
(1.2) (0.97) (1.1) (1.0)
*(Year = 0,1) −1.88 −0.39 −1.24 −0.81
(1.2) (0.98) (1.1) (0.99)
*(Year = 2,3) −1.06 −0.63 −1.31 −0.29
(1.3) (1.0) (1.2) (1.1)
Observations 295,137 295,137
Data: Survey of Income and Program Participation, panels 1990 through 1996.
Note: The unit of analysis is person and calendar year. The sample is conditioned on respondents who are married during the calendar year. The model includes controls for race, education, age, and marriage tenure and number. “Year” is relative to the reference year, which is the year disability onset for the disabled. Estimates are in percentage points. Standard errors, clustered by person, are in parentheses. *, **, and *** indicate significance at the 10, 5, and 1 percent level, respectively.
The SIPP data also report whether the disabling condition was accidental. A simi-lar event-study model is estimated that differentiates between accidental and non-accidental disabilities and between work-preventing and work-limiting disabilities. The estimates are presented in Columns 2 of Table 4. The most notable estimates are for accidental disabilities that prevent work, reaching 2.28 percentage points in the year of and immediately following disability onset. Although the estimate is only significant at the 10 percent level, the result suggests that accidental disabilities have a greater effect on divorce.
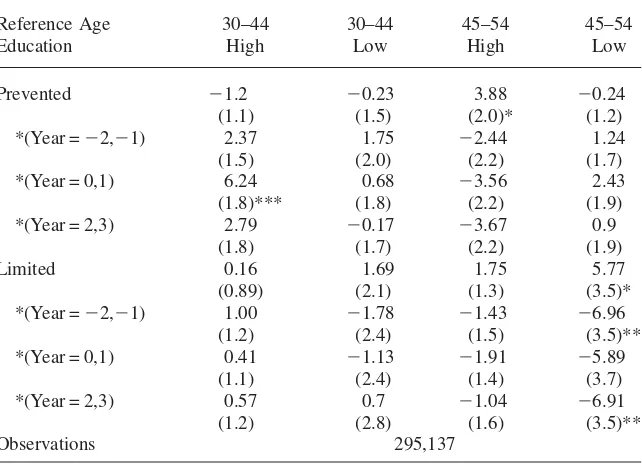
D. Heterogeneous Effects by Age and Education
Table 5
Linear Probability Model of Divorce Rate: Males Reference Ages 30 to 54
Reference Age 30–44 30–44 45–54 45–54
Education High Low High Low
Prevented −1.2 −0.23 3.88 −0.24
(1.1) (1.5) (2.0)* (1.2)
*(Year =−2,−1) 2.37 1.75 −2.44 1.24
(1.5) (2.0) (2.2) (1.7)
*(Year = 0,1) 6.24 0.68 −3.56 2.43
(1.8)*** (1.8) (2.2) (1.9)
*(Year = 2,3) 2.79 −0.17 −3.67 0.9
(1.8) (1.7) (2.2) (1.9)
Limited 0.16 1.69 1.75 5.77
(0.89) (2.1) (1.3) (3.5)*
*(Year =−2,−1) 1.00 −1.78 −1.43 −6.96
(1.2) (2.4) (1.5) (3.5)**
*(Year = 0,1) 0.41 −1.13 −1.91 −5.89
(1.1) (2.4) (1.4) (3.7)
*(Year = 2,3) 0.57 0.7 −1.04 −6.91
(1.2) (2.8) (1.6) (3.5)**
Observations 295,137
Data: Survey of Income and Program Participation, panels 1990 through 1996.
Note: The unit of analysis is person and calendar year. The sample is conditioned on respondents who are married during the calendar year. The model includes controls for race, education, age, marriage tenure and number, and nature of the work disability. “Year” is relative to the reference year, which is the year disability onset for the disabled. Estimates are in percentage points. Standard errors, clustered by person, are in parentheses. *, **, and *** indicate significance at the 10, 5, and 1 percent level, respectively.
Given the same severity of disability, the effect of disability on divorce should be greater among younger males. This is because younger males have a lower incidence of disability, more work-years remaining, and presumably lower-quality marriages on average. Additionally, the effect should be greater among the more educated, who have greater expected earnings and a lower incidence of disability onset.
To estimate heterogeneous effects by age and education, the indexgcorresponds to eight groups. The groups are differentiated by work-preventing and work-limiting disabilities, young and old ages, and low and high education. Young is defined as reference age 30 to 44; old is defined as 45 to 54. Low education is defined as no high school diploma; high education is defined as a high school diploma or more. To control for the types of disabling conditions across age and education groups, the indexgseparately indicates back and spine conditions and accidental disabilities. As discussed, these disability types are more likely to lead to divorce (Table 4) and vary by and age education (Table 2).
report work-preventing, rather than a work-limiting, disabilities. The increase in divorce is 6.24 percentage points and is statistically significant at the 1 percent level. These results are consistent with the theory presented above, as the young and educated have greater expected earnings, longer remaining work-years, and a lower incidence of disability onset.
Table 5 presents other estimates that are statistically significant, most notably for low-educated, work-limited males ages 45 to 54. For this group, the divorce rate in year −3 is greater than the nondisabled, but the rate declines in subsequent years. Mentioned above, this downward trend may reflect that, as marriages dissolve, av-erage, unobserved marital quality increases, decreasing the divorce rate over time. Alternatively, the downward trend may simply reflect sampling noise, as the divorce rate is close to or at zero during most of the analysis period, except in year −3, when it is 7.1 percentage points.
E. Reverse Causation
Thus far, the association between disability and divorce has been interpreted as the causal effect of disability on divorce. However, the analysis does not rule out an alternative interpretation: that angst from divorce causes disability onset. This is a plausible mechanism, as a recent longitudinal study shows that mental stress in-creases prior to divorce, peaking during the year of dissolution (Gardner and Oswald 2006). The question is whether the increase in stress levels can account for the association between disability and divorce documented in this study.
One way to address this question is to compare heterogeneous associations be-tween disability and divorce in this study with those of stress levels and divorce in Gardner and Oswald. In Gardner and Oswald, the rise in stress occurs predominately among couples with children. From two years before divorce to the year of divorce, the stress level score among couples with children increases from 12.7 to 15.2, compared to an increase from 13.5 to 14.2 among couples without. Moreover, the rise in stress for both groups is ephemeral, decreasing to 12.9 and 11.7 among couples with and without children, respectively, just one year after divorce. On net, divorcing couples without children actually benefit psychologically from divorce.
In contrast, the association between disability and divorce in this study occurs predominately among males who are least likely to be fathers; in particular, the young and more educated. According to the SIPP sample, 79.7 of males between the ages 30 to 44 with a college degree are fathers. This percent increases to 85.9 percent among young high school dropouts and to 88.8 among educated males between the ages of 45 and 54. Additionally, when the effect of work-preventing disabilities on divorce is allowed to differ among young males (ages 30 to 44) with and without children, the change in divorce during the year of and after disability onset is larger for childless men, 3.64 (standard error: 4.0) versus 0.40 (standard error: 1.1) per-centage points, though both estimates are statistically insignificant.12While admittedly inconclusive, the results of this study likely reflect the effect of disability on divorce.
Panel A: Positive Earnings Panel B: Earnings
Figure 3
Earnings by Disability Status: Females Reference Ages 30 to 54 Data: Survey of Income and Program Participation, panels 1990 through 1996.
Note: “Year” is relative to the reference year, which is the year disability onset for the disabled. Earn-ings figures in Panel B are adjusted to 2004 values.
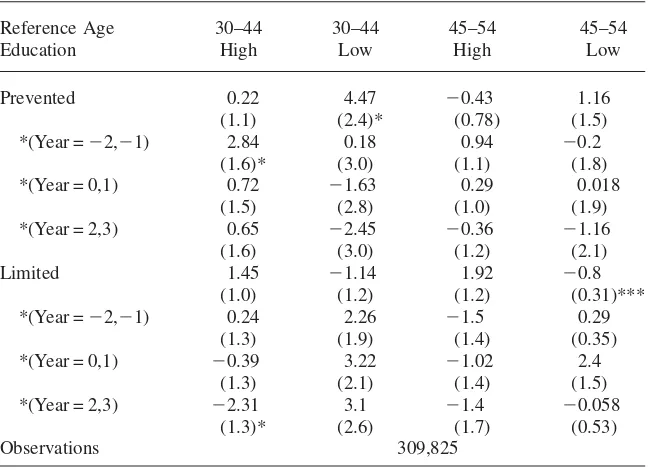
V. Disability, Earnings, and Divorce among Females
The graphical analysis for earnings and divorce, presented for males in Figures 1 and 2, is repeated for females in Figures 3 and 4. Similar to males, disability onset is associated with a precipitous decline in earnings, and the decline in earnings increases with disability severity. However, in contrast to males, there is no clear association between disability onset and divorce among females. As Panel C of Figure 4 shows, the divorce rate among the work prevented increases from Year −3 to Years −2 through 0, suggesting that divorce increases just prior to disability onset; however, the rate declines sharply in Year 1, then increases in Year 2, which leads to a small but temporary increase in the marriage rate in Year 2, evident in Panel A of Figure 4. Given the volatility in divorce, it is unclear how much is attributable to disability onset and how much is attributable to sampling error.
Panel A: Marriage Panel B: Marriage Formation Panel C: Divorce
Figure 4
Marriage and Divorce by Disability Status: Females Reference Ages 30 to 54 Data: Survey of Income and Program Participation, panels 1990 through 1996.
Note: In Panel B, the sample is conditioned on respondents who are not married during the previous calendar year; in Panel C, the sample is conditioned on respondents who are married during the same calendar year. “Year” is relative to the reference year, which is the year disability onset for the disabled.
and divorce among females, regardless of age, education or disability severity. Weiss and Willis (1997), who examine the effect of earnings shocks on divorce, also find that shocks affect divorce differently for males and females: While an increase in male earnings reduces divorce, an increase in female earnings increases divorce. Understanding the different effects for males and females requires further research.
VI. Discussion and Conclusion
According to the economic framework of marital instability, the ef-fect of disability on divorce is not uniform across marriages, but varies with the change in expected marital quality. This study shows that the association between disability onset and divorce is greatest among young and educated males who report a work-preventing, rather than a work-limiting, disability. These results are consistent with theory, as the young and educated have greater expected earnings, longer re-maining work-years, and a lower incidence of disability onset. The findings are qualitatively richer than those of Charles and Stephens (2004), who do not examine the effects of disability and divorce by age, education, or disability severity.
Table 6
Linear Probability Model of Divorce Rate: Females Reference Ages 30 to 54
Reference Age 30–44 30–44 45–54 45–54
Education High Low High Low
Prevented 0.22 4.47 −0.43 1.16
(1.1) (2.4)* (0.78) (1.5)
*(Year =−2,−1) 2.84 0.18 0.94 −0.2
(1.6)* (3.0) (1.1) (1.8)
*(Year = 0,1) 0.72 −1.63 0.29 0.018
(1.5) (2.8) (1.0) (1.9)
*(Year = 2,3) 0.65 −2.45 −0.36 −1.16
(1.6) (3.0) (1.2) (2.1)
Limited 1.45 −1.14 1.92 −0.8
(1.0) (1.2) (1.2) (0.31)***
*(Year =−2,−1) 0.24 2.26 −1.5 0.29
(1.3) (1.9) (1.4) (0.35)
*(Year = 0,1) −0.39 3.22 −1.02 2.4
(1.3) (2.1) (1.4) (1.5)
*(Year = 2,3) −2.31 3.1 −1.4 −0.058
(1.3)* (2.6) (1.7) (0.53)
Observations 309,825
Data: Survey of Income and Program Participation, panels 1990 through 1996.
Note: The unit of analysis is person and calendar year. The sample is conditioned on respondents who are married during the calendar year. The model includes controls for race, education, age, marriage tenure and number, and nature of the work disability. “Year” is relative to the reference year, which is the year disability onset for the disabled. Estimates are in percentage points. Standard errors, clustered by person, are in parentheses. *, **, and *** indicate significance at the 10, 5, and 1 percent level, respectively.
disability insurance may be extended beyond the losses to labor income to include medical and care-giving services. The role of social disability insurance in marriage formation and dissolution is an intended direction for future research.
References
Arnott, Richard, and Joseph E. Stiglitz. 1991. “Moral Hazard and Nonmarket Institutions: Dysfunctional Crowding-Out of Peer Monitoring.”American Economic Review
81(1):179–80.
Becker, Gary. 1974. “A Theory of Marriage: Part I.”Journal of Political Economy
8(14):813–46.
Becker, Gary S., Elisabeth M. Landes, and Robert T. Michael. 1977. An Economic Analysis of Marital Instability.Journal of Political Economy85(6):1141–87.
Charles, Kerwin Kofi. 2003. The Longitudinal Structure of Earnings Losses among Work-Limited Disabled Workers.Journal of Human Resources38(3):618–46.
Charles, Kerwin Kofi, and Melvin Stephens, Jr. 2004. Job Displacement, Disability, and Di-vorce.Journal of Labor Economics22(2):489–522.
Di Tella, Rafael, and Robert MacCulloch. 2002. Informal Family Insurance and the Design of the Welfare State.The Economic Journal112(481):481–503.
Espinosa, Javier, and William Evans. Heightened Mortality after the Death of a Spouse: Marriage Protection or Marriage Selection?Journal of Health Economics27(5):1326–42. Gardner, Jonathan, and Andrew Oswald. 2006. Do divorce Couples Become Happier by
Breaking Up?Journal of the Royal Statistical Society169(2):319–36.
Hess, Gregory. 2004. Marriage and Consumption Insurance: What’s Love Got to Do with It?Journal of Political Economy112(2):290–318.
Kotlikoff, Laurence J., and Avia Spivak. 1981. The Family as an Incomplete Annuities Mar-ket.Journal of Political Economy89(2):372–91.
Meyer, Bruce D., and Wallace K. C. Mok. 2008. Disability, Earnings, Income and Con-sumption.Harris School Working Paper Series06.10.
Slud, Eric V., and Leroy Bailey. 2006. Estimation of Attrition Biases in SIPP. ASA Section on Survey Research Methods.
Stevenson, Betsey, and Justin Wolfers. 2007. Marriage and Divorce: Changes and their Driving Forces.Journal of Economic Perspectives21(2):27–52.
Weiss, Yoram. 1997. The Formation and Dissolution of Families: Why Marry? Who Marries Whom? And What Happens upon Divorce?” InHandbook of Population and Family Eco-nomics, Volume 1A, ed. Mark R. Rosenzweig and Oded Stark. Amsterdam, New York and Oxford: Elsevier Science, North-Holland.