ME-127
A COMPARISON OF STUDENTS SELF-BELIEF AND MATHEMATICS
ACHIEVEMENT IN THE ASIAN COUNTRIES: FINDING FROM THE THIRD
INTERNATIONAL MATHEMATICS AND SCIENCE STUDY (TIMSS)
Desi Rahmatina
Universitas Maritim Raja Ali Haji. Tanjungpinang, [email protected]
Abstract.
The Trends in Mathematics and Science Study (TIMSS) is an international assessment of fourth and eighth grade students achievement in mathematics and science. The purpose of this study was examine the compares of student self- belief and mathematics in Asian countries using data from the Third International Mathematics and Science Study 2011. The analysis is conducted through a Multivariate Analysis of Variance (MANOVA) model with random effects for each country. East Asian countries Korea, Singapore, and Chinese Taipei Hong Kong SAR and Japan were the top-performing countries at the eighth grade to lead the world in mathematics achievement. The null hypotheses used in this study there are no statistically significant difference in self belief and mathematics achievement between Asian students.
Keywords. Self-belief, mathematics achievement, TIMSS.
INTRODUCTION
Self belief in mathematics can be defined as the individual’s personal judgement in relation to his/her abilities in mathematical process. During the last twenty years the research area about self beliefs and mathematics achievement, and many different countries have been included in the research, for example Rao, Moely and Sachs (2000, in House J Daniel,2006) noted that self concept of mathematics ability was a significant predictor of subsequent achievement. According to Richardson (1996), beliefs are “psychologically held understandings, premises, or propositions about the world that are felt to be true” and Raymond (1997) defined mathematics beliefs as personal judgments about mathematics formulated from experiences in mathematics, including beliefs about the nature of mathematics, learning mathematics, and teaching mathematics
The purpose of this study was to investigate compares of eighth grades student’s self- belief and mathematics achievement using data from the Trends in International Mathematics and Science Study (TIMSS) 2011 in Asian countries.
DATA SOURCE
Data from the Trends in International Mathematics and Science Study (TIMSS) 2011. TIMSS contains International results in Mathematics presents extensive information on student performance in mathematics. TIMSS was originally conducted in 1995 and continue every four years, in 1999,2003,2007 and most recently in 2011.
The TIMSS 2011 database contains achievement data and student, home, teacher and school background data collection in the 63 countries and 14 benchmarking participants including three Canadian provinces, nine US State and two emirates from the United Arab Emirates. Fifty-two countries and seven benchmarking participants administered the fourth
grade assessment.
In each county, representative samples of approximately 4000 students from 150-200 schools participated in TIMSS 2011 at each grade assessed. In total, more than 300,000 students participated in the TIMSS 2011 fourth grade assessment and a further 300,000 in the eighth grades assessment. For this study, the following database from TIMSS 2011 for eighth grade were used: self belief and student math achievement.
PARTICIPANT
At the grade level has a range of 0 – 1 (although student performance typically ranges between 300 and 700). The scale center point of 500 was set to correspond to the mean of the overall mathematics achievement and 100 points on the scale was set to correspond to the standard deviation. According to the TIMSS 2011 report, mathematics assessment consisted of content and cognitive domains. There are four content domains, numbers, algebra, geometry, data and chance, whereas knowing, applying and reasoning were assessed in the cognitive domain.
Table 1. Average Score Achievement in Mathematics Cognitive Domain
No Country name Average Score
Overall Mathematics
Knowing Applying Reasoning
1 Korea, Rep.of 613 616 617 612
2 Singapore 611 617 613 604
3 Chinese Taipei 609 611 614 609
4 Hongkong SAR 586 591 587 580
5 Japan 570 558 574 579
Source: TIMSS 2011.
In the study, the targeted sample was top-performing countries at the eighth grade to lead the world in mathematics achievement. Those five countries in East Asian are Korea, Singapore, Chinese Taipei , Hong Kong SAR and Japan. Total the participants was 24,564 students showed in table 2.
Table 2. Summary of the Samples Included in the study No Country name ID
Country
Number of student Number of Schools Total Female Male
1 Korea, Rep.of 410 5166 2663 2503 150
2 Singapore 702 5927 2934 2993 165
3 Chinese Taipei 158 5042 2448 2594 150
4 Hongkong SAR 344 4015 1997 2018 117
5 Japan 392 4414 2183 2231 138
No Country name Average Score
Overall Mathematics
Number Algebra Geometry Data and Chance
1 Korea, Rep.of 613 618 617 612 616
2 Singapore 611 611 614 609 607
3 Chinese Taipei 609 598 628 625 584
4 Hongkong SAR
586 588 583 597 581
ME-129 INSTRUMENTS
The following items were selected from the TIMSS 2011 about self-belief about mathematics are:
1. Enjoy learning mathematics;
2. Wish have not to study mathematics; 3. Math is boring;
4. Learn Interesting Thing; 5. Like mathematics;
6. Important to do well in math
The item labelled BSBM14A to BSBM14F, a four point scale was used all items (1 = agree a lot, 2 = agree a little, 3 = disagree a little 4 = disagree a lot).
To assess mathematics assessment is based on a comprehensive framework developed collaboratively with the participant countries, the way to measure student’s mathematics achievement on that scale in the TIMSS 2011 had five plausible variables which explained mathematics achievement, there are labelled BSMMAT01 through BSMMAT05. In this study only one out of five plausible variables, the one labelled BSMMAT01 was used to measure student’s mathematics achievement.
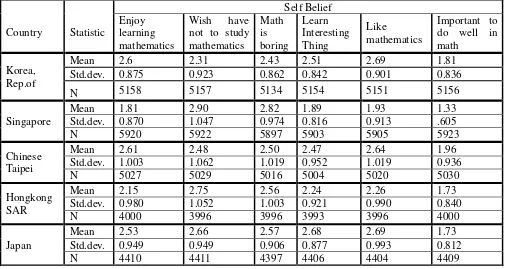
Six Likert - scale item measure student’s self belief in learning mathematics. In table 3 shows the mean and standard deviations of item for measure of students self belief.
Table 3. Means and standard deviation of items for measure of student self belief in mathematics.
Country Statistic
Self Belief Enjoy
learning mathematics
Wish have not to study mathematics
Math is boring
Learn Interesting Thing
Like
mathematics
Important to do well in math
Korea, Rep.of
Mean 2.6 2.31 2.43 2.51 2.69 1.81
Std.dev. 0.875 0.923 0.862 0.842 0.901 0.836
N 5158 5157 5134 5154 5151 5156
Singapore
Mean 1.81 2.90 2.82 1.89 1.93 1.33
Std.dev. 0.870 1.047 0.974 0.816 0.913 .605
N 5920 5922 5897 5903 5905 5923
Chinese Taipei
Mean 2.61 2.48 2.50 2.47 2.64 1.96
Std.dev. 1.003 1.062 1.019 0.952 1.019 0.936
N 5027 5029 5016 5004 5020 5030
Hongkong SAR
Mean 2.15 2.75 2.56 2.24 2.26 1.73
Std.dev. 0.980 1.052 1.003 0.921 0.990 0.840
N 4000 3996 3996 3993 3996 4000
Japan
Mean 2.53 2.66 2.57 2.68 2.69 1.73
Std.dev. 0.949 0.949 0.906 0.877 0.993 0.812
N 4410 4411 4397 4406 4404 4409
STATISTICAL ANALYSIS
[image:3.595.46.552.404.673.2]variable. In the study used a one way MANOVA, consist of the self belief and mathematics achievement as dependent variables and following countries as independent variables.
Table 4. Summary of the missing respondens
Variable N Missing Total
Self_belief 24564 29 24535
Math_Achievement 24564 0 24564
The student questionnaire seeks information about the self belief students in mathematics. From total of the 24564 students and 29 of them are missing or no response in filling the all questionnaires from BSBM14A to BSBM14F about self-belief.
Table 5. The Number of respondents missing in the self belief No Country name N Missing Total
1 Korea, Rep.of 5166 5 5161
2 Singapore 5927 2 5925
3 Chinese Taipei 5042 10 5032 4 Hongkong SAR 4015 11 4004
5 Japan 4414 1 4413
Trend in mathematics achievement of the sample countries from 1995 through 2011 showed in figure below.
Figure 1. Trend in Mathematics Achievement
In figure 1 shows that Singapore country has the highest score in 1995 year, but in 2011 the highest score achieved by the Korea,Rep of. While Chinese Taipei country began as articipating in TIMSS was in 1999 and showed an increasing trend from 1999 to 2011.
RESULTS
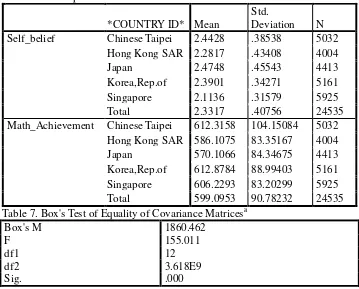
Table 6 shows descriptive statistics for each self belief and for mathematics achievement test scores for five countries. Estimates of the sample mean, ,standard deviation and number of students for each countries. Japanese student’s showed higher self belief of
530 560 590 620 650
1995 1999 2003 2007 2011
Trend in mathematics achievement
ME-131
[image:5.595.118.477.160.449.2]other countries. For mathematics achievement the student’s Korea,Rep of who showed higher achievement score.
Table 6. Descriptive Statistics of the self belief and mathematics achievement
*COUNTRY ID* Mean
Std.
Deviation N Self_belief Chinese Taipei 2.4428 .38538 5032
Hong Kong SAR 2.2817 .43408 4004
Japan 2.4748 .45543 4413
Korea,Rep.of 2.3901 .34271 5161
Singapore 2.1136 .31579 5925
Total 2.3317 .40756 24535
Math_Achievement Chinese Taipei 612.3158 104.15084 5032 Hong Kong SAR 586.1075 83.35167 4004
Japan 570.1066 84.34675 4413
Korea,Rep.of 612.8784 88.99403 5161 Singapore 606.2293 83.20299 5925
Total 599.0953 90.78232 24535
Table 7. Box's Test of Equality of Covariance Matricesa
Box's M 1860.462
F 155.011
df1 12
df2 3.618E9
Sig. .000
a. Design: Intercept + IDCNTRY
Box test was used to test the assumptions of MANOVA requires that the variance matrix of the self belief and mathematics achievement variables is not different. Box’s M score is 1860.462, anf F test score is 156.011 and significant level is 0.000 less than 0.05, so test the null hypothesis that the observed covariance matrices of the self belief and mathematics achievement variables are different across country.
[image:5.595.117.478.161.448.2]In table 8 shows the analysis of MANOVA using the Wilk’s Lambda test, using an alpha level of 0.05, the test is significant, Wilk’s lambda = 0.853, F(8,49058) = 507.71 and significant on 0.000 (p < 0.05). This significant F indicates that there are significant differences among the country (IDCNTRY) groups on a linear combination of the self belief and mathematics achievement.
Table 8. Multivariate Testsc
Effect Value F Hypothesis df Error df Sig.
Intercept Pillai's Trace .992 1441020.576a 2.000 24529.000 .000 Wilks' Lambda .008 1441020.576a 2.000 24529.000 .000 Hotelling's Trace 117.495 1441020.576a 2.000 24529.000 .000 Roy's Largest Root 117.495 1441020.576a 2.000 24529.000 .000 IDCNTR
Y
Pillai's Trace .151 500.419 8.000 49060.000 .000
Wilks' Lambda .853 507.708a 8.000 49058.000 .000
[image:5.595.82.543.598.736.2]Effect Value F Hypothesis df Error df Sig. Intercept Pillai's Trace .992 1441020.576a 2.000 24529.000 .000
Wilks' Lambda .008 1441020.576a 2.000 24529.000 .000 Hotelling's Trace 117.495 1441020.576a 2.000 24529.000 .000 Roy's Largest Root 117.495 1441020.576a 2.000 24529.000 .000 IDCNTR
Y
Pillai's Trace .151 500.419 8.000 49060.000 .000
Wilks' Lambda .853 507.708a 8.000 49058.000 .000
Hotelling's Trace .168 515.004 8.000 49056.000 .000 Roy's Largest Root .135 826.869b 4.000 24530.000 .000 a. Exact statistic
b. The statistic is an upper bound on F that yields a lower bound on the significance level. c. Design: Intercept + IDCNTRY
The Levene’s test of equality of error variances tests the assumption of MANOVA that the variances of self belief and mathematics achievement variables are equal across the countries. As can be seen in Table 9 that self belief variable and mathematics achievement are significant (sig = 0.00 <0.05), the indicates that tests the null hypothesis that the error variance of the self belief and mathematics achievement variables is no equal across countries, whereas MANOVA is robust so next analysis can be continue.
Table 9. Levene's Test of Equality of Error Variancesa
F df1 df2 Sig.
Self_belief 92.946 4 24530 .000
Math_Achievement 86.762 4 24530 .000 a. Design: Intercept + IDCNTRY
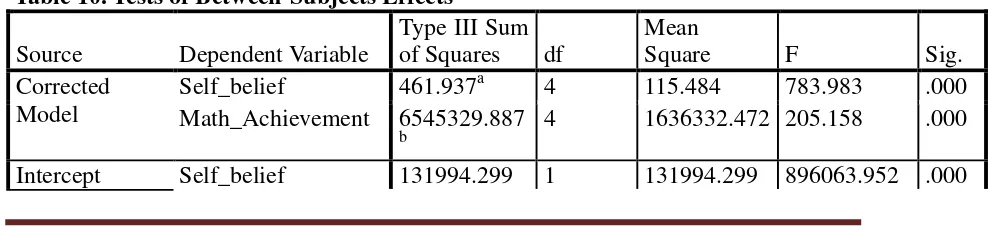
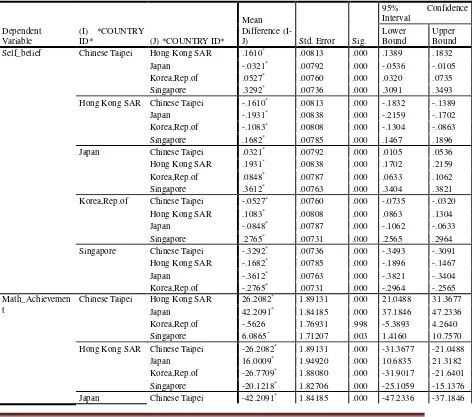
Test of between subject effects to determine how the dependent variables differ for the independent variable, in table 10 shows test of between subject effects that countries (IDCNTRY) has a statistically effect on both self belief ( F(4,2453) = 783.98, sig value = 0.000 < 0.05 ) and mathematics achievement (F(4,2453) = 205.16, sig value = 0.000 < 0.05). The indicates that there are difference self belief and mathematics achievement between countries categories. The following is significant the univariate ANOVA (Analysis of Variance) with Tukey’s HSD post-hoc test, as shown in the Multiple Comparison table. In table 11 shows that for mean scores for self belief were significantly different between each countries ( sig value = 0.000 < 0.05). Mean mathematics achievement score were statistically significantly different between Chinese Taipei and Hong Kong SAR, Japan and Singapore (sig value = 0.000), Hong Kong SAR and Japan, Korea Rep. of and Singapore ( sig value = 0.000) , Japan and Korea Rep.of, Singapore (sig value = 0.000), and Korea. Rep.of and Singapore (Sig = 0.001) but not different between Chinese Taipei and Korea. Rep.of (sig = 0.998).
Table 10. Tests of Between-Subjects Effects
Source
Dependent Variable
Type III Sum
of Squares
df
Mean
Square
F
Sig.
Corrected
Model
Self_belief
461.937
a4
115.484
783.983
.000
Math_Achievement
6545329.887
b
4
1636332.472 205.158
.000
[image:6.595.81.577.629.742.2]
ME-133
Math_Achievement
8.602E9
1
8.602E9
1078539.116 .000
IDCNTRY
Self_belief
461.937
4
115.484
783.983
.000
Math_Achievement
6545329.887 4
1636332.472 205.158
.000
Error
Self_belief
3613.381
24530
.147
Math_Achievement
1.956E8
24530
7975.944
Total
Self_belief
137464.741
24535
Math_Achievement
9.008E9
24535
Corrected Total Self_belief
4075.318
24534
Math_Achievement
2.022E8
24534
[image:7.595.87.559.327.744.2]a. R Squared = .113 (Adjusted R Squared = .113)
b. R Squared = .032 (Adjusted R Squared = .032)
Table 11. Multiple Comparisons
Tukey HSD
Dependent Variable
(I) *COUNTRY
ID* (J) *COUNTRY ID*
Mean Difference
(I-J) Std. Error Sig.
95% Confidence
Interval Lower Bound
Upper Bound
Self_belief Chinese Taipei Hong Kong SAR .1610* .00813 .000 .1389 .1832
Japan -.0321* .00792 .000 -.0536 -.0105
Korea,Rep.of .0527* .00760 .000 .0320 .0735
Singapore .3292* .00736 .000 .3091 .3493
Hong Kong SAR Chinese Taipei -.1610* .00813 .000 -.1832 -.1389
Japan -.1931* .00838 .000 -.2159 -.1702
Korea,Rep.of -.1083* .00808 .000 -.1304 -.0863
Singapore .1682* .00785 .000 .1467 .1896
Japan Chinese Taipei .0321* .00792 .000 .0105 .0536
Hong Kong SAR .1931* .00838 .000 .1702 .2159
Korea,Rep.of .0848* .00787 .000 .0633 .1062
Singapore .3612* .00763 .000 .3404 .3821
Korea,Rep.of Chinese Taipei -.0527* .00760 .000 -.0735 -.0320
Hong Kong SAR .1083* .00808 .000 .0863 .1304
Japan -.0848* .00787 .000 -.1062 -.0633
Singapore .2765* .00731 .000 .2565 .2964
Singapore Chinese Taipei -.3292* .00736 .000 -.3493 -.3091
Hong Kong SAR -.1682* .00785 .000 -.1896 -.1467
Japan -.3612* .00763 .000 -.3821 -.3404
Korea,Rep.of -.2765* .00731 .000 -.2964 -.2565
Math_Achievemen t
Chinese Taipei Hong Kong SAR 26.2082* 1.89131 .000 21.0488 31.3677
Japan 42.2091* 1.84185 .000 37.1846 47.2336
Korea,Rep.of -.5626 1.76931 .998 -5.3893 4.2640
Singapore 6.0865* 1.71207 .003 1.4160 10.7570
Hong Kong SAR Chinese Taipei -26.2082* 1.89131 .000 -31.3677 -21.0488
Japan 16.0009* 1.94920 .000 10.6835 21.3182
Korea,Rep.of -26.7709* 1.88080 .000 -31.9017 -21.6401
Singapore -20.1218* 1.82706 .000 -25.1059 -15.1376
Korea,Rep.of -42.7718* 1.83107 .000 -47.7669 -37.7766
Singapore -36.1226* 1.77582 .000 -40.9670 -31.2783
Korea,Rep.of Chinese Taipei .5626 1.76931 .998 -4.2640 5.3893
Hong Kong SAR 26.7709* 1.88080 .000 21.6401 31.9017
Japan 42.7718* 1.83107 .000 37.7766 47.7669
Singapore 6.6491* 1.70046 .001 2.0103 11.2879
Singapore Chinese Taipei -6.0865* 1.71207 .003 -10.7570 -1.4160
Hong Kong SAR 20.1218* 1.82706 .000 15.1376 25.1059
Japan 36.1226* 1.77582 .000 31.2783 40.9670
Korea,Rep.of -6.6491* 1.70046 .001 -11.2879 -2.0103
Based on observed means.
The error term is Mean Square(Error) = 7975.944. *. The mean difference is significant at the .05 level.
CONCLUSION
Data analysis indicated that self belief are significantly related to the countries,
and there are several mathematics achievement are not significantly related to the
countries. Mean scores for self belief were significantly different between Chinese
Taipei, Hong Kong SAR, Japan, Korea Rep and Singapore. Mean mathematics
achievement score were statistically significantly different between Chinese Taipei,
Hong Kong SAR, Japan and Singapore, between Hong Kong SAR, Japan, Korea Rep.
of and Singapore, between Japan, Korea Rep.of and Singapore, and last between Korea.
Rep.of and Singapore but not different between Chinese Taipei and Korea. Rep.of.
REFERENCES
Abu-Hilal, M. M. (2000). A structural model of attitudes toward school subjects,academic aspirations, and achievement. Educational Psychology, 20, 75–84.
Beaton, A. E. (1998). Comparing cross-national student performance on TIMSS using different test items. International Journal of Educational Research, 29, 529-542.
House, J Daniel (2006). Mathematics Beliefs and Achievement of Elementary School Students in Japan and the United States: Result From the Third International Mathematics and Science Study. The Journal of Genetic Psychology, 167(1),31-45
Raymond, A. M. (1997). Inconsistency between a beginning elementary school teacher‟s mathematics beliefs and teaching practice. Journal for Research in Mathematics Education, 28(5), 550–576.
Richardson, V. (1996). The role of attitudes and beliefs in learning to teach. In: J.Sikula (Ed), Handbook of Research on Teacher Education. (pp 102 – 119) New York: Macmillan.
Ozgen, K. & Bindak, R. (2011). Determination of self-efficacy beliefs of high school students towards math literacy. Educational Sciences: Theory & Practice, 11(2), 1073-1089.
TIMSS. (2011). User Guide for the International Database. International Association for the Evaluation of Education Achievement. http://timss.bc.edu/timss2011/international-database.html