Comparing micrometeorology of rain forests in Biosphere-2
and Amazon basin
Muhammad Altaf Arain
a,b,1,William James Shuttleworth
b,∗, Blake Farnsworth
c,
John Adams
c, Omer Lutfi Sen
baInstitute for the Study of Planet Earth, The University of Arizona, Tucson, AZ, USA bDepartment of Hydrology and Water Resources, The University of Arizona, Tucson, AZ, USA
cBiosphere-2 Center, Columbia University, Oracle, AZ, USA
Received 13 May 1999; received in revised form 22 October 1999; accepted 28 October 1999
Abstract
Micrometeorological variables measured in the BIOSPHERE-2 Center (B2C) enclosed rain forest biome for 1 year were compared with similar measurements made in the Amazon rain forest. In the B2C rain forest, the overlying glass and supporting structure significantly reduces (by approximately a factor of two) the incoming solar radiation. Monthly mean values of above-canopy and within-canopy air temperature, vapor pressure, and vapor pressure deficit are reasonably similar to those of the Amazon rain forest, but there are marked differences in the above-canopy values of these variables in the Arizona summer. Monthly mean diurnal trends also show significant differences. Measurements of vertical air temperature gradient clearly showed two very distinct environments in the 27.4 m high rain forest dome during daylight hours. There is a comparatively cool and fairly well-mixed environment (which is reasonably similar to that found in a natural rain forest) below about 10 m and a hot, thermally stable environment above about 15 m. The nature of the atmospheric turbulence within the B2C rain forest also is significantly different from that normally found in natural rain forests. There is little turbulent mixing above the forest canopy in this enclosed environment. These findings are important for guiding the operation and use of this experimental rain forest facility in future research and for understanding how the rain forest biome functions in an enclosed environment. ©2000 Elsevier Science B.V. All rights reserved.
Keywords: BIOSPHERE-2; Rain forest; ABRACOS; Amazon River basin; Controlled environment; Greenhouse
1. Introduction
Observations show that, over the last 100 years, atmospheric carbon dioxide (CO2) concentration has increased by about 70 ppm (Schimel et al., 1996)
∗Corresponding author. Tel.:+1-520-621-5082;
fax:+1-520-621-1422.
E-mail address: [email protected] (W. James Shuttleworth).
1Present address: Agroecology, Faculty of Agricultural Sciences, University of British Columbia, Vancouver, BC, Canada V6T 1Z4.
and global average near-surface air temperature has increased by 0.7–0.9◦C (Nicholls et al., 1996). The increase in atmospheric CO2 concentration has been caused mainly by fossil fuel emissions and land-use changes in the tropics and subtropics (Intergovern-mental Panel on Climate Change, Houghton et al., 1996). Recent studies suggest that tropical rain forest ecosystems are a major sink for fossil fuel carbon (Grace et al., 1995). However, our current under-standing of the functioning of these forest ecosystems does not allow accurate prediction of their carbon
sink and sources strength because it is not known how these ecosystems will respond over time to changes in atmospheric CO2and global warming.
The enclosed tropical rain forest ecosystem at the Columbia University BIOSPHERE-2 Center (B2C) potentially offers the opportunity to understand the functioning of tropical rain forests and test models of their interaction with the overlying atmospheres in a controlled, well-documented, CO2-enriched environ-ment. In principle, understanding the functioning of the B2C rain forest can be used to test the formula-tions used to parameterize rain forest vegetation in the land-surface–atmosphere interaction schemes used in weather and climate prediction models. However, to place the ensuing understanding in proper context, it is necessary to evaluate how representative are the me-teorological conditions in the B2C rain forest relative to those prevalent in the earth’s natural rain forests. This paper describes a field study that was conducted in the B2C’s rain forest biome to make micrometeoro-logical measurements over a 1-year period. These data were compared with equivalent measurements at three forested sites in the Amazon River basin in Brazil. Data from the Anglo Brazilian Amazonian Climate Observational Study (ABRACOS: Shuttleworth et al., 1991; Gash et al., 1996) were used to provide the basis for comparison.
2. Materials and methods
2.1. The BIOSPHERE-2 rain forest biome
The B2C (32◦34′N, 110◦51′W, elevation 1200 m, area 1.25 ha) is located near Oracle, AZ, USA. The structure is constructed of sealed glass (two 6 mm panes of glass with thin plastic laminate between) and space frame (ASTM 8500 grade B tube struts, 6 cm in diameter (Fig. 1a)). It houses samples of some of the earth’s most important biomes, such as rain for-est, desert, savanna, and oceans. To the extent possi-ble, temperature, humidity, rainfall, CO2content, and other environmental variables are controlled.
The B2C tropical rain forest enclosure covers 1900 m2 and is 27.4 m high at its highest point. Dif-ferent habitats are recreated within the B2C rain forest biome, namely lowland rain forest, a ginger
belt (1–4 m wide dense belt of vegetation surrounding the rain forest on three sides to shield the understorey from excessive sunlight), a bamboo belt (to precipitate any airborne salt particles coming from the adjacent ocean biome on the southern side), várzea (an area periodically flooded for extended periods), surface water ponds, a stream, and mountain terraces. The lowland rain forest is the largest and tallest habitat represented and is considered to be typical of a wet equatorial forest. The dominant plant species in the lowland rain forest are Ceiba pentandra, Hura crepi-tans, Cecropia peltata, Arenga pinnata, and Clitoria racemosa. At this location, the canopy height is ap-proximately 12–13 m. However, a few trees, such as Ceiba pentandra and Arenga pinnata, reach 16–17 m. Plants in the ginger belt biome include Musa, He-liconia, Alpinia, Strelitzia, and Costus. The bambo belt consists of Bambusa multiplex and B. tuldoides, and the várzea comprises Phytolacca dioica, Pachira aquatica, and Pterocarpus. Plants on the mountain terraces are a mixture of Carica papaya, Clitoria racemosa, Coffea arabica, Panama hat palm, Inga sp., Hibiscus rosa-sinensis, and Strelitzia nicolai. A schematic diagram of the layout of the B2C rain forest is shown in Fig. 1b.
The soils in the B2C rain forest were created from locally available material. There are two layers of soil: topsoil and subsoil. The subsoil layer (a mixture of rock, pebble, and very sandy loam) has uniform com-position, but it varies in thickness (0–5 m) to provide gentle slopes. The topsoil consists of a mixture of a local (Wilson Pond) loam with organic and/or gravelly sand in different combinations for each of the rain for-est habitats. Soil biota (inocula) were also introduced in the form of undisturbed soil cores, humus, and or-ganic litter (along with earth worms). The B2C rain forest soils were originally very high in organic car-bon, but recent studies (Lin et al., 1998) have shown that the current carbon content is within the range typ-ical of natural rain forest soils.
open into the basement of the rain forest. Chilled (or heated) water is passed through the coils of these air handlers to control the temperature and humidity of the air. Air is blown across the forest floor from west to east and returns through gratings on the periphery of the rain forest. The normal temperature range of the air passing through the air handlers is 21–29◦C. Because the rain forest atmosphere is connected with the atmospheres in the adjacent desert, savanna, and ocean biomes, there may be some loss of atmospheric humidity into the surrounding biomes (recently in-stalled curtains can now be used to isolate the rain forest atmosphere from adjacent ecosystems). Water condensation occurs on the inside surface of the glass structure during late autumn, winter, and early spring. This condensation and any rain or irrigation water which percolates through the soil is collected and re-cycled to the rain forest after the removal of dissolved solids using a reverse osmosis system.
2.2. ABRACOS field sites
The ABRACOS provided representative data for forested and deforested areas in different climate zones across the Amazon River basin. Detailed studies of surface climatology, micrometeorology, plant physiol-ogy, and soil hydrology were made at three forest and adjacent clearing sites from late 1990 to December 1993, although the automatic weather stations (AWS) continued data collection afterward (Shuttleworth et al., 1991; Gash et al., 1996; Gash and Nobre, 1997). A brief description of each site is given ahead.
The Reserva Jaru forest site (10◦5′S, 61◦55′W, al-titude 120 m) is located 80 km northeast of Ji-Paraná, Rondônia near the southwestern edge of the Amazon forest. In this region, the forest has been progressively cleared over the last two decades in an organized way, resulting in a ‘fishbone’ pattern of clearings. It has pronounced dry periods lasting several weeks between June and August, when the rainfall is less than 10 mm per month. December through April is the wettest sea-son. Meteorological measurements were made on a 52 m high tower. The average tree height is 33 m, but some trees reached 44 m. The soil at the Reserva Jaru forest site is a medium-textured red-yellow podzol (Hodnett et al., 1996).
The Reserva Ducke site (2◦57′S, 59◦57′W, altitude 80 m) is in a protected forest about 25 km from
Man-aus, Amazonas in central Amazonia, where there is only limited forest clearing. The driest months (with less than 100 mm rainfall) are June through Septem-ber, and the wet season is from December through April. Dry periods rarely last more than a week. The mean canopy height is 35 m, but some trees reach 40 m. The meteorological data were collected near the top of a 45 m tower. The soil at this site is a yel-low Latosol (Oxisol or Haplic Acrorthox) with 80% fine clay content and high conductivity (Hodnett et al., 1996; Wright et al., 1996).
The Reserva Vale do Rio Doce site (5◦45′S, 49◦10′W, altitude 150 m) is in a 17 000 ha protected forest located about 50 km south of Marabá, Para, which is surrounded by large clearings. The dri-est months (with less than 20 mm rainfall) are June through August, and the wet season is from De-cember through April. Meteorological data were collected at the top of a 52 m tower. The soil at the Reserva Vale do Rio Doce site has been classified as a medium-textured, yellowish cambisol (Hodnett et al., 1996).
2.3. Instruments and methods
The instruments used in the B2C rain forest study included two AWS systems that provided routine measurements of meteorological variables, and an eddy correlation (EC) system which provided mea-surements of the turbulent structure of the atmosphere in the B2C rain forest biome. These instruments were installed on three hanging frames located on the north, center, and south sides of the rain forest (Fig. 1b–c). The frames, which were mounted vertically on ropes, were designed to cause minimum distur-bance to the environment inside the rain forest biome. They were 1 m wide and 1.5 m high and made from galvanized iron pipe, with a 0.11 m wide aluminum plate across the bottom which was used to mount the sonic anemometer vertically. The height of the plat-form could be adjusted to allow micrometeorology measurements at different heights.
then averaged over 15 min intervals using data log-gers (Campbell Scientific, UT, USA; model 21X). At the central location, the data were initially averaged at 10 min intervals (from 18 October 1997 through 24 February 1998) but then at 15 min intervals for the re-mainder of the study. When deployed, the EC system was installed at the central location at different heights within and above the canopy.
2.3.1. Standard meteorological instruments
2.3.1.1. Central location The AWS at the central location provided continuous measurements of net radiation (Rn) using a net radiometer (REBS, WA, USA; model Q7); incoming short-wave radiation (Si), and outgoing short-wave radiation (So) using pyranometers (Epply Laboratory, Newport, RI, USA; model PSP); air temperature (Ta) and relative humid-ity (RH) using a combined sensor (Vaisala, Finland; model HMP35C and HMP45C); air pressure using a pressure transducer (Motorola, AZ, USA; model MPX2200AP), soil temperatures (Ts) and soil heat flux (SHF), using two soil thermocouple probes (Campbell Scientific, UT, USA; model TCVA), and one soil heat flux plate (REBS, WA, USA; model HFT-3.1). Measurements were taken from 18 Octo-ber 1997 to 31 OctoOcto-ber 1998. Rn, Si, and So were recorded at 15.2 m, and Ta and RH were recorded at 15.5 m above the ground. Ts and SHF were mea-sured at a location approximately 5 m south of the central location. The SHF plates were buried 0.08 m below the soil. The average temperature above the soil heat flux plates was found by averaging the mea-sured Ts at 0.02 and 0.06 m. On 21 July 1998, a second (HMP45C) probe was installed 7.6 m above the ground to measure the in-canopy Ta and RH.
2.3.1.2. Northern location Measurements of Si (using a pyranometer, LICOR, NE, USA; model LI200X), Rn, Ta, and RH were subsequently made at four different heights (15, 12, 9 and 6 m) for sev-eral days at the northern location (Fig. 1b) between 27 January 1998 and 1 May 1998 to observe how these meteorological variables changed through the canopy at this location. At the top level, the height of the instruments at the northern location was equal to that of the equivalent above-canopy instruments at
the central location. Ts and SHF also were measured close to the northern location.
2.3.1.3. Southern location Similar measurements of in-canopy meteorological variables were made at the southern location (Fig. 1b). Measurements of Si, Rn, Ta, and RH were subsequently made at four different heights (15, 12, 9 and 6 m) between 22 July 1998 and 8 September 1998. Again, the top height was equiv-alent to that at the central. The ground surface at the southern and northern locations was 1–2 m higher than that at the central location because of gradients in the forest floor; therefore, the instruments were closer to the ground at this location.
2.3.2. Air temperature profiles
Fine-wire Chromel–Constantan thermocouples (Campbell Scientific, UT, USA; Type E, 0.076 mm diam) were installed 1.5, 4.5, 7.6, 10.6, 15.2, 20, and 26 m above the ground at the central location to measure the vertical profiles of Ta within and above the canopy between 19 May 1998 and 21 July 1998 (Fig. 1c).
A comparison of Ta measured by one thermocou-ple and both Ta/RH probes installed at 15.2 m height at the central location for 10 days (27 May 1998–5 June 1998) showed that, although the probes agreed well with each other, the thermocouple measurements were systematically lower by 1±1◦C at night and by 4±2◦C during daylight hours. It is likely that the night-time difference is the result of poor relative cal-ibration between two different types of Ta sensors, while the greater discrepancy during the day may be due to solar heating of the metal screen in which the Ta/RH probe is housed. Fortunately, the overall con-clusions of the present study are not sensitive to the absolute accuracy of these Ta data, and no attempt was made to re-calibrate the sensors. However, the reader is advised that values of Tashown later may be prone to absolute errors on the order of a few degree Celsius.
2.3.3. Eddy correlation system
Instruments, Hants, UK; Model 1012R2A) which al-lows real-time corrections for the flow distortion and wind shadowing generated by the anemometer struc-ture. Variations in CO2and water vapor concentrations were measured using a closed-path Infrared Gas Ana-lyzer (IRGA, LICOR, NE, USA; model 6262) which was calibrated once each week against known con-centrations of CO2 and water vapor. Saturated water vapor (generated from a dew-point generator, LICOR, NE, USA; model LI-610) and a compressed reference CO2 (1060 ppm accurate to 1% of the National In-stitute of Standards standard) were used to calibrate the IRGA. Scrubbing chemicals (soda lime for CO2 and Mg(ClO4)2for water vapor) were used to provide air samples with zero concentration. A laptop com-puter (Hitachi, Japan; model VisionBook, 133 MHz) was used for system control and for online data pro-cessing using version 0.39 of the ‘EdiSol’ software (Moncrieff et al., 1997). The process of ducting an air sample from the intake near the sonic anemometer above the canopy to the IRGA introduces a delay of several seconds between the wind vector and concen-tration measurements. The lag time was determined from a cross-correlation analysis between the mea-surements of CO2 and water vapor and Ta measured by the sonic anemometer. Between 17 June 1998 and 28 July 1998, the EC system was installed at different heights (15, 7.5, and 3 m) above the ground to mea-sure energy fluxes and CO2 and water vapor fluxes and concentrations at the central location.
2.3.4. Soil moisture
Gravimetric soil-moisture content was measured ev-ery 4 weeks on Tuesdays from 26 February through 8 October 1998 at five different locations in the B2C rain forest (but for only two locations in February). These locations are shown in Fig. 1b. Surface soil sam-ples (approximately 150 gm) were collected from 2 cm depth and oven-dried at 110◦C for more than 24 h. In addition, two ‘Watermark’ sensors (Campbell Sci-entific, UT; Model 257L) were installed at depths of 0.05 and 0.85 m near the central location to measure soil water potential. Data from these sensors were col-lected from 24 February 1998 through 15 May 1998 and from 21 July 1998 through 31 October 1998. Soil temperatures from the nearby soil thermocouples were used in the calculation of soil water potential.
2.4. Data analysis and quality control
There were no significant missing data periods in the AWS record for the B2C rain forest. However, ra-diation data for the central location are missing from 13 January 1998 through 27 January 1998, because radiation sensors were removed for cross-calibration. Data from each sensor used in the B2C were plot-ted for checking and quality control after each data download. Hourly, daily, and monthly average values of meteorological variables were calculated from the 15 min data. If three 15 min values were missing dur-ing an hour, the hourly average value for that hour was deemed unacceptable. Similarly, if 12 h of data were missing during a 24 h period, the daily average value for that day was deemed unacceptable. Data from missing days were not included when calculat-ing monthly average values, and misscalculat-ing hourly data also were not considered when calculating the mean monthly diurnal cycle for meteorological variables.
Meteorological data from all three ABRACOS sites were available as hourly average values. Daily aver-age, monthly averaver-age, and the mean monthly diurnal cycle of meteorological variables were calculated us-ing the same criteria given in the previous paragraph. A 4 h time difference was used to convert the GMT time used in the ABRACOS data to local Arizona time. Monthly average values of meteorological variables from the ABRACOS site were shifted by 6 months when comparing with similar values from the B2C rain forest to compensate for seasonal difference in the climate of the two regions, e.g., B2C data in Jan-uary were compared with ABRACOS data in July. The reader is advised to bear in mind this 6-month shift when viewing all monthly average and mean monthly diurnal plots from the ABRACOS data (e.g., Figs. 2 and 3), although, in fact, there is only limited seasonal change in the climate of the three Amazon sites.
3. Results
3.1. Climate characteristics
3.1.1. Mean climate of BIOSPHERE-2 rain forest biome
Fig. 2. Mean monthly values of incoming short-wave radiation (Si), net radiation (Rn), albedo, air temperature (Ta), vapor pressure (VP), and vapor pressure deficit (VPD) in the Biosphere-2 Center (B2C) rain forest biome (thick line) in comparison with 4-year (1991–1994) average values at the three Amazon rain forest sites at Reserva Jaru, Reserva Ducke, and Reserva Vale do Rio Doce (thin line).
forest. There is, for instance, a significant difference of about a factor of two between Si measured inside and outside the biome (not shown). Radiation absorp-tion (approximately 50%) by the B2C glass and space frame is high in comparison with the 10–20% absorp-tion reported for glass greenhouses (Mistriotis et al., 1997) because of the need for (6 cm diam) pipe struts to support the (12 mm thick) glass roof and walls. Over time, dust is deposited on the outer surface of the glass, and organic matter is deposited (by condensation) on the inner surface of the glass which contributes to the
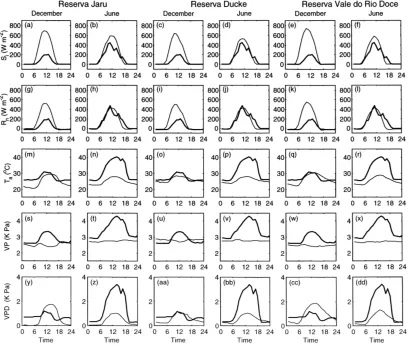
Fig. 3. Monthly mean diurnal cycles of incoming short-wave radiation (Si), net radiation (Rn), air temperature (Ta), vapor pressure (VP), and vapor pressure deficit (VPD) measured over the Biosphere-2 Center (B2C) rain forest (thick line) in comparison with 4-year (1991–1994) average values measured at the three Amazon rain forest sites at Reserva Jaru, Reserva Ducke, and Reserva Vale do Rio Doce (thin line).
their effect shows primarily as a net reduction in the average measured value. However, intermittent shad-ing may be significant when considershad-ing time-average physiological behavior because individual leaves high in the forest canopy in B2C spend part of the time in bright sunlight and part of the time in shade.
Fig. 2a–l illustrate the comparison between mean monthly values of Si and Rn in the B2C rain forest biome and 4-year (1991–1994) average values of these variables at the three Amazon rain forest sites. Fig. 2 confirms that there is consistently much less Sifalling on the canopy in B2C than in the Amazon case, typi-cally 75% less in the Arizona winter and 25% less in
prob-lem associated with local, anomalous shading by the supporting structure of the upward-facing radiometers in B2C. The measured values of Siand Rnfor Febru-ary seem lower than the annual trend would suggest.] Fig. 3a–l show the monthly mean diurnal cycles of Si, and Rn, measured above the B2C rain forest and 4-year (1991–1994) average values of these variables measured above the forest at the three ABRACOS sites. The monthly mean diurnal trend of Si and Rn changes noticeably with season in the case of the B2C rain forest, from typical peak values of about 200 W m−2 in December to 400 W m−2 in June. For the Amazon rain forest, the monthly average values of measured radiation are reasonably consistent be-tween sites, and there is much less seasonal change. The large difference in above-canopy Sibetween B2C and the Amazon generates a large difference in the above-canopy Rn in the Arizona winter. However, in the Arizona summer, the (then smaller) differ-ence in Si is almost canceled by a net downward long-wave radiation above the canopy. Consequently, the above-canopy Rn in B2C and the Amazon are quite similar. This interesting phenomenon is asso-ciated with a pool of hot air that is generated in the space above the canopy in B2C, which is described in greater detail in Section 3.1.2.
Fig. 2 j–r illustrate the mean monthly values of Ta, atmospheric vapor pressure (VP) and vapor pressure deficit (VPD) in the B2C rain forest biome in compar-ison with 4-year (1991–1994) average values of these variables measured at the three Amazon rain forest sites. In terms of monthly mean values, the B2C rain forest environment is reasonably similar to the Ama-zonian rain forest at all three sites in the Arizona win-ter, but there is a marked difference in the values of these parameters in the Arizona summer. In the B2C rain forest, monthly mean values of Ta, VP, and VPD are typically 27–31◦C, 2.8–3.5 kPa, and 0.6–1.5 kPa, respectively, while monthly mean values of these vari-ables in the Amazon rain forest are typically 22–26◦C, 2.0–2.7 kPa, and 0.4–1.4 kPa, respectively (see also Culf et al., 1996). The difference between B2C rain forest and Amazon rain forest climate during the sum-mer months occurs because increased radiative heat-ing enlarges the discrepancy for above-canopy Taand VPD.
Fig. 3m–dd show the monthly mean diurnal cycles of Ta, VP, and VPD measured over the B2C rain
for-est and 4-year average values of these variables over the three Amazon rain forest sites. At all the Amazon sites, the monthly average VP is about 2.5 kPa, fairly constant throughout the day, and similar throughout the year. There is, on the average, typically a 7–10◦C diurnal cycle in Ta, which also is similar throughout the year and which does not change greatly between sites. There is a marked daily cycle in VPD in the Amazon, with near saturation at night and, on the av-erage, VPD reaching peak values of 1–2 kPa during the day. In the Arizona winter, Taabove the B2C rain forest is broadly similar to the value above the three Amazon sites, but VP is higher during daylight hours, and the daily cycle in VPD is less than for the Ama-zon sites. In the AriAma-zona summer, the peak values of Ta, VP, and VPD above the B2C rain forest are all much larger than above the three Amazon rain forest sites. The reader is reminded that the B2C rain for-est data presented in Fig. 3 were recorded above the forest canopy. Subsequent measurements within the B2C rain forest canopy (described later) show that the within-canopy environment is very different from the above-canopy environment in the B2C and is in fact more similar to the within-canopy Amazon rain forest environment, even during the Arizona summer.
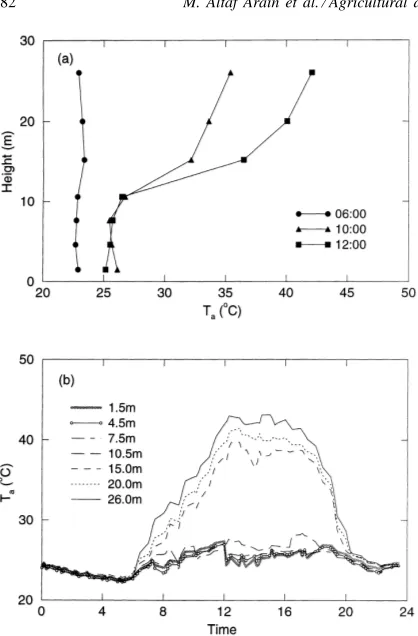
3.1.2. The vertical gradient of air temperature Fig. 4 shows Tameasured at 1.5, 4.5, 7.6, 10.6, 15.2, 20, and 26 m above ground level on a typical sum-mer day (22 June 1998) in the B2C rain forest. Fig. 4a shows Ta as a function of height at 6:00, 10:00, and 12:00 hours, while Fig. 4b shows Taat each mea-surement height as a function of time of day. Most of the change in Ta occurs between 10 and 15 m. Below 10 m, Ta is fairly constant with height and fairly con-stant through the day. Above 15 m, there is a steady rise in Ta during the morning (presumably resulting from the capture of solar energy by the overlying struc-ture of B2C). Above 15 m, Ta is reasonably constant during the afternoon, but it then falls off rapidly after dusk as the overlying structure cools by radiative (and perhaps convective) cooling processes.
Fig. 4. Air temperature (Ta) measured with thermocouple ther-mometers at 1.5, 4.5, 7.6, 10.6, 15.2, 20, and 26 m above ground level on 22 June 1998 in the Biosphere2 Center (B2C) rain forest at central location. (a) Taas a function of height at 6:00, 10:00, and 12:00 hours; (b) Taat each measurement height as a function of time of day.
causing die-back among the highest leaves and stems. However, an improved air-handling system meant that no die-back occurred during this study.) Hence, there are two very distinct temperature environments in the B2C rain forest during daylight hours. B2C has a com-paratively cool and reasonably well-mixed environ-ment below 10 m (whose temperature is in fact similar to that of the Amazon rain forest), and a hot, stable environment above 15 m. At night, the Ta in the B2C rain forest biome changes little with height.
3.1.3. Spatial variability of above- and within-canopy meteorology
A study was made of how meteorological variables differ at different locations in B2C and how they change with height through the rain forest canopy.
Because available instrumentation was limited, the study mainly involved using one set of instruments (a net radiometer and Ta/RH probe) which was sequen-tially mounted at different heights at the northern and southern locations (Fig. 1b). However, a second, sim-ilar set of instruments was available some of the time and, during the comparison with the southern site, this set of instruments was also mounted mid-canopy at the central location.
Hourly average values of weather variables mea-sured at four successive mounting positions (3 m apart) at the northern location are compared with values made with the reference system at the central loca-tion at a fixed height of 15.2 m in Fig. 5. Fig. 5a–c show data from 28 January to 1 February, Fig. 5d–f show data from 9–13 March, Fig. 5g–i show data from 16–20 April and Fig. 5j–l show data from 8–12 April 1998. When the two sets of instruments are at the same height (Fig. 5a–c), there is good agreement between the measured Rn, Ta, and VPD values at the two loca-tions. However, as the instruments sample successively lower levels, not only does the measured Rn reduce (as expected), but there is also a reduction in the daily cycle of Ta (compare Fig. 4) and a marked reduction in the daily cycle of VPD deep in the canopy. The greatest change seems to occur when the instruments are moved from 6 to 9 m below the above-canopy ref-erence level. The comparison of the hourly average values of weather variables measured at four different heights at the southern location with equivalent mea-surements made above the canopy at the central loca-tion is very similar to results shown in Fig. 5. On the basis of the measurements at one intermediate height (706 m) for which data are available, the in-canopy behavior of Taand VPD at the central location is con-sistent with that at the other two locations.
Fig. 5. Hourly average values of net radiation (Rn), air temperature (Ta), and vapor pressure deficit (VPD) measured at four different heights at the northern location (thick line) with equivalent measurements made above the canopy at the central location (thin line).
fairly quiescent body of in-canopy air and the air in the upper region of the B2C rain forest enclosure that is strongly heated during daylight hours.
3.2. Measurements with the eddy correlation system
3.2.1. Turbulent transport
The B2C rain forest biome is clearly not an appro-priate site for traditional micrometeorological mea-surements, but data collected at the central location with the EC system mounted at three levels above and within the forest canopy provide insight into aerody-namic transfer processes in the enclosed B2C rain for-est biome. The sensible heat, CO2, and water vapor flux measurements (although routinely calculated by
the eddy correlation software) are not considered re-liable and are disregarded in this analysis. The value of friction velocity, u∗, is similarly unreliable at most measurement levels but may have some relevance at the base of the canopy where there are sustained winds due to the air handling systems. Results for u∗are in-cluded here for this reason.
Fig. 6. Measurements for three 4-day periods (between 17 June 1998 and 28 July 1998) during which the eddy correlation (EC) system was installed at the central location at heights of 15, 7.5, and 3 m, respectively, under similar meteorological conditions. (a) Mean value of vertical wind speed (w) at the three levels; (b) variance of vertical wind speed (σw) at the three levels; (c) friction velocity (u∗) at the
three levels; and (d) value ofσw/u∗at 3 m level only.
obvious result is that there is very little turbulence at 7.5 and 15 m at the central location. However, near the base of the canopy (at 3 m), there is a fairly con-stant level of air turbulence. The higher and sustained turbulence at this level is almost certainly associated with the movement of air between the air handlers that are located below the canopy in the B2C rain forest biome. Nonetheless, Fig. 6d shows that (σw/u∗), the normalized standard deviation of w,is between 4 and 6, suggesting very stable conditions even at 3 m height.
These results indicate that the transfer of energy and mass in the B2C rain forest is in the form of mass flow and molecular diffusion. Although the measurement of mean vertical wind speed provided by the EC system is prone to offset error and drift, Fig. 6a suggests that vertical mass flow plays some role in vertical transfer. Assuming these data are reliable, there is evidence of a tendency for the mean air flow (at the central location)
in the B2C rain forest biome to be upwards at night and downwards during the day at both the bottom and above the canopy (at 3 and 15 m). It is intriguing that there is less evidence of a systematic daily cycle in vertical wind speed in the middle of the canopy (at 7.5 m). Perhaps this is because the EC system is in dense vegetation at this height, and the air prefers to flow through gaps elsewhere in the canopy.
3.2.2. Carbon dioxide and water vapor concentrations
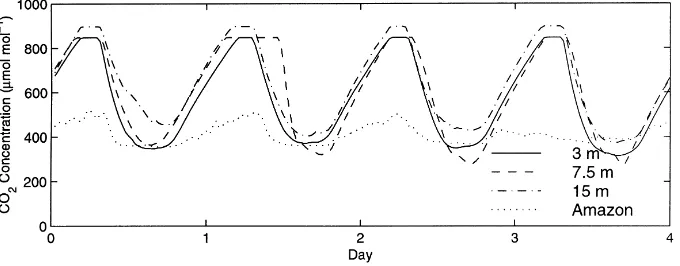
Fig. 7. Concentration of carbon dioxide (CO2) for three 4-day periods (between 17 June 1998 and 28 July 1998) measured by the eddy correlation (EC) system at heights of 15, 7.5, and 3 m, respectively, under similar meteorological conditions. The equivalent concentrations measured at the Anglo Brazilian Amazonian Climate Observational Study (ABRACOS) Reserva Jaru site on four typical days also are shown.
a predefined and limited range, and the concentration exceeded this range at night.
The most obvious result in Fig. 7 is that the CO2 concentration inside the B2C is, on an average, ap-proximately twice that of the earth’s atmosphere (com-pare the data from the ABRACOS Reserva Jaru site, Schimel et al., 1996; Culf et al., 1997). Further, the concentration of CO2undergoes a daily cycle of about a factor of two, much greater than that observed near the ground above the Amazon rain forest. Notwith-standing the fact that data for high concentrations are not available at night, the daily cycle of CO2 concen-tration does not seem to vary much with the height of the EC system in the rain forest canopy. Decay of organic matter and soil microbial activities are the pri-mary source of CO2 release into the atmosphere of B2C, and these activities persist throughout the day. In daylight hours, the plants in the B2C (in the rain forest and elsewhere) assimilate CO2 rapidly, which causes the sharp decline in CO2concentration during the day. The CO2concentration in B2C is strongly re-lated to the available solar radiation: on cloudy days, the minimum values of concentrations are higher than on (more common) sunny days. In general, the diurnal pattern of CO2concentration shown in Fig. 7 reflects the behavior of the entire BIOSPHERE-2 complex.
3.3. The water balance in the B2C rain forest
Overhead sprinklers are used to generate artificial ‘rain’ in the B2C rain forest. A few areas where
sprin-klers cannot be used are irrigated by drip irrigation. Typically, the sprinklers are turned on every 3–4 days, mainly on Tuesdays and Sundays. The amount of wa-ter applied during each application varies with season from the equivalent of about 7 mm in winter to about 11 mm in summer. Thus, the monthly precipitation in the B2C changes from around 30 mm per month in winter to about 50 mm per month in summer. Rain-fall in the Amazon is much more variable and changes greatly with location and season. At the ABRACOS Reserva Jaru site, for instance, monthly rainfall may be less than 10 mm per month in the dry season, but at other times of the year, rainfall at this site (and at the other ABRACOS sites) can be several hundreds of millimeters.
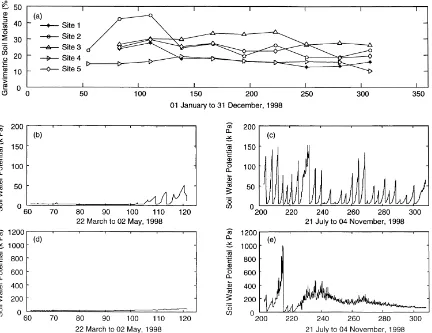
There is a small amount of drainage from the soil in the B2C, but most of the applied water evaporates as transpiration from the plants. Gravimetric measure-ments of the moisture content of the surface soil layer were made at five locations in the B2C rain forest dur-ing this study. The results, which are shown in Fig. 8a, demonstrate that there were significant differences (up to 15%) in the water content in the surface soil layer between sample points. These may merely re-flect local variations in the water-carrying capacity of the surface soils.
Fig. 8. (a) Gravimetric measurements of the moisture content of the surface soil layer near sites 1, 2, 3, 4, and 5 shown in Fig. 1b. (b) Soil water potential at 0.05 m for a period in the Arizona winter. (c) Soil water potential at 0.05 m for a period in the Arizona summer. (d) Soil water potential at 0.85 m for a period in the Arizona winter. (e) Soil water potential at 0.85 m for a period in the Arizona summer.
in the Arizona winter and approximately 100 days in the Arizona summer. Figs. 8b and c show the mea-sured water potential at 0.05 m depth for the winter and summer monitoring periods, respectively, while Fig. 8d and e show the measured water potential at 0.85 m depth for the winter and summer monitoring periods, respectively.
Fig. 8b and d demonstrate that there was little soil-moisture stress in the B2C soil at either sensor depth during the Arizona winter, although there is ev-idence of increasing soil-moisture stress towards the end of the observation period. Fig. 8c shows that, dur-ing the Arizona summer, near-surface soil-moisture stress begins to develop after each regular (3–4 days)
is because the amount of moisture provided has been optimized to maintain a small but finite drainage from the soil column. The lack of strong or prolonged moisture stress in B2C rain forest soils emulates well the observed lack of moisture stress in Amazon rain forest soils (e.g., Gash et al., 1996; Nobre et al., 1996).
4. Discussion
This paper reports the results of a systematic year-long study of the micrometeorological environ-ment in the enclosed B2C rain forest biome and pro-vides a comparison with similar micrometeorological measurements made during the 4-year ABRACOS study at the three rain forest sites in the Amazon River basin. Although much can be done to control the meteorology and atmospheric composition in controlled environments such as the B2C rain for-est biome, some factors are necessarily problematic. Clearly, the Si in a controlled environment depends not only on the opaqueness of the structure, but also on the geographic location of the facility and the ambient cloud cover outside the facility. A controlled environment located in Arizona cannot be expected to reproduce the small annual cycle in Si observed in tropical regions. However, this study shows that the often-cloudless skies in Arizona do significantly mitigate the effect of the glass and supporting struc-tures on the radiation regime inside B2C during the Arizona summer, but they cannot be expected to do so during the Arizona winter. In general, the solar radiation climate of B2C is broadly equivalent to that at a mid-latitude site where there is consistent partial cloud cover. Recognizing and quantifying this equiv-alence in solar radiation regimes may be helpful in selecting the type of study that can be carried out in the B2C with most real-world relevance.
The extent to which energy capture by the glass and supporting structure influences the Ta, VP, and VPD above the canopy inside the B2C rain forest biome became obvious in the course of the present study. In some respects, it is beneficial that the buoyancy of the warmed air isolates it from the air in the underlying vegetation. This means that the meteorology in at least the lower portions of the B2C rain forest canopy bet-ter resembles that in the Amazon. Forced mixing of the air in the B2C rain forest biome would enhance
the daily cycle of Ta, VP and VPD to which the rain forest vegetation is exposed and might thus worsen the overall comparability. Arguably, a better approach to enhance similarity with the real world would be to remove the energy near the roof of the B2C where it is captured by cooling the air.
In fact, the capture and storage of heat energy in the upper portions of the B2C rain forest biome is merely an example of a more general situation. A contained at-mosphere above a soil–vegetation system will always emphasize the daily cycle in ambient properties of the near-surface air relative to that observed in nature. In the real world, the land surface has comparatively easy access to a deep layer of air that is well-mixed dur-ing the day. Moreover, the daily average properties of the contained atmosphere can easily differ from those of the real atmosphere. It seems that seeking greater comparability between enclosed and real-world con-ditions necessarily requires that air be removed from the enclosed environment near the roof because this is where the containment has the most effect.
This study shows that the primary atmospheric transfer processes in the B2C rain forest (a combi-nation of mass flow and molecular diffusion) differ from those in the real world (a combination of tur-bulent transport and molecular diffusion). Removing this difference may well be an intractable problem because it is probably impossible to realistically re-produce the wind fields of a real forest in an enclosed environment. However, at the level of the cell or in-dividual plant organism, the plant is only aware of adjacent ambient conditions, not the physical trans-fer processes that in part determine those conditions. With this in mind, it seems that future studies of plant behavior in the B2C (and in the rain forest biome in particular) need to put greater emphasis on monitor-ing the local, in-canopy meteorological environment. It is not sufficient merely to monitor meteorological conditions in the biome as a whole and to assume that the atmospheric transfer processes in the B2C and the real world are the same and that ambient conditions near the vegetation are therefore similar.
5. Concluding remarks
BIOSPHERE-2 tropical rain forest biome with nat-ural rain forest biomes. The results revealed some significant differences between the micrometeorology of two environments which are associated with struc-tural aspects of the enclosure, and which will be used to guide future experimental research in this unique facility. Currently, B2C is installing a network of mass flow controllers for dispensing CO2. This system is designed not only to eliminate the unnatural diurnal variation of CO2 concentration, but also to maintain CO2concentration at prescribed, elevated levels, e.g., two to four times natural concentrations.
Acknowledgements
We are pleased to acknowledge the Columbia University BIOSPHERE-2 Center and its helpful staff (particularly the Bio-Operations and Research Groups) for their support during this study, and we congratulate Mr. Edward Bass for his vision in estab-lishing the B2C as a unique educational and scientific facility. During this study, one of the authors (MAA) was supported by a B2C/ISPE Fellowship, jointly funded by the BIOSPHERE-2 Center and the Insti-tute for the Study of Planet Earth (ISPE), University of Arizona. The ABRACOS field data were collected and made available by the UK Institute of Hydrology and the Instituto Nacional de Pesquisas Espaciais (Brazil). ABRACOS was a collaboration between the Agencia Brasileira de Cooperacao and the UK Over-seas Development Administration. Additional support for this study was provided in the form of instru-ment and computer resources and travel costs by The University of Arizona and for (WJS and OLS) from NASA grants NAG5-3854 and NAG8-1531. We also acknowledge Paul Houser, Adrian Southern, and Lisa Graumlich for their individual help and advice during the study, and we appreciate the editorial assistance provided by Corrie Thies.
References
Culf, A.D., Esteves, J.L., da Rocha, H.R., Margues Filho, A. de O., 1996. Radiation, temperature and humidity over forest and pasture in Amazonia. In: Gash, J.H.C., Nobre, C.A., Roberts, J.M., Victoria, R.L. (Eds.), Amazonian Deforestation and Climate. Wiley, Chichester, UK, pp. 175–191.
Culf, A.D., Fisch, G., Malhi, Y., Nobre, C.A., 1997. The influence of the atmosphere boundary layer on carbon dioxide measurements over tropical forest. Agric. For. Meteorol. 85, 149–158.
Gash, J.H.C., Nobre, C.A., Roberts, J.M., Victoria, R.L., (Eds.), 1996. An overview of ABRACOS. In: Amazonian Deforestation and Climate. Wiley, Chichester, UK, 611 p.
Gash, J.H.C., Nobre, C.A., 1997. Climate effects of Amazonian deforestation: some results from ABRACOS. Bull. Am. Meteorol. Soc. 78 (5), 823–830.
Grace, J., Lloyd, J., McIntyre, J., Miranda, A.C., Meir, P., Miranda, H.S., Nobre, C., Moncrieff, J., Massheder, J., Malhi, Y., Wright, I., Gash, J., 1995. Carbon dioxide uptake by an undisturbed tropical rain forest in southwest Amazonia, 1992 to 1993. Science 270, 778–780.
Hodnett, M.G., Tomasella, J., Marques Filho, A. de O., Oyama, M.D., 1996. Deep soil water uptake by forest and pasture in central Amazonia: predictions from long-term daily rainfall data using a simple water balance model. In: Gash, J.H.C., Nobre, C.A., Roberts, J.M., Victoria, R.L. (Eds.), Amazon Deforestation and Climate. Wiley, Chichester, UK, pp. 79–98. Houghton, J.T., Meira Filho, L.G., Callander, B.A., Harris, N., Katteberg, A., Maskell, K., 1996. Climate Change 1995: The Science of Climate Change. Report of the Intergovernmental Panel on Climate Change, Cambridge University Press, Cambridge.
Lin, G., Marino, B., Wei, Y., Adams, J., Tuniello, F., Berry, J., 1998. An experimental and modeling study of responses in ecosystems carbon exchanges to increasing carbon dioxide concentrations using a tropical rain forest mesocosm. Aust. J. Plant Physiol. 25, 547–556.
Mistriotis, A., Arcidiacono, C., Picuno, P., Bor, G.P.A., Scarascia-Mugnozza, G., 1997. Computational analysis of ventilation in greenhouses at zero- and low-wind-speed. Agric. For. Meteorol. 88, 121–135.
Moncrieff, J.B., Massheder, J.M., de Bruin, H., Elbers, J., Friborg, T., Heusinkveld, B., Kabat, P., Scott, S., Soegaard, H., Verhoef, A., 1997. A system to measure surface fluxes of momentum, sensible heat, water vapor and carbon dioxide. J. Hydrol. 188–189, 589–611.
Nicholls, N., Gruza, G.V., Jouzel, J., Karl, T.R., Ogallo, L.A., Parker, D.E., 1996. Observed climate variability and change. In: Houghton, J.T., Meira Filho, L.G., Callander, B.A., Harris, N., Katteberg, A., Maskell, K. (Eds.), Climate Change 1995. Cambridge University Press, Cambridge, pp. 133–192. Nobre, C.A., Gash, J.H.C., Roberts, J.M., Victoria, R.L. (Eds.),
1996. The conclusions from ABRACOS. Amazon Deforestation and Climate. Wiley, Chichester, UK, pp. 577–595.
Unland, H.E., Houser, P.R., Shuttleworth, W.J., Yang, Z-L., 1996. Surface flux measurement and modeling at a semi-arid Sonoran Desert site. J. Agric. For. Meteorol. 82, 119–153.
Wright, I.R., Nobre, C.A., Tomasella, J., da Rocha, H.R., Roberts, J.M., Vertamatti, E., Culf, A.D., Alvala, R.C.S., Hodnett, M.G.,