Stomatal compensation points for ammonia in oilseed rape plants
under field conditions
Søren Husted
a,∗, Jan K. Schjoerring
a, Kent H. Nielsen
a, Eiko Nemitz
b,
Mark A. Sutton
baPlant Nutrition Laboratory, The Royal Veterinary and Agricultural University, Thorvaldsensvej 40, 1871 Frederiksberg C, Copenhagen, Denmark
bCentre for Ecology and Hydrology, Edinburgh, Bush Estate, Penicuik, Midlothian EH26 OQB, UK
Received 1 February 1999; received in revised form 19 May 2000; accepted 20 June 2000
Abstract
Compensation points for gaseous exchange of ammonia (NH3) between stomata and the atmosphere were determined in
an oilseed rape (Brassica napus) canopy by analysing the concentrations of NH4+and H+in leaf apoplastic solution. This
bioassay approach was applied for the first time in the field, allowing the first intercomparison with compensation points derived from micrometeorological measurements.
Apoplastic NH4+and H+concentrations differed between leaf heights but values were relatively stable over time, both
diurnally and during a 2-week period. Stomatal NH3compensation points calculated on the basis of apoplastic NH4+and H+
concentrations and corrected for ambient leaf temperatures were found to correlate positively with the net NH3emission from
the canopy estimated by micrometeorological measurements. As there was little diurnal variability in apoplastic concentrations, this correlation was largely due to the effect of temperature on NH3solubility and NH4+dissociation in the apoplast, together
with similar effects of temperature on the net NH3flux.
Very high NH4+concentrations were also found in extracts of fallen litter and resulted in NH3partial pressures significantly
exceeding NH3levels in the atmosphere close to the ground. By comparison of vertical atmospheric NH3concentration profiles
in the plant canopy with the stomatal NH3compensation points determined here at three different plant heights, as well as
NH3partial pressures in the litter, it is shown that plant residues on the soil surface would have been the primary NH3source
while attached leaves acted as an NH3sink. Although it was not possible to measure apoplastic concentrations of siliques
(seed cases), bulk tissue NH4+/H+concentrations and vertical atmospheric NH3concentration profiles indicate that these
may have acted as an NH3source. © 2000 Elsevier Science B.V. All rights reserved.
Keywords: Stomatal compensation points; Oilseed rape plants; Brassica napus; Apoplast; Ammonium
1. Introduction
Ammonia (NH3) is an important atmospheric
pol-lutant with major impacts on atmospheric chemistry, acidification of ecosystems and on the stability and
∗Corresponding author.
E-mail address: [email protected] (S. Husted).
biodiversity of terrestrial oligotrophic biotopes (Bob-bink et al., 1992). Quantification of the NH3flux
be-tween vegetation and atmosphere is probably the most uncertain factor in the compilation of a global NH3
budget (Dentener and Crutzen, 1994).
Vegetation can act both as a source of or a sink for atmospheric NH3. The direction of the NH3 flux is
controlled by the canopy compensation point for NH3 0168-1923/00/$ – see front matter © 2000 Elsevier Science B.V. All rights reserved.
(Sutton et al., 1995), which is a composite parame-ter expressing the emission and deposition potential of NH3 from/to the canopy as influenced by the
dif-ferent pathways, i.e. stomatal exchange, NH3sorption
on leaf surfaces and liberation from degrading litter material. Ammonia emission from plant leaves oc-curs if the mole fraction of NH3in the atmosphere is
smaller than the mole fraction of gaseous NH3above
the leaf apoplastic water phase, while in the oppo-site case NH3absorption takes place (Farquhar et al.,
1980; Husted and Schjoerring, 1996). Plants grow-ing in low N input ecosystems like moorlands and forests generally appear to have NH3 compensation
points close to zero and tend to absorb NH3from the
atmosphere (Sutton et al., 1992; Langford and Fehsen-feld, 1992; Kesselmeier et al., 1993). However, agri-cultural crop species often have compensation points from 1 to 6 nmol NH3 mol−1 air (0.7–4.2mg m−3) under field conditions (Dabney and Bouldin, 1990; Schjoerring et al., 1993; Sutton et al., 1995; Yamulki et al., 1996) and significant losses of NH3may occur.
The NH3flux is linked to plant ontogeny and N supply
(Husted et al., 1996) and substantial NH3losses have
been observed in several agricultural crops, especially following flowering, where nitrogen compounds are remobilised from source organs (leaves and stems) to seed capsules and seeds (Schjoerring, 1997).
Controlled environment studies have clearly shown that NH3 emission from plants are controlled by
the stomatal NH3 compensation point (Husted and
Schjoerring, 1996), but there is very little information available on how stomatal NH3 compensation points
influence NH3 fluxes from plants under field
condi-tions. Thus, the aim of the present study was to apply a recently developed vacuum infiltration technique that enables analysis of the apoplastic H+and NH4+
con-centrations with very little cytoplasmic contamination (<2%) (Husted and Schjoerring, 1995). On the basis of apoplastic H+and NH4+concentrations measured
at different leaf heights above the ground, the stom-atal NH3 compensation points were calculated and
compared with micrometeorological NH3 flux
mea-surements and within-canopy NH3concentrations.
The field experiments were made in an oilseed rape (B. napus) field in central Scotland, UK, dur-ing June 1995 as part of the EU EXAMINE project North Berwick Experiment (Sutton et al., 2000a). The measurements here represent the first occasion
that micrometeorological data on NH3exchange have
been directly related to stomatal NH3 compensation
points calculated on the basis of apoplastic H+ and NH4+concentrations.
2. Materials and methods
2.1. Plant material and growth conditions
The oilseed rape field near North Berwick was lo-cated about 35 km east of Edinburgh, with experi-ments made in the period 7–17 June 1995. Fertilizer was applied on 29 August 1994, 23 February 1995, 15 March 1995 and 31 March 1995 with 60, 85, 85 and 55 kg N ha−1, respectively. The oilseed rape plants were in the maturation stage where seeds had devel-oped but were still green and much leaf abscission had taken place (leaves 1–12 in acropetal direction were lost). This ontogenetic stage is defined as growth stage 5.3 on the FAO scale.
2.2. Plant sampling and preparation
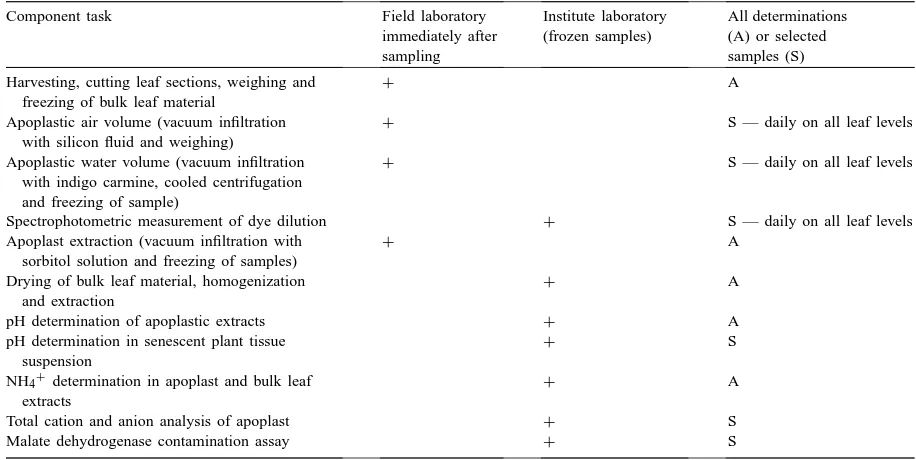
Table 1 summarizes the plant sampling procedures and steps in analytical methods for determination of stomatal NH3 compensation points for the North
Berwick experiment.
Bulk tissue NH4+ and apoplastic H+ and NH4+
concentrations were analysed in the period from 8 to 15 June 1995. Leaves were sampled at 9 a.m., 1 p.m. and 5 p.m. (GMT) from four different leaf positions within the canopy (0, 0.50, 0.75 and 1.25 m above ground) with four replicates. In two periods from 9 to 10 June and 14 to 15 June 1995, respectively, the analysis programme was extended in order to analyse diurnal variations in apoplastic NH4+and H+
concen-trations in relation to micrometeorological conditions. In both diurnal campaigns, leaves were sampled ev-ery 2 h from 9 a.m. and the following 24 h. It should be noted that this was a major task, which including subsequent extraction employed two full time staff in the field.
Table 1
Summary of steps in the methods used for determination of NH3 compensation points in oilseed rape leaves in the North Berwick field experiment. The table notes tasks performed in the field laboratory immediately after sampling, and tasks performed on frozen samples in the institute laboratory Harvesting, cutting leaf sections, weighing and
freezing of bulk leaf material
+ A
Apoplastic air volume (vacuum infiltration with silicon fluid and weighing)
+ S — daily on all leaf levels
Apoplastic water volume (vacuum infiltration with indigo carmine, cooled centrifugation and freezing of sample)
+ S — daily on all leaf levels
Spectrophotometric measurement of dye dilution + S — daily on all leaf levels Apoplast extraction (vacuum infiltration with
sorbitol solution and freezing of samples)
+ A
Drying of bulk leaf material, homogenization and extraction
+ A
pH determination of apoplastic extracts + A
pH determination in senescent plant tissue suspension
+ S
NH4+determination in apoplast and bulk leaf
extracts
+ A
Total cation and anion analysis of apoplast + S
Malate dehydrogenase contamination assay + S
infiltration of small leaf segments (25 mm×50 mm) with a 350 mOsm sorbitol solution (280 mM), which is isotonic with the leaf protoplast. The infiltration takes place in a 50 ml plastic syringe mounted on a hy-draulic arm that automatically moves the plunger up and down in order to infiltrate the leaf alternating un-der pressure and vacuum. The infiltrator exposed the leaf discs to 4 atm pressure and vacuum for 10 s, and repeated the procedure eight times, ensuring full infil-tration. Immediately after infiltration the leaf apoplast was extracted by centrifugation at 2000g for 10 min at 8◦C and the apoplastic solution (20–100ml) was col-lected in small Eppendorf vials. The apoplast extracts and plant tissue samples were frozen at−18◦C for a period of 14 days maximum in the field laboratory be-fore they were transferred to the institute laboratory and frozen down to−80◦C until final analysis.
2.3. Plant analysis
Bulk tissue NH4+was determined by drying plant
material at 80◦C for 12 h, followed by extraction of NH4+ with 0.025 M H2SO4. Comparison of
extractable NH4+ in oven-dried leaves with that of
lyophilized leaves showed no significant difference between the two methods.
The concentration of NH4+and NH3in the bulk
tis-sue extracts and in apoplast fluid was measured by flow injection analysis (FIA) in combination with online dialysis (Tecator FIA Star 5020, Höganäs, Sweden). The system had a detection limit of 1mM NH4+ in
50ml (50 pmol NH3). If less than 50ml apoplastic fluid was obtained, samples were diluted with 18.2 Mcm water (Q plus, Ultra pure water system, Milli-pore, MA).
Apoplastic pH was measured with a micro-com-bination-electrode enabling precise measurement in volumes down to 5ml (model 9802B, Orion, Boston, MA). Calibrations of pH were performed in low ionic strength buffers (Cat. No. 700001, Orion, Boston, MA) in order to obtain precise H+ activity measurements in the dilute samples of apoplastic fluid.
mobile phase was 4.0 mM HNO3, 0.1 mM EDTA and
2.5 mM 18-crown-6-ether (Sigma, St. Louis, MO) which enables detection of small amounts of NH4+in
the presence of high concentrations of Na+ and K+ by isocratic elution at 1.0 ml min−1. Inorganic anions (Cl−, NO3−, NO2−, H2PO4−, SO42−, CO32−) were
analysed by a traditional isocratic procedure on the ion chromatograph (Technical Bulletin 091064TP-O, Waters, MA).
The apoplastic extracts were screened for cyto-plasmic contamination by measuring their activity of malate dehydrogenase (MDH) relative to bulk leaf extracts (Husted and Schjoerring, 1995). The apoplast could not be isolated from the senescing leaves on the soil surface as the cytoplasmic marker enzyme activity of MDH was too high (data not shown). Thus, only bulk tissue NH4+concentrations were analysed
in senescent leaves. In order to estimate the partial pressure of NH3in the senescent leaves, pH was
de-termined in a 1:1 (tissue:water) suspension made on the basis of frozen samples and corrected for dilution.
2.4. Determination of apoplastic air and water volumes
Analysis of apoplastic air and water volumes are prerequisites for determination of the dilution factor, which is used for correcting NH4+ and H+
trations in extracted solution to their actual concen-trations in the leaf apoplastic solution (for details see Schjoerring and Husted, 1997).
Apoplastic air was determined by weighing and in-filtrating leaf segments with high-viscosity silicon oil (viscosity: 5 cs; density: 0.904 g cm−3; Dow Corning, Poole, UK) which is impermeable to the plasma mem-brane. The leaf segments were thereafter blotted dry with thin paper tissues, reweighed and the weight in-crease, corrected for the density of the silicone oil, used for calculation of the apoplastic air volume (Vair,
cm3 air cm−3 tissue). The amount of silicone oil
ad-sorbed to the cuticle resulted in an insignificant weight increase.
The volume of apoplastic water was assessed on the basis of the dilution of the dye indigo carmine (indigo-5,5′-disulphonic acid, Merck Chemicals) which does not adsorb to the cell walls (Husted and Schjoerring, 1995). Leaf segments were weighed and infiltrated with 50mM indigo carmine dissolved in
50 mM phosphate buffer at pH 6.2. Immediately after infiltration, leaves were reweighed and the weight increase, which corresponds to the infiltration volume (Vi), recorded. The leaf segment was then put into a
small zippered polyethylene bag to eliminate water evaporation and stored for a maximum of 15 min at 4◦C before extraction by centrifugation. After extrac-tion the decrease in absorbance at 610 nm (1A610) was measured spectrophotometrically. The apoplastic water volume (Vapo) and dilution factor (fdil) could
then be calculated using the following equations:
Vapo=
On the basis of Eq. (2), the true apoplastic ion (X±) concentration was calculated as [X±]
apo =
[X±] fluidfdil.
2.5. Calculation of ammonia compensation points
Knowing the apoplastic NH4+ and H+
concentra-tions, the following equations can be used to calculate the stomatal NH3compensation point (χs):
χs =KdKH
Combining Eqs. (4) and (5) gives
χs =KH
KdCtot Kd+[H+]
(6)
Since the physiological ionic strength (I) in the apoplast deviates considerably from zero, the dissoci-ation constant for NH4+ (Kd) must be adjusted. This
was done by measuring the total ionic composition in the apoplast for leaves at 0.75 m above ground level. An ionic strength of 31.4 mM was found giving a cor-rected dissociation constant (Kd′) of 10−9.32using the
Henry’s law constant (KH) of 10−1.76 is not affected
by the ionic strength. All equilibrium constants listed above are given at 25◦C (298.13 K) and at a pressure of 1 atm and valid only atI =0 (Wagman, 1968).
The temperature dependence of the stomatal NH3 compensation point can be described by the
Clausius–Clapeyron equation (Husted and Schjoer-ring, 1996):
whereχs1 is the actual stomatal NH3 compensation
point at the temperature T1 andχs2 is the requested
NH3compensation point at a new temperature T2. R
denotes the gas constant (8.31 J K−1mol−1) and the enthalpies of dissociation (1Hdis0 ) and vaporisation (1Hvap0 ) are 52.21 and 34.18 kJ mol−1, respectively.
The stomatal NH3compensation point for the whole
plant canopy was calculated by weighting data from the leaf fractions in 0.50, 0.75 and 1.25 m height ac-cording to the leaf area for each level. Moreover, stomatal NH3compensation points were corrected to
the mean diurnal temperature (Eq. (7)) for each plant height and compared with the net NH3flux obtained
by micrometeorological techniques (see below).
2.6. Determination of NH3 flux and NH3 concentration profiles in canopy air
The NH3concentrations at different heights above
the canopy were continuously measured with two dif-ferent techniques viz. replicated continuous wet de-nuders of the type described by Wyers et al. (1993) and filter packs (see Sutton et al., 2000b) in order to obtain the net NH3flux. However, during the last
di-urnal campaign (14–15 June 1995) denuders and fil-ter packs were placed at three different heights above the soil surface in the canopy (h=1.38 m), whereas two additional denuders were used to measure the net NH3flux above the canopy.
2.7. Statistical analysis
The ratio between apoplastic concentrations of NH4+ and H+ was used to calculate the stomatal
compensation point for NH3 (see Eq. (3)). The
com-bined standard error for this ratio (see Figs. 1 and 2) was derived from the following equation:
S[NH4
3.1. Ion composition in the apoplast
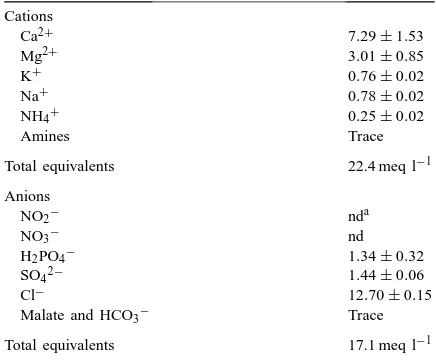
An ionic strength of 31.4 mM was obtained for the apoplast solution in leaves at 0.75 m height above soil surface (Table 2). This value changes pKdfor the
dis-sociation of NH4+from 9.25 to 9.32. The estimated
amount of cation equivalents exceeded anion equiva-lents by 31%.
3.2. Apoplastic NH4+ and H+ concentrations throughout the campaign
Values for both apoplastic NH4+ and H+
concen-trations were relatively constant in the long-term mea-surements running from 8 to 15 June 1995 (Fig. 1). The apoplastic NH4+concentration in leaves at 0.50,
0.75 and 1.25 m above soil surface was 0.41±0.03,
Table 2
Ion concentrations in the leaf apoplast of oilseed rape. Concen-trations are given in mM and the total ion concentration in meq l−1. Values are means of quadruplicate measurements±S.E. Cations
Total equivalents 22.4 meq l−1
Anions
Malate and HCO3− Trace
Total equivalents 17.1 meq l−1
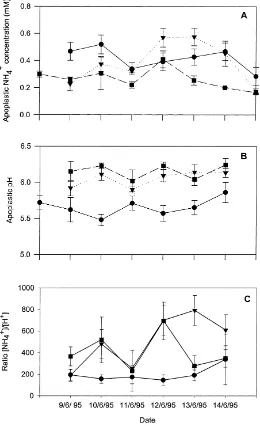
Fig. 1. (A) Daily means of apoplastic NH4+concentrations, (B) apoplastic pH values and (C) ratio of NH4+/H+measured at three heights above the ground ((d) 0.50 m, (j) 0.75 m, (m) 1.25 m) in the period 8–15 June 1995. Error bars are standard errors of 16 values (four replicates at four locations).
0.26±0.03 and 0.38±0.06 mM, respectively, and apoplastic pH values at the corresponding heights were 5.66±0.05, 6.15±0.04 and 6.05±0.04 (means± S.E.) The lowest apoplastic pH was always measured at 0.50 m, while the other leaf heights were very sim-ilar (Fig. 1). The trends for apoplastic NH4+ were
less clear, but concentrations in leaves at 0.75 m were significantly smaller than those at the other two leaf
heights (P < 0.05). There was a large variability in the ratio of [NH4+]/[H+] throughout the experiment,
particularly for the 0.75 and 1.25 m sampling heights. The relative standard errors (RSE) of the ratio be-tween NH4+and H+concentrations were calculated
on the basis of Eq. (8) and ranged from 7 to 86%. The errors associated with the fdil, used to correct the
tributed marginally (<10% RSE) to the overall error calculated by Eq. (8). Despite the considerable error associated with the estimates of the NH4+/H+ ratio,
there was some indication of a small increase (30%) with time in the mean NH4+/H+ratio.
3.3. Canopy profiles of NH4+and H+concentrations
Bulk tissue NH4+concentrations were measured at
four different leaf positions and apoplastic NH4+and
H+ concentrations were measured at three different leaf positions every 2–4 h in two diurnal campaign pe-riods (9–10 and 14–15 June 1995) (Fig. 2A–C). For both periods the largest bulk tissue NH4+
concentra-tions were found in the dropped leaves on the soil surface (17.2±8.3 and 23.0±2.3 mM, S.E.). Bulk tissue NH4+concentrations in the same campaign
pe-riods did not deviate significantly among the attached leaves ranging from 2.3±0.5 to 3.3±0.7 mM.
In both diurnal campaign periods, a general de-crease in apoplastic NH4+ concentrations was
ob-served from the bottom to the top of the canopy (Fig. 2B). Because no uncontaminated apoplastic fluid could be extracted from senescent leaves on the soil surface, as revealed by high MDH activities (data not shown), pH in a 1:1 suspension of tissue
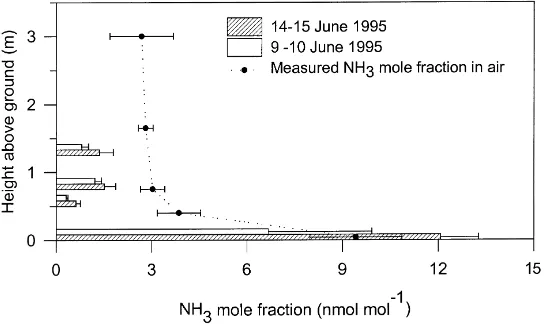
Fig. 3. Comparison of stomatal NH3compensation points determined on the basis of apoplastic NH4+and H+concentrations (horizontal bars) and measured atmospheric NH3concentrations (d) at different heights above the ground within the oilseed rape canopy. Similarly, the mole fractions of NH3in senescent leaves on the soil surface was calculated on the basis of pH and NH4+in leaf extracts. The apoplast and bulk tissue NH4+concentrations were analysed every 2–4 h during two diurnal periods (9–10 and 14–15 June 1995). Atmospheric NH3
concentrations in five different heights were determined every 10 min on 14–15 June 1995. All NH3 compensation points were adjusted to the actual air temperature at the various heights in the canopy by Eq. (7).
and sorbitol suspension was measured. The pH in leaf extract suspensions varied from 5.1 to 5.4 (data not shown), whereas apoplastic pH values increased from 5.4 in the lowest leaf position to 6.3 in top leaves (Fig. 2C).
The ratio between NH4+and H+(Fig. 2D), which
is linearly related to the gaseous NH3 mole fraction
above the apoplast (the stomatal NH3 compensation
point, Eq. (3)), followed the same pattern as observed for apoplastic pH, i.e. the highest values occurred in the mid-leaf fraction (Fig. 2C). In lower attached leaves, a ratio of 136–190 was found, increasing to 400–503 in the mid-position leaves.
3.4. Ammonia compensation points and canopy profiles of atmospheric NH3
Stomatal compensation points for NH3 at 25◦C
were calculated for all leaf positions (Eq. (6)) and corrected for temperature effects (Eq. (7)) using the diurnal mean leaf temperatures of 13.9, 14.4, 14.8 and 14.9◦C at 0.04, 0.50, 0.75 and 1.25 m plant height (Fig. 3). The calculated mole fraction of gaseous NH3 in dropped leaves was in general much higher
than the stomatal compensation points for NH3 in
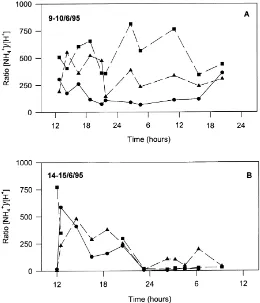
Fig. 4. Ratios of NH4+and H+concentrations at three different heights above the ground ((d) 0.50 m; (j) 0.75 m; (m) 1.25 m) for diurnal campaigns on (A) 9–10 June 1995 and (B) 14–15 June 1995. The relative standard errors of the ratios were on average 31% for both periods.
height had the significantly lowest (P < 0.05) NH3
compensation point.
The stomatal NH3compensation points were
com-pared with canopy profiles of atmospheric NH3
mea-sured at similar plant heights. The stomatal NH3
com-pensation points only exceeded atmospheric NH3
con-centrations in the dropped leaf fraction on the soil surface, while NH3compensation points were
signifi-cantly smaller in all the attached leaf positions (Fig. 3).
3.5. Diurnal variations in NH3compensation points and NH3flux
At all three leaf positions there was no distinct di-urnal trend in the ratio between NH4+and H+during
both diurnal campaigns (Fig. 4). For the second diur-nal campaign, the ratio was larger on 14 June than on 15 June. However, values were largest in the afternoon
and evening, rather than showing variations between day and night.
The ratio between NH4+ and H+ in the leaves at
0.50 m height was in both diurnal campaign periods generally lower than that in the leaf fractions at 0.75 and 1.25 m height, respectively (P <0.05). No signif-icant difference was observed between leaves at 0.75 and 1.25 m (Fig. 4).
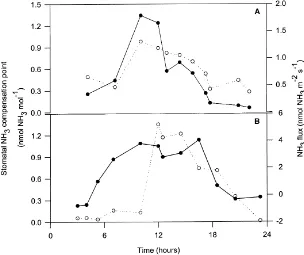
The net NH3emission and stomatal NH3
compen-sation points showed a clear diurnal trend in both di-urnal campaign periods (Fig. 5). Stomatal NH3
com-pensation points peaked around mid-day (0.98 and 1.35 nmol NH3 mol−1 air in the periods 9–10 June
and 14–15 June 1995, respectively) and gradually de-creased during the afternoon. Nocturnal values sta-bilized below 0.5 nmol NH3 mol−1 air (9–10 June
1995) or below 0.25 nmol NH3mol−1air (14–15 June
Fig. 5. Diurnal time course of the relationship between the net NH3emission from oilseed rape and the stomatal NH3compensation points estimated on the basis of apoplastic NH4+ and H+ for the canopy during the two campaigns: (A) 9–10 June 1995 and (B) 14–15 June 1995. (s) NH3 compensation points at leaf temperature; (d) net NH3 emission from the canopy. All NH3 compensation points were calculated using Eqs. (1)–(6) and corrected for temperature effects by Eq. (7). No in-canopy temperature profiles were available for the period 14–15 June and consequently all compensation points were adjusted using the canopy temperature profiles measured during the period from 9 to 10 June.
The relationship between NH3 fluxes and stomatal
NH3compensation points showed a linear correlation
(r = 0.887; slope significantly different from zero,
P <0.05), with an intercept of 0.34 nmol NH3mol−1
air. This analysis was only done on data from the pe-riod 9–10 June 1995, because NH3flux measurements
were lacking in some parts of the campaign from 14 to 15 June 1995 (Fig. 5B).
4. Discussion
The ionic strength was estimated at 31.4 mM in the leaf apoplast, which is at the upper limit of values from similar investigations on Pisum sativum and Spinacea
oleracea, where estimates ranged from 18 to 32 mM
(Speer and Kaiser, 1991). The ratio of analysed pos-itive to negative charges was in excess to 1.0 in the leaf apoplast solution. Speer and Kaiser (1991) and
Ruan et al. (1996) also observed a similar difference and suggested that the discrepancy was due to an un-derestimation of bicarbonate and carboxylates. Only trace amounts of these compounds were found in the present experiment, although it should be noted that amino acids were not analysed and that they may in-fluence the ratio between anions and cations.
Comparing the periods 9–10 June and 14–15 June, there was no significant differences in apoplastic NH4+ and H+ concentrations (P > 0.05), which
indicates stable physiological conditions in the plant canopy during the field campaign. This was further confirmed by results obtained in the long-term exper-iment from 8 to 15 June 1995, where standard errors were<10% (Fig. 1).
The canopy profiles of both bulk tissue and apoplas-tic NH4+ concentrations were similar with
and mean apoplastic pH values of 6.04±0.13 in the attached leaves of the canopy were of the same magni-tude as found in a previous study by Husted and Schjo-erring (1996), where values of 0.3–0.6 mM NH4+and
pH values of 5.3–5.9 were observed in oilseed rape. The ratio between bulk tissue and apoplastic NH4+
concentrations was on average 8.0±0.7, which is com-parable with ratios between 3 and 16 observed around anthesis in the previous study by Husted and Schjo-erring (1996). For plants growing under controlled environmental conditions in growth chambers, the ratio between bulk tissue and apoplastic NH4+
de-clined 3–8-fold with increasing plant nitrogen status and external N availability (Mattsson et al., 1998; Husted et al., 2000). Further investigations are re-quired to evaluate the functional relationship between apoplastic NH4+concentrations and leaf tissue NH4+
concentrations.
The stomatal ammonia compensation point de-creased sharply from the bottom to the top of the canopy (Fig. 3, see also Nemitz et al., 2000), which Nemitz et al. (2000) showed to be due to NH3
lib-eration in decomposing fallen plant residues on the soil surface. Denmead et al. (1976) and Schjoerring et al. (1993) likewise found a sharp decrease in NH3
concentration with height above the soil surface in a mixed ryegrass/clover canopy and barley canopies, respectively. In contrast, Sutton et al. (1993) observed smaller NH3 concentrations near the ground within
the canopy (0.8 m) of an intensive short rotation grassland. What is of interest for the oilseed rape here is that the near surface concentrations were so large, often exceeding 10 nmol NH3mol−1air.
Comparison of calculated stomatal NH3
compen-sation points based on apoplastic NH4+ and H+
concentrations with vertical profiles of atmospheric NH3 mole fractions in the canopy showed that
fo-liar stomatal compensation points were smaller than within-canopy air concentrations. In contrast, air concentrations in equilibrium with the decomposing plant residues were an order of magnitude larger. The larger NH3 air concentrations measured
imme-diately above the litter reflected this, indicating that the plant residues were the main source of NH3
within the canopy. In contrast, attached leaves acted as sinks for atmospheric NH3. However, it should
be noted that these data are mean diurnal values and it is possible that temporary fluctuations may occur
in which the source/sink pattern may change due to short-term temperature fluctuations. Using the inverse Lagrangian technique, Nemitz et al. (2000) confirmed that plant residues on the soil surface were the major source of NH3 in the canopy air. However, it was
further suggested that NH3 originating from the soil
surface was recaptured within the lowest 0.7 m and that the observed net NH3emission from the canopy
was due to a source at the canopy top. This points to the siliques as being a possible source. The apoplas-tic extraction technique has not yet been applied to
B. napus siliques and the importance of this fraction
cannot be determined at present. However, bulk tissue NH4+ in this fraction may be 3–5 times higher than
in attached leaf fractions around anthesis (Husted, 1997). Thus, it is not unlikely that siliques can act as an important source of atmospheric NH3.
No diurnal trend in stomatal NH3 compensation
points calculated at 25◦C on the basis of the ratio of apoplastic NH4+ to H+ concentrations, was
ob-served for neither intact leaves nor plant residues on the soil surface. This indicates that the physiological conditions were similar during the two diurnal pe-riods (9–10 and 14–15 June 1995) and that no sig-nificant accumulation/depletion of NH3took place in
the apoplast when the NH3flux changed. Recent
in-vestigations using the stable isotope15N have shown that the apoplastic solution in B. napus constitutes a highly dynamic NH4+ pool (Nielsen and
Schjoer-ring, 1998). Ammonium is constantly added to this pool via NH3/NH4+efflux from the mesophyll cells,
and is constantly retrieved by a system involving a transporter with channel-like properties which is able to respond very rapidly (< 112min) to perturbations in apoplastic NH4+ concentration, thereby
maintain-ing apoplastic NH4+ homeostasis. Investigations into 15NH
4+ uptake into B. napus leaf protoplasts (J.N.
Pearson, J. Finnemann and J.K. Schjoerring, unpub-lished results) have revealed the presence of an addi-tional high-affinity NH4+uptake system similar in
ki-netics to the AMT1 transporter observed in
Arabidop-sis, tomato and rice (Ninnemann et al., 1994).
When stomatal NH3 compensation points were
adjusted to the air temperature in each of the four sampling heights and weighted stomatal NH3
observed, which agreed with the diurnal trend for the NH3 flux (Fig. 5A and B). Regression analysis
re-vealed that a close linear relationship existed between NH3 flux and stomatal NH3 compensation points
adjusted for temperature effects (R = 0.887). This demonstrates the importance of canopy temperature as a major determinant of the compensation point and net exchange fluxes of NH3. Since there was no
diurnal variation in the ratio of [NH4+] to [H+], it is
clear that the temperature effect dominates the diurnal variation in the stomatal compensation point. This is an important finding for developing models of NH3
exchange, since the temperature response (Eq. (7)) is well known and easy to implement.
The correlation in Fig. 5 might be considered for-tuitous, since it has been noted above that the rape leaves were generally a sink for rather than a source of ammonia. However, while emissions from the deposing rape leaves might be expected to have a com-plex interaction with temperature and wetness (gov-erning mineralization and evaporation) as Nemitz et al. (2000) have shown, most of these emissions would be recaptured by the live oilseed rape leaves. In contrast, where siliques provide the main source of net emission above the canopy, these would be subject to the same temperature dependence of solubility and dissociation as the leaves. The close relationship between the net flux and the stomatal compensation point would there-fore suggest that diurnal variability in [NH4+]/[H+]
is also unimportant for siliques.
5. Concluding remarks
This paper represents the first attempt to relate data from micrometeorological measurements of NH3
ex-change fluxes to stomatal NH3 compensation points
calculated on the basis of H+ and NH4+
concentra-tions in the apoplast. It was shown that apoplastic NH4+and H+concentrations and the calculated
com-pensation points for NH3 at 25◦C were more or less
constant both diurnally and during a long-term period of 8 days. However, when stomatal NH3
compensa-tion points were corrected for the leaf temperature, a clear diurnal variation was observed, which agreed with the diurnal pattern of the NH3flux. This finding
is very valuable for the development of NH3exchange
models since the canopy temperature profile is easy
to measure and in addition only a limited number of apoplastic samples need to be analysed for NH4+and
H+ in order to determine the compensation point for NH3.
Acknowledgements
We express our thanks to Mr. J. Grant-Suttie for access to the rape field, and to Mr. J. Landless, Univer-sity of Edinburgh (Institute of Ecology and Resource Management) for access to leaf area analyzer. Finan-cial support from the EU (contracts EV94-CT-0426 EXAMINE “Exchange of atmospheric ammonia with European ecosystems”) and grants from The Dan-ish Agricultural and Veterinary Research Council, Denmark and Department of Environment (contract EPG 1/3/28), UK are gratefully acknowledged. Final analysis of the measurements was conducted under the EU GRAMINAE project.
References
Atkins, P.W.,1990. Physical Chemistry, 4th Edition. Oxford University Press, Oxford, pp. 249–252.
Bobbink, R., Heil, G.W., Raessen, M.B.A.G., 1992. Atmospheric deposition and canopy exchange processes in heathland ecosystems. Environ. Pollut. 75, 29–37.
Dabney, S.M., Bouldin, D.R., 1990. Apparent deposition velocity and compensation point of ammonia inferred from gradient measurements above and through alfalfa. Atmos. Environ. A 24, 2655–2666.
Denmead, O.T., Freney, J.R., Simpson, J.R., 1976. A closed ammonia cycle within a plant canopy. Soil Biol. Biochem. 8, 161–164.
Dentener, F.J., Crutzen, P.J., 1994. A three dimensional model of the global ammonia cycle. J. Atmos. Chem. 19, 331–369. Farquhar, G.D., Firth, P.M., Wetselaar, R., Weir, B., 1980. On
the gaseous exchange of ammonia between leaves and the environment: determination of the ammonia compensation point. Plant Physiol. 66, 710–714.
Husted, S., 1997. Physiological and biochemical regulation of plant–atmosphere ammonia exchange. Ph.D. Thesis. The Royal Veterinary and Agricultural University, Copenhagen, Denmark. Husted, S., Schjoerring, J.K., 1995. Apoplastic pH and ammonium concentration in leaves of Brassica napus L. Plant Physiol. 109, 1453–1460.
Husted, S., Mattsson, M., Schjoerring, J.K., 1996. Ammonia compensation points in two cultivars of Hordeum vulgare L. during vegetative and generative growth. Plant Cell Environ. 19, 1299–1306.
Husted, S., Hebbern, C.A., Mattsson, M.A., Schjoerring, J.K., 2000. A critical experimental evaluation of methods for analysing of NH4+ in plant tissue, xylem sap and apoplastic
fluid. Physiol. Plant 109, 167–179.
Kesselmeier, J., Merk, L., Bliefernicht, M., Helas, G., 1993. Trace gas exchange between terrestrial plants and the atmosphere: carbon dioxide, carbonyl sulphide and ammonia under the rule of compensation points. In: Slanina, J., Angeletti, G., Beilke, S. (Eds.), General Assessment of Biogenic Emissions and Deposition of Nitrogen Compounds, Sulfur Compounds and Oxidants in Europe. CEC Air Pollution Research Report No. 47, Brussels, pp. 71–80.
Langford, A.O., Fehsenfeld, F.C., 1992. Natural vegetation as a source or sink for atmospheric ammonia: a case study. Science 255, 581–583.
Mattsson, M., Husted, S., Schjoerring, J.K., 1998. Influence of nitrogen nutrition and metabolism on ammonia volatilization in plants. Nutr. Cycling Agroecosyst. 51, 35–40.
Nemitz, E., Sutton, M.A., Gut, A., San José, R., Husted, S., Schjoerring, J.K., 2000. Sources and sinks of ammonia within an oilseed rape canopy, Ammonia Fluxes with Oilseed Rape. Agric. For. Meteorol. 105, 385–404.
Nielsen, K.H., Schjoerring, J.K., 1998. Regulation of apoplastic NH4+ concentration in leaves of oilseed rape. Plant Physiol. 118, 1361–1368.
Ninnemann, O.W., Jauniauex, J.C., Frommer, W.B., 1994. Identification of a high affinity ammonium transporter from plants. EMBO J. 13, 3464–3471.
Ruan, Y.L., Patrick, J.W., Brady, C.J., 1996. The composition of apoplast fluid recovered from intact developing tomato fruit. Aust. J. Plant Physiol. 23, 9–13.
Schjoerring, J.K., 1997. Plant–atmosphere ammonia exchange. Quantification, physiological regulation and interactions with environmental factors. D.Sc. Thesis. The Royal Veterinary and Agricultural University, Copenhagen, Denmark.
Schjoerring, J.K., Husted, S., 1997. Measurement of ammonia gas emission from plants. In: Linskens, H.-F., Jackson, J.F. (Eds.),
Modern Methods of Plant Analysis, Vol. 19, Plant Volatile Analysis. Springer, Berlin, pp. 73–95.
Schjoerring, J.K., Kyllingsbæk, A., Mortensen, J.V., Byskov-Nielsen, S., 1993. Field investigations of ammonia exchange between barley and plants and the atmosphere. I. Concentration profiles and flux densities of ammonia. Plant Cell Environ. 16, 161–167.
Speer, M., Kaiser, W.M., 1991. Ion relations of symplastic and apoplastic space in leaves from Spinacia oleracea L. and Pisum sativum under salinity. Plant Physiol. 97, 990–997.
Sutton, M.A., Moncrieff, J.B., Fowler, D., 1992. Deposition of atmospheric ammonia to moorlands. Environ. Pollut. 75, 15–24.
Sutton, M.A., Fowler, D., Moncrieff, J.B., Storeton-West, R.L., 1993. The exchange of atmospheric ammonia with vegetated surfaces. II. Fertilized vegetation. Quart. J. R. Meteorol. Soc. 119, 1047–1070.
Sutton, M.A., Schjoerring, J.K., Wyers, G.P., 1995. Plant– atmosphere exchange of ammonia. Phil. Trans. R. Soc. London A 351, 261–278.
Sutton, M.A., Nemitz, E., Fowler, D., Wyers, G.P., Otjes, R.P., Schjoerring, J.K., Husted, S., Nielsen, K.H., San Jose, R., Moreno, J., Gallagher, M.W., Gut, A., 2000a. Fluxes of ammonia over oilseed rape: overview of the North Berwick experiment, Ammonia Fluxes with Oilseed Rape. Agric. For. Meteorol. 105, 327–349.
Sutton, M.A., Nemitz, E., Fowler, D., San José, R., Moreno, J., Wyers, G.P., 2000b. Micrometeorological measurements of ammonia fluxes over oilseed rape using continuous and batch sampling methods, Ammonia Fluxes with Oilseed Rape. Agric. Forest Meteorol. 105, 351–369.
Wagman, D.D., 1968. Selected values of chemical thermodynamic properties, US National Bureau of Standards, Technical Notes, pp. 270–273.
Wyers, G.P., Otjes, R.P., Slanina, J., 1993. A continuous-flow denuder for the measurement of ambient concentrations and surface-exchange fluxes of ammonia. Atmos. Environ. A 27, 2085–2090.
![Fig. 2. Canopy profiles of (A) bulk tissue NH4+ concentrations, (B) apoplastic NH4+ concentrations, (C) apoplastic H+ concentrationsand (D) [NH4+]/[H+] ratios in oilseed rape apoplastic solution during the two diurnal campaign periods 9–10 and 14–15 June 19](https://thumb-ap.123doks.com/thumbv2/123dok/3167722.1387308/7.612.176.425.66.584/proles-concentrations-apoplastic-concentrations-apoplastic-concentrationsand-apoplastic-campaign.webp)