UBISOUND: DESIGN A USER GENERATED MODEL IN UBIQUITOUS GEOSPATIAL
INFORMATION ENVIRONMENT FOR SOUND MAPPING
S. Soleimani*, E. Keshtehgar, M. R. Malek
K.N. Toosi University of Technology, Faculty of Geodesy and Geomatics Engineering, Tehran, Iran (ssoleimani, ehsanali.keshtehgar)@mail.kntu.ac.ir, [email protected]
KEY WORDS: Ubiquitous GIS, VGI, Spatial Analysis, Sound Mapping, Context Awareness, Risk Assessment
ABSTRACT:
In this paper, we study how mobile computing and wireless technologies can be explored to provide effective ubiquitous GIS services. Instead of reinventing the wheels, we make use of smartphones, off-the-shelf components, and existing technologies in ubiquitous computing (i.e. wireless and mobile positioning technologies, and data acquisition techniques and processing via sensors) to develop a middleware, and tools for the development of systems and applications to provide effective ubiquitous GIS services. Two main tasks to be studied are: 1) Developing a framework, called UbiSound, to provide the infrastructure and architectural support for realizing ubiquitous GIS services; and 2) Designing and developing ubiquitous GIS applications by utilizing the UbiSound framework to let users experience and benefit from the context aware services. We use scenario to illustrate how mobile/wireless and sensor technologies can enable ubiquitous GIS services in UbiSound. Some of the examples included in UbiSound are: Noise mapping, soundscape mapping and wellbeing data acquisition and analysis.
* Corresponding Author
1. INTRODUCTION
At the start of 2014, there were 6.7 billion mobile subscriptions worldwide Already 1.9 million or 28 percent mobile phone users use a smart phone (Ericson, 2014). The mobile phone has become a personal and permanent companion. As such, mobile phones are increasingly adopted as a suitable platform for personal health monitoring in our daily environment. It has been used to monitor and share personal step count, sleep quality, social interaction and so on. In addition, environmental data directly influences the health of the population. Several projects have envisioned mobile phones sensing potentially harmful environmental conditions in the environment of their owners. Since air quality levels can usually not be measured by the internal sensors of commodity mobile phones, additional modules are attached to the phones to undertake air quality monitoring (Rosser and Eccleston, 2011). In this case the mobile phone serves as controller and gateway, controlling the sensors, collecting the data and sending it wirelessly to servers. Noise pollution is considered as one of the important issues in high populated cities like Tehran city. Even though it seems to have less damage than air, land and water pollution, as a matter of fact because of its majority negative impacts on human health and behaviour as well as plants and animals, it is considered as environmental pollution which shows increase in parallel with the growth of all aspect of society (Stevens, 2012; Srivastava, 2014). It is noteworthy to say that not all the noise can be called as noise pollution, and generally, all the sound can mean different to different people. When it happens irregularly, it may be termed just as nuisance rather than noise pollution, for instance barging dog and car alarms. Noise, as an unwanted and interrupting sound is almost opposed to soundscape which is defined as a pleasant sound through an area. Hence, one could be use soundscape approach to noise control (Irvine, 2009). Describing in this research is a model to illustrated sound maps, in two categories of soundscape map and noise map, in a
specific area. This people-centric model lets people to participate and to share their experience with other in order to let governments make a better decision in city managements. This is of great importance because that almost all contamination cannot be addressed by policy makers only, as it requires taking into account the behaviour of all citizens (Stevens, 2012). Therefore, there’s been enabled for participators to leave their comments about the recorded voice and to tag an image of the place in order to get a comprehensive definition of public perception about the type and category of the sound.
Due to the poor knowledge of adverse effect of noise pollution among the various types of pollutions, a user-generated content is used because of its ability to elicit the idea of the people in order to augment their information and knowledge about the issues (Stevens, 2012). Moreover, the most decisive component of all participatory systems is their ability of geolocating (Drosatos, 2014) which enables the system to produce some maps such as noise map (Stevens, 2010), soundscape map and a map showing the relation between land use and environmental noise (King, 2012), to name but a few.
the noise and soundscape in any time and any place they are (Keshtegar et al., 2014). In addition, this study not only helps to raise people’s awareness of the issues at hand but also gives opportunity to directors to better comprehend of people’s preference about the type of the sounds.
The rest of the paper is organized as follows: Section II looks at the related work to show the role of ubiquitous computing technology and participatory sensing in noise pollution and soundscape mapping. Section III introduces UbiSound architecture and components while Section IV looks into methodology and approach. The conclusion and future work are in Section V.
2. BACKGROUND AND RELATED WORKS
Extensive efforts have been made to realize ubiquitous computing in pollution monitoring (Stevens, 2010) in related systems and researches. With the development of ubiquitous computing technologies to improve quality of services, users can now more easily access useful information. In other hand with advent of web 2.0 technologies which lets a large crowd of users to participate, the digital participation technologies namely NeoGeography (Goodchild, 2009) were developed defining as participatory sensing such as Volunteered Geographic Information (VGI) system. Consequently, VGI effectuated a context to capture all kind of pollution data in general and noise pollution in particular, on user location (D'Hondt, 2013; Drosatos, 2014).
Kanyo et al. (Kanjo et al., 2008) developed MobGeoSen, a mobile phone based system that utilizes different sensors to measure environmental pollution like carbon monoxide level. The app also allows uploading pictures of the places related to the data. Pictures and measurement from a user are displayed using Google Earth. Previous works, including (Kanjo et al., 2008), have considered the mobile phone as a platform to chronicle noise exposure. Since all mobile phones are equipped with a microphone, these projects do not suffer from the need to use additional sensors.
NoiseTube (Maisonneuve et al., 2009) is a mobile phone sensing application using web portal. The application enables personalized access to the several noise measurements on Google Earth. Moreover, NoiseTube makes people aware of their daily noise exposure.
Noise Spy (Kanjo, 2010) is a sound sensing system that allows user to turn their mobile into a data recorder. Noise Spy gets and keeps user’s interest by aspect such as monitoring detailed information of noise in their local environment in an entertaining and compelling way. Actually, it must be designed to handle the problems and the effects of noise, including noise reduction if necessary.
Ear-Phone (Rana et al., 2010) is a state-of-the-art, but inexpensive urban noise mapping system. The recorded sound by phones microphone and a geo-tag data was sent to server to be analysed and mapped. This “end-to-end noise pollution” mapping system approximates the missing data using Australian acoustic standard.
WideNoise (Atzmueller et al., 2012) is an application for collaborative noise collection that originally is developed by WideTag. WideNoise allow people to measure the noise and to report the recorded data to the server. Also, this application offers users to share their measurements on social networks such as Facebook to raise awareness.
NoiseBattle (Martí et al., 2012) is a “gamified mobile
application” which conquers the city by better noise
measurements of participators. It uses NoiseDroid application to take noise samples. Finally who take a more accurate sample
would be winner and could send their gathered noise to their game competitors. From the other hand government can detect underlying problems which could threaten human health and try to solve it.
NoiseTubePrime (Drosatos, 2014) is a “first operational privacy-preserving system for participatory sensing” in the context of NoiseTube. It lets individuals to make a transaction in which needs minimum personal data to be disclosed. This service outsourced in the cloud-computing instead to run as a service machine by encrypting all data in order to deal both privacy and interoperability issues.
SoundOfTheCity (Ruge et al., 2013) is a continuous, context-aware and unobtrusive participatory sensing approach, to measure the noise levels, and to monitor the exposure of
community’s noise for a healthy city. This application not only
allows participants to record the sound, but also lets them to annotate the classification of the recorded sound by cause. Moreover, SoundOfTheCity finds the most pleasant place in the city for the citizen.
A few study (Liu et al., 2014; Fortkamp, 2001) researches on soundscape as an approach to noise control. Soundscape researches want to assess people attitudes to soundscape as whole rather than individual aspects in order to understand how the entire environment could be change to create a harmony restful to the ear and mind (Berglund, 2001). This process has to be taken under consideration of physical, psychological and socio acoustical (Fortkamp, 2001). Regards to that language (Raimbault, 2003) can access to the individual representation, in (Tsai, 2001) the cause-and-effect analysis of psychology structure of environment exerted to explore the interaction between sight and soundscape. The analysis showed that, sight influences the sound in which good or moderate sight can increase the favour sense of the people and on the contrary bad sights worsen people’s feeling about sound.
3. UBISOUND: SYSTEM ARCHITECTURE AND COMPONENTS
Despite all benefits user-generated content has, it faces some issues including privacy of Information, quality of data, and lack of proper condition for volunteers to participate in geographical data collection and so on. Also, as a matter of fact, volunteers need some motivation such as receiving context aware services from the server in order to persuade them to participate. Consequently, this study presents a type of U-VGI architecture that exploits the power of VGI to collect multidimensional real world data, using smartphones and mobile devices in ubiquitous computing environment for Noise Pollution. Following, the architecture and scenario of UbiSound system is explained.
A. System Architecture
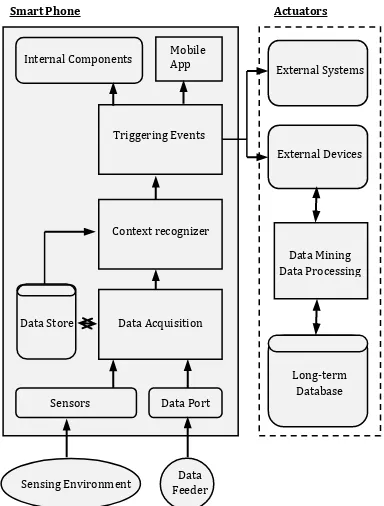
Fig. 1 shows the system architecture of the proposed ubiquitous sound mapping framework, called UbiSound, which is developed based on a commercially available smartphone. It consists of two main components: the smartphone and actuators. They communicate with each other by a wireless network or a mobile network.
interpreted by the context recognizer and then be stored for further analysis and recorded as historical data.
Through the data acquisition and context recognizer, raw data are transformed into useful information about the user and environment and generalized into domain knowledge and be recorded into the data storage. Pre-defined or adaptive firing rules within the context recognizer may be fired to produce one or more triggering events, e.g., a high Noise Index may indicate a critical health status. These triggering events will in turn take one or some of the following actions for the next stage of the processing:
1) Set some flags to further trigger for other events within the device;
2) Generate a message system, or issue a visual or audio warning as a simple alert;
3) Activate an application (Mobile App) to provide a more comprehensive healthcare service; and
4) Signal a designated actuator to react to the triggering event. The actuators can be external devices (e.g. voice recorder, Flashing lights), or an external databases (e.g. map of noisy streets, factories, etc.), or a noise pollution portal assessing the noise map condition(s). These records will be stored in the
system’s long term database for further data processing,
analysis, mining, and warehousing.
Figure 1: System Architecture of UbiSound
In order to realize ubiquitous VGI services, the underlying network infrastructure is another critical issue in the framework. Taking the network-centric view, recent telecommunication advancement had played an important role in integrating the mobile networks, the wireless networks and the wired network into one single platform to provide all the communication need to enable ubiquitous computing. The efficient communication between the actuators and smartphones can be easily achieved with high reliability in indoor or even outdoor environment. In addition, the wireless communication can serve as an effective tool for locating and tracking users, which are important issues in context aware service.
B. Communication Infrastructure of UbiSound
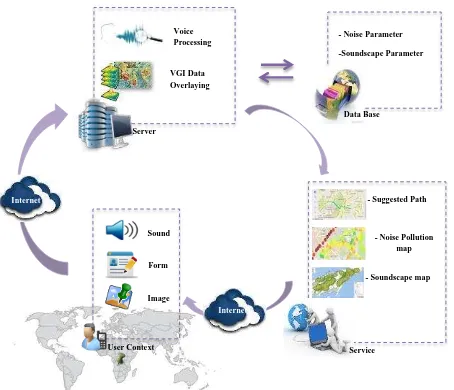
To provide an efficient prototyping environment for developing systems and applications for ubiquitous VGI, we have to integrate ubiquitous computing through efficient methods. Ubiquitous computing relies heavily on the full support from the underlying network infrastructure ranging from Personal Area Network (PAN), Wireless Sensor Networks (WSN), Wireless Area Network (WLAN), Mobile Phone Network (3G and 4G (LTE)), Local Area Network (LAN), and eventually to the Internet. It comes to the approach of networking everywhere and the change in connections needs to be seamless. In our infrastructure, we make use of WLAN to provide seamless networking services in indoor environment, while utilize public mobile networks, e.g., cellular 3G or 4G networks in outdoor environment for larger coverage (Fig. 2). Not only in connectivity and mobility, ubiquitous computing also demands the underlying network to provide accurate location information for implementing context-aware services and applications.
Internet
Pollution Database
2.5G/3.5G
Access Point WiFi Access point
Figure 2. Scenario of UbiSound
4. METHODOLOGY AND APPLICATIONS IN UBISOUND
A. Approaches
An architectural diagram of the UbiSound system is shown in Fig.1 and how its scenario goes is illustrated in Fig.2.
The followings summarize the main approaches adopted in the design of UbiSound.
1) Make use of the sensors embedded in a smartphone as well as some external sensors to capture real-time data and determine the normal state or the abnormal state of the monitored events occurred in the user.
2) Sensors and technologies involved: GPS, mobile and wireless network, accelerometer, gyroscope, magnetometer, microphone, Speakers, front/back video camera, display screen
3) Normal states and conditions are collected and recorded into the local databases of the smartphone as well as in the external actuators.
4) If any anomalies are detected or identified (the collected real-time data deviate from the normal state by a pre-defined threshold), actions or events will be triggered automatically and the corresponding pre-defined procedure(s) will be activated.
5) Each action and reaction will be logged for further analysis to improve the system performance and adjust the definitions of the normal and abnormal state.
We have done some investigations on making use of the sensing services provided from a smart phone for capturing sound data ubiquitously.
Smart Phone
Internal Components Mobile App
Triggering Events
Context recognizer
Data Acquisition Data Store
Sensors Data Port
Data Feeder Sensing Environment
Actuators
Long-term Database Data Mining Data Processing External Systems
- Noise Parameter
Figure 3: Application of UbiSound in real Environment
B.Noise measurement
UbiSound lets participator’s mobile devices work as nodes in a
sensor network to gather and share local data (Stevens, 2010). Following, the data gathered by individuals can be accumulated to an entire database which provides the groundwork of the system. The more the gathered data would be increased, the better measurement would be obtained. In this framework participator could capture and upload the sound (Fig. 3). There is enabled for users to tag or annotate about the source of the sound (e.g. human sound, mechanical sound, biological sound, geophysical sound and traffic sound), their personal subject impressions about it (e.g. hectic vs. calm, annoying, hate vs. love) and their idea that in which category they are going to classify captured sound, soundscape category or noise category (Stevens, 2010; Liu, 2014; Schweizer, 2011).
Sound pressure is measured in decibels (dB), in which the range of human hearing through it is between 40 dB (very low) to 110 dB (very high). According to (Maisonneuve, 2009) lower than 70dB represents No Risky environment, between 70 and 80 dB indicates Being Careful and sound that reach a decibel level of 80 can Cause Permanent Damage to the hair cells in the inner ear. This project considers these levels to specify noise in order to set context aware services and some automatically pre-defined alarms in which make users noticed of risky place.
C.Visualization
As shown in Fig.3, this system offers three different visualizations namely, Noise map, Soundscape map and Suggested path map. Moreover some events or actions may
UbiSound through Ubiquities computing, provides a situation for the participators to sign up their own account in which they could fill-out some predefined documents for example some psychological attributes such as age, disease, preference and taste, to name but a few. This information may be useful to recognize the context of the specific participator.
5. DISCUSSION
To the best of our knowledge from reviewing the related work we developed 10 criteria (Table 1) for ambient health applications measuring environmental pollution. The last seven criteria are from (Ruge et al., 2013).
Comparison
Table 1- A comparison of projects in sound monitoring using 10 criteria from the literature and our analysis
Pre-mentioned criteria are defined as follows:
- Context Awareness of participator position may be used to trigger a service related to him/her or change in measurement process of sensors.
- Unobtrusiveness means that the system should access the resource autonomously to involve in task sensing. In other word
the system doesn’t need user’s interaction.
- Risk assessment shows the health risk based on received sensor data, and may offer guidance to participators.
- Continuity in measuring data is needed to allow for sufficient data to assessing the health risk of both community and person. Precisely, there must be covered both aggregate historical data and current data.
- Personal Exposure has been provided from recorded sensor values to give participators information on their level of exposure.
- Community Exposure has been provided from recorded sensor values to give participators information on the community level of exposure which is related to them.
- Experience of Exposure lets participators to share their feeling about the sound. For instance under social circumstance and preference all noise cannot be as annoyance one, and also for soundscape.
- Noise Capture ability has been embedded in system to gather
the Noise data of the participator’s content. These data has been
used in order to assess the noise map.
- Soundscape Capture ability has been embedded in system to
gather the Soundscape data of the participator’s content. These
data has been used in order to assess the Soundscape map.
- Privacy has been identified as a pillar of trustworthy software
systems and ensures privacy of participators and precise noise map concurrently (Drosatos, 2014).
Ubiquities computing; and also by capturing soundscape map next to noise map, the model can make a better offer sites.
6. CONCLUSION
In this paper, we propose a new framework under circumstances of U-VGI scenario, called UbiSound, for providing effective context-aware services around sound mapping by applying the latest wireless and sensing technologies in smart phones. The design of the architecture and system components of UbiSound is discussed. In addition, to illustrate the effectiveness of the system, we proposed a ubiquitous GIS system based on the framework of UbiSound. UbiSound detects and records the sounds existed around the user in any time and any places and analyse the voice data to generate important statistics to suggest
the Noise status of the user’s environment. If the voice features are “abnormal”, the system will send an alert message to the
user. This survey also tries to distinguish differences among Noise and Soundscape from user’s point of view. So, with making such a context aware product to users, we can make a better feeling for volunteers. The comparison among obtained results from UbiSound show that proposed framework can effectively record the quality of sound around the individuals.
As the ongoing work, we are extending UbiSound by integrating in more sensors to capture more health factors about the user to provide a more complete monitoring on his health status and for critical event detection. In the meanwhile, we would like to recruit volunteers who are suffering Noise disorder to evaluate the effectiveness of UbiSound in helping them.
REFERENCES
Atzmueller, M, Becker M, Stephan Doerfel, Andreas Hotho, Mark Kibanov, B. Macek, Folke Mitzlaff, Juergen Mueller, Christoph Scholz, and Gerd Stumme. 2012. Ubicon: observing physical and social activities. In: IEEE International Conference on Green Computing and Communications (GreenCom). 317-324.
Berglund, B., C. A. Eriksen, and M. E. Nilsson, 2001. Perceptual characterization of soundscapes in residential areas. In: Proceedings of the 17th International Congress on Acoustics (ICA).
D’Hondt, E., Stevens, M., & Jacobs, A. 2013. Participatory
noise mapping works! An evaluation of participatory sensing as an alternative to standard techniques for environmental monitoring. Pervasive and Mobile Computing, 9(5), 681-694.
Drosatos, G., Efraimidis, P. S., Athanasiadis, I. N., Stevens, M.,
& D’Hondt, E. 2014. Privacy-preserving computation of
participatory noise maps in the cloud.Journal of Systems and Software, 92, 170-183.
Ericson. 2014. Ericson Mobility Report. http://www.ericsson.com/mobility-report (3 June. 2014).
Goodchild, M., 2009. NeoGeography and the nature of geographic expertise. Journal of Location Based Services, 3, 82-96.
Irvine, K. N., Devine-Wright, P., Payne, S. R., Fuller, R. A., Painter, B., & Gaston, K. J. 2009. Green space, soundscape and urban sustainability: an interdisciplinary, empirical study. Local Environment, 14(2), 155-172.
Kanjo, E., Benford, S., Paxton, M., Chamberlain, A., Fraser, D. S., Woodgate, D., & Woolard, A. 2008. MobGeoSen: facilitating personal geosensor data collection and visualization using mobile phones. Personal and Ubiquitous Computing, 12(8), 599-607.
Keshtehgar, E., Soleimani, S., & Sadeghi-Niaraki, A. 2014. U-VGI: The Potential of Ubiquitous Computing Technology in Volunteered Geospatial Information Environment. 2014. 8th International Conference on Geographic Information Science: GIScience 2014, Vienna, Austria, 23-26 September.
King, G., Roland-Mieszkowski, M., Jason, T., & Rainham, D. G. 2012. Noise Levels Associated with Urban Land Use. Journal of Urban Health, 89(6), 1017-1030.
Liu, J., Kang, J., Behm, H., & Luo, T. 2014. Effects of landscape on soundscape perception: Soundwalks in city parks. Landscape and Urban Planning, 123, 30-40.
Maisonneuve, N., Stevens, M., Niessen, M. E., & Steels, L. 2009. NoiseTube: Measuring and mapping noise pollution with mobile phones. In Information Technologies in Environmental Engineering (pp. 215-228). Springer Berlin Heidelberg.
Martí, I. G., Rodríguez, L. E., Benedito, M., Trilles, S., Beltrán, A., Díaz, L., & Huerta, J. 2012. Mobile application for noise pollution monitoring through gamification techniques. In Entertainment Computing-ICEC 2012 (pp. 562-571). Springer Berlin Heidelberg.
Raimbault, M., Lavandier, C., & Bérengier, M. 2003. Ambient sound assessment of urban environments: field studies in two French cities. Applied Acoustics, 64(12), 1241-1256.
Rosser, B. A., & Eccleston, C. 2011. Smartphone applications for pain management. Journal of telemedicine and telecare, 17(6), 308-312.
Schulte-Fortkamp, B. 2001. The quality of acoustic environments and the meaning of soundscapes. In Proc. of the 17th international conference on acoustics.
Schweizer, I., Bärtl, R., Schulz, A., Probst, F., & Mühläuser, M. 2011. NoiseMap-real-time participatory noise maps. In Proc.
2nd Int’l Workshop on Sensing Applications on Mobile Phones
(PhoneSense’11) (pp. 1-5).
Sieber, R, 2006. Public participation geographic information systems: A literature review and framework. Annals of the American Association of Geography, 96, 491–507.
Srivastava, A. K. 2014. Noise: a nauseating nuisance for human life. ZENITH International Journal of Multidisciplinary Research, 4(2), 212-221.
Stevens, M., & D’Hondt, E. 2010. Crowdsourcing of pollution
data using smartphones. In Workshop on Ubiquitous Crowdsourcing.