A CITYGML EXTENSION FOR TRAFFIC-SIGN OBJECTS THAT GUIDES THE
AUTOMATIC PROCESSING OF DATA COLLECTED USING MOBILE MAPPING
TECHNOLOGY
M. Varela-González a, B. Riveiro b, *, P. Arias-Sánchez a, H. González-Jorge a, J. Martínez-Sánchez a
a
Applied Geotechnologies Group, Dept. Natural Resources and Environmental Engineering, University of Vigo, Campus Lagoas-Marcosende, CP 36310 Vigo, Spain (mariavargon, parias, higiniog, joaquin.martinez)@uvigo.es
b
Applied Geotechnologies Group, Dept. Materials Engineering, Applied Mechanics and Construction, University of Vigo, Campus Lagoas-Marcosende, CP 36310 Vigo, Spain - [email protected]
Commission I, WG VI/4
KEY WORDS: LiDAR, Automatic data processing, cityGML, road mapping, sensor integration.
ABSTRACT:
The rapid evolution of integral schemes, accounting for geometric and semantic data, has been importantly motivated by the advances in the last decade in mobile laser scanning technology; automation in data processing has also recently influenced the expansion of the new model concepts. This paper reviews some important issues involved in the new paradigms of city 3D modelling: an interoperable schema for city 3D modelling (cityGML) and mobile mapping technology to provide the features that composing the city model. This paper focuses in traffic signs, discussing their characterization using cityGML in order to ease the implementation of LiDAR technology in road management software, as well as analysing some limitations of the current technology in the labour of automatic detection and classification.
1. INTRODUCTION
During the last years, the development of Geographic Information Systems in 3D (3DGIS) has provided the 2D or 2.5D geographic representations from a spatial perspective. For most of current mapping applications not only geometry is relevant but also topologic and semantic information is required to have models supplied with attributes. The rapid evolution of integral schemes, accounting for geometric and semantic data, has been importantly motivated by the advances in the last decade in mobile laser scanning technology; automation in data processing has also recently influenced the expansion of the new model concepts.
The stunning growth of mobile mapping technology has demonstrated that this is probably the most powerful solution for the improvement in the maintenance of transportation corridors. Its principal application nowadays probably relates to geometric inventory and routine inspection of road infrastructure, not only due to its significance for the optimization of life cycle of the infrastructures but also due to the importance of road mapping in road safety.
Despite of the quality, in terms of geometric accuracy as well as detailed data, of the product derived from a mobile mapping survey, the technology reduces its potential due to the difficulties associated to handling large and dense point clouds. In order to ease the implementation of the technology in the tasks mentioned above, automate data processing reveals essential. It is remarkable the important number of publications in the last years related to automatic road elements detection and characterization (Serna & Marcotegui. 2014; González-Jorge et al, 2012). In road elements such as traffic signs semantic information is essential, thus Pu et al. (2011) show preliminary findings for the detection and classification of off-ground traffic signs, González-Jorge et al. (2013) develop a procedure to automatically perform routine inspection of vertical signs. The improvements in the automation of data
processing and the structuring of results according to schemes that allow the interchange and interoperability will definitely contribute to the modelling of the emerging smart cities; this is one of the current challenges for geotechnologies.
As stated above, classical GIS are turning into 3DGIS which is being implemented in several well know commercial suites. However, reaching these layers of information in the 3D space is not a trivial task, and specific processing of geometric data is required. It is important here to cite the roll of those schemes internationally recognized as Standards for land modelling (eg cityGML scheme). CityGML has the core objective of establishing a common definition for basic entities, attributes and relationship of the 3D city model. This pretends to be completed, not only representing geometry, topology, and appearance of the city objects in a coherent and homogeneous manner, but also its semantical aspects (its structures, taxonomies and aggregations (Groger & Plümer, 2012). Even the scheme is deeply developed in some of its modules and properties (eg building model), elements related to traffic signs (poles and road marks) does not have sufficient representation in the schema yet. Currently, these city objects are represented as City Furniture objects without a deep characterization (they are only coded by their function (CityFurnitureFunctionType). In order to improve the management of road infrastructures and road safety based on the potential of the cityGML scheme, it is essential to extend the scheme to include all the properties related to this management aim. Thus, this will mark the route to be followed during the development of 3D automatic reconstruction of road environments. Consequently, this must be taken into account when developing the automatic procedures for mobile mapping data processing.
Through this article a proposal of extension of cityGML is presented by using an Application Domain Extension (ADE). Thus, traffic signs are supplied with specific feature types, attributes, and relations into the Transportation module because The International Archives of the Photogrammetry, Remote Sensing and Spatial Information Sciences, Volume XL-1, 2014
this module contain the road networks modelling, in which traffic signs play a key role.
In parallel to the extension of the scheme, several strategies towards automatic detection and characterization of traffic sign objects from mobile LiDAR data are discussed. Different attributes such as shape (related to sign function), segmentation of signs hung in a common pole, position, orientation, etc., can be automatically extracted. Through this article several geometric and radiometric inputs are taken into account, however several important limitations in state-of-the-art sensors are still pendent; principally, sensors do not provide enough spatial resolution yet to identify characters on traffic signs, so achieving further signs classification still require of complementary imagery data.
Mobile mapping technology reveals to be a productive solution when performing inventorying or inspection or large infrastructures. An example of integral solution for road mapping was presented by (Martínez-Sánchez et al., 2013); however, automatic data processing is still challenging in order to deliver those attributes in accordance with the new standards of 3D city modelling. Overall, three main aspects should be remarked in regards with modelling of traffic signs:
- The absence of a scheme for sharing modelling information about traffic objects.
- A lack of information regarding sensors and pre-processing algorithms that difficult the automatic data processing.
- The extraction of inventory parameters should follow standards so the efforts made are optimized.
2. ROAD MANAGEMENT TOOLS BASED ON LIDAR INFORMATION: SITEGI SOFTWARE
The University of Vigo developed a pioneer project for the advance management of road infrastructure based on geotechnologies (Martínez-Sánchez et al., 2013). This project comprises instrumentation, such as MLS, imagery, Ground
Penetrating Radar (GPR), and optical road profiling, in addition to a software solution for the management and visualization of all the data collected.
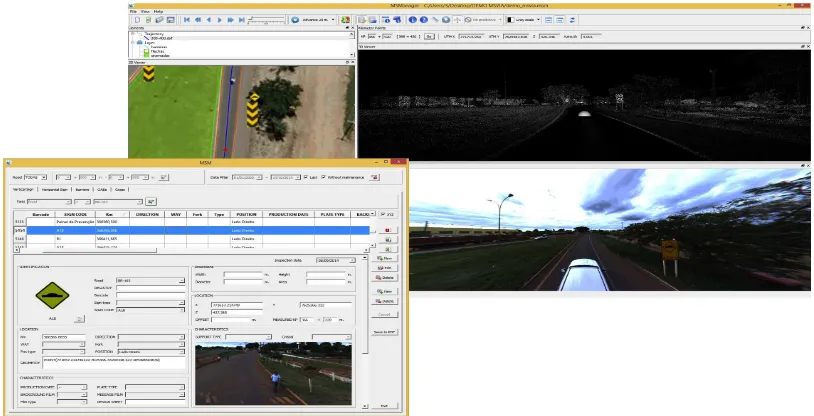
The management of large volumes of data collected by the mapping unit (point clouds, imagery, etc.) for extensive applications such as the road network of a country present important difficulties related to computational performance and efficient handling. For that reason, a customized software application to visualize and handling each type of data has been developed: GIS for vehicle trajectories, 3D point cloud viewer, and graphics to visualize GPR and International Roughness Index (IRI) data.
The main challenge relates to the handling of large point clouds, which are the main potentiality of the new inspection technology. The solution to visualize point clouds efficiently is based on open libraries such as Visualization Toolkit (VTK), OpenSceneGraph (OSG), and Point Cloud Library (PCL). Octree structures were used to define visualization format so the usage of memory is optimized during navigation. Additionally, an improved octree was implemented in such a way the tree is stored in a secondary memory. This allows only loading to the memory those points of the desired level of the tree. This way, the access and processing of those points is fast and can be handled in real time.
A GIS platform is used to manage all the information related to the road, which is software synchronized: 3D point clouds that allow the geometric inventory of all the road parameters, RGB and IR imagery, navigation data, GPR results, etc. This platform allows user queries about the inventories and inspections that are stored in a remote database, based on PostgreSQL and PostGIS module. Figure 1 shows the interface of the software for road management from point clouds.
To efficiently implement the MLS technology in road management new algorithms need to be developed in order to automate data processing and sharing. Particularly, detection and classification of road objects is required for road management. Additionally, schemes that contribute to share the data gathered by laser scanners under an interoperable perspective starts being demanded.
Figure 1. Interface of the point cloud based road management software.
3. CITYGML AND TRAFFIC 3.1 CityGML
In 2008 the Open Geospatial Consortium (OGC) declared cityGML as the standard for 3D city modelling. CityGML is a GML3 schema defined as a common information model for the 3D representation of urban objects in an interoperable way.
The cityGML schema has the objective of defining basic entities, attributes and relationships in the 3D city model. Not only geometry and appearance are represented in a coherent manner, but also their semantic data, taxonomy and aggregations are modelled (Groger and Plümer, 2012).
The scope of applicability of the cityGML scheme is extended to the city of region and all its components: terrain, buildings, infrastructures, city furniture, etc. Even it was conceived as universal information model that defines objects and attributes, which result very useful for a wide range of applications, the model is still in phase of development. Depending on the necessities of user, the schema may be extended by creation new entities or characterizing the existing ones with new attributes by means of Application Domain Extension (ADE).
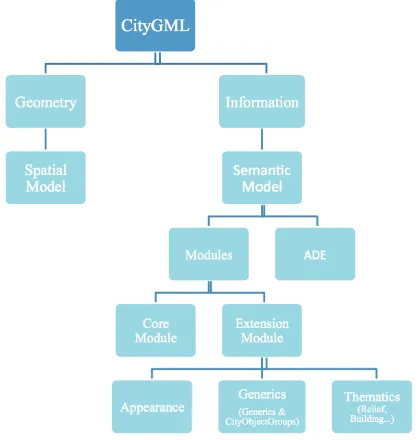
Figure 2. General view of the cityGML schema
As shown in figure 2, the cityGML schema comprises a geometric model and a semantic model. The first one defines the geometric and topologic properties in a homogeneous manner, while the second one stores and classifies the thematic information in different modules. Those objects which are not included in any of the modules defined in cityGML can be included as generic objects and attributes.
3.2 Transportation Module
One of the thematic modules contained in the semantic model is the transportation model. This model focuses in the thematic and functional aspects of the transportation infrastructure.
The principal class of this module is the
TransportationComplex, which is a subclass of
TransportationObject, and consequently, it is also a subclass of
CityObject so all the characteristics of these last classes are inherited. As shown later in figure 6, the TransportationCompless class is used to represent the main transportation infrastructure: Road, Track, Railway and Square.
A TransportationComplex comprises two zones: TrafficArea
and AuxiliaryTrafficArea. The first one refers to all those
Cityfurniture. This comprises urban furniture such as traffic lights, benchs, hoardings, etc. This module has two main aims: first, the improvement and enrichment of the appearance of the 3D city model; secondly, the urban objects composing this module can be used for mobility analysis and simulations.
4. TOWARDS REALIST CITIES: EXPLICIT GEOMETRY FROM MLS.
4.1 Explicit Geometry of Traffic Signs
As presented in the preceding section, when tackling the 3D modelling of cities, the location, orientation, and semantic information of traffic signs reveals essential in terms of mobility. Thus, in the last times many authors have worked in the inventory of those city objects from mobile laser scanning data. In the particular case of vertical traffic signs, Pu et al. (2011) presented a pioneer work where traffic signs are detected and distinguished from other pole-like objects such as trees using geometric data collected by mobile laser scanning. Recent works presented successful results for the detection of road marks from LiDAR technology (Guan et al., 2014; Holgado-Barco et al., 2014).
Overall, more research is required in this field until cities can be completely modelled in 3D under the new paradigms of 3D modelling. Consequently, having into account the amount of data that can be modelled by many researchers around the World, a code that guides the process of automatic 3D modelling is required. In the particular case of traffic signs, after evaluating the current state of cityGML schema, more definition is required for traffic signs when they must be included in analysis of mobility into de city as shown in section 3.4. Particularly, for the case of automatic data processing of traffic signs, researchers should focus at those parameters that can add value to road inventory, or traffic simulations with mobility or road safety purposes.
4.1.1. Intensity data: Before extracting geometric characteristics and function of each particular traffic sign at the road, a key task to be solved is the segmentation of its composing points from the global point cloud. Traffic signs have a particularity that is the retroreflective surface that eases its perception by drivers. Many authors have advised evaluating the intensity attribute of points to distinguish those belonging to traffic signs. Even this may represent the most critical factor to account when searching for traffic signs, it is not trivial to obtain the intensity threshold that separate points of traffic signs from points of their neighbourhood. Here, it should be noted that LiDAR manufacturers do not provide information about the algorithms used to compute the intensity attribute so the problem remains even more complicated. Many authors have The International Archives of the Photogrammetry, Remote Sensing and Spatial Information Sciences, Volume XL-1, 2014
proposed logical criteria when performing intensity-based segmentations. However, each survey will require estimating the intensity threshold because the intensity attribute will be affected by environmental conditions, the LiDAR system used, the disposition of measured objects (affecting range and incidence angle of points), among other factors. The knowledge of the algorithms used by the manufacturers to compute the intensity attribute would definitely help to calibrate the optimal threshold as a function of the factors mentioned above.
Let us perform a coarse segmentation of the global point cloud using an intensity image the point cloud after projection on the horizontal plane. The distribution of the intensity values of segmented points can be represented by a histogram as shown in figure 2. The set of points contained in this histogram comprises of points of the traffic signs panels, points of poles and points of floor. The darker points (those with a lower intensity value) are placed at the beginning of the histogram being the most numerous point class. One might suspect that the intensity values of traffic signs is represented by those set of points with higher intensity value, however, after a manual segmentation of sign points it was verified that points corresponding to signs are placed quite far from the maximum. Also, the higher distance from signs to LiDAR sensor, the lower value for intensity of traffic signs.
Figure 3. Histogram of intensity values for a point cloud containing sign panels, poles and floor points in a
neighbourhood of each signal.
Having previous knowledge about the set of points contained in the point cloud represented in figure 3, it can be assumed that traffic signs are not represented by those points of low intensity values. Then, two main classes remain in the problem of segmentation: poles and panels. However, when evaluating the point cloud collected by the Optech Lynx Mobile LiDAR, the MLS facility at University of Vigo, three main classes are still perceived in the distribution of intensity values. This is motivated by the configuration of traffic sings around the LiDAR sensor head: in a road or street, traffic signs are located at both the right side and the left side. As it can be seen in figure 4, averaged distance to right signs and to left signs may be differ significantly, so the higher difference in distance, the more separated Gaussian curves in the intensity histogram (figure 2).
By fitting a Gaussian Mixture Model, the intensity thresholds may be fixed for each point cloud. This suggests that the point clouds collected by each of the LiDAR sensors must be processed separately. Otherwise, the number of Gaussian curves
would increase and the mission of finding a common optimal threshold would definitely be a challenge.
Figure 4. Distance from signs at both sides of vehicle to the same LiDAR sensor.
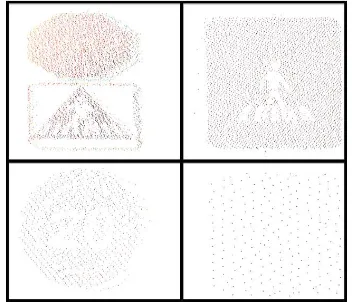
4.1.2. Point cloud density: The spatial resolution of the point cloud may represent one of the principal limitations when city objects need to be classified. Nowadays, most mobile LiDAR sensors provide averaged densities of a few centimetres, and resolution decreases when distances between sensor and city object increases. Consequently, for an individual strip, the same object class can be easily identified in some zones of the point cloud and in a farther zone it can be undistinguishable. Figure 4 presents traffic signs scanned in the same strip where a difference in resolution is notable.
Figure 5. Differences in the resolution of traffic signs scanned from the same strip.
The differences in resolution may affect the algorithms for shape detection. In fact, if a contour evaluation is performed to classify signs by shape, those with higher density will produce a clearer contour than those with lower density. This parameter will affect the algorithms of classification so proper procedures must be defined. If data about distance from sensor to object is available the problem decreases because point cloud density can be normalized as a function of this distance. However, when range data is not available, for example having only information of XYZ coordinates, information about the sensor configuration is required. In the case of traffic signs at least trajectory data would be required to separate those signs located at the right side of each sensor, from those located at the left side. These operations must be applied to both sensor heads so data must be processed separately. Also, when scanning traffic signs are surveyed by a system that comprises two sensor heads, as shown in figure 4, the strategy might consists of using only that part of the point cloud corresponding to minimal averaged distance (“Distance 1” in figure 4), and so for the point clouds collected by each sensor.
An important limitation of MLS, is caused by low-density point clouds when the message printed into the sign needs to be read through laser point clouds. As shown in figure 5, the function of the sign cannot be read in its present form so auxiliary sensors such as photographs are required to complete the information of each sign.
5. RESULTS: MODELLING TRAFFIC SIGNS 5.1 A proposal for traffic sign modelling in cityGML As presented in section 3.3, traffic signs are currently defined in the CityFurniture module as complementary urban objects. However, they play a key role in the mobility of citizens and are one on the essential parameters in terms of road safety, energy efficiency of displacements, etc. For those reasons, it is desirable that traffic signs gain relevance in the schema of modelling.
The strategy to improve the characteristics of the traffic signs into the schema may consist of improving of the CityFurniture
module, by adding objects that represents the traffic sings. However, traffic sings are elements that constrain mobility and their function is linked to Transportation infrastructure, particularly, they are linked to roads and auxiliary elements. So, it would be desirable that the management of traffic could be achieved using a single module into the schema. For this reason, an extension of the schema is proposed.
The core idea is to include into the schema all those signs included into the codes, as well as those characteristics that may affect its perception by drivers, historic data, etc. In order to achieve this, an Application Domain Extension (ADE) is used. This mechanism will permit adding attributes to a feature, or creating new features. The proposal shown in this paper used the last property: new objects are created for traffic signs and
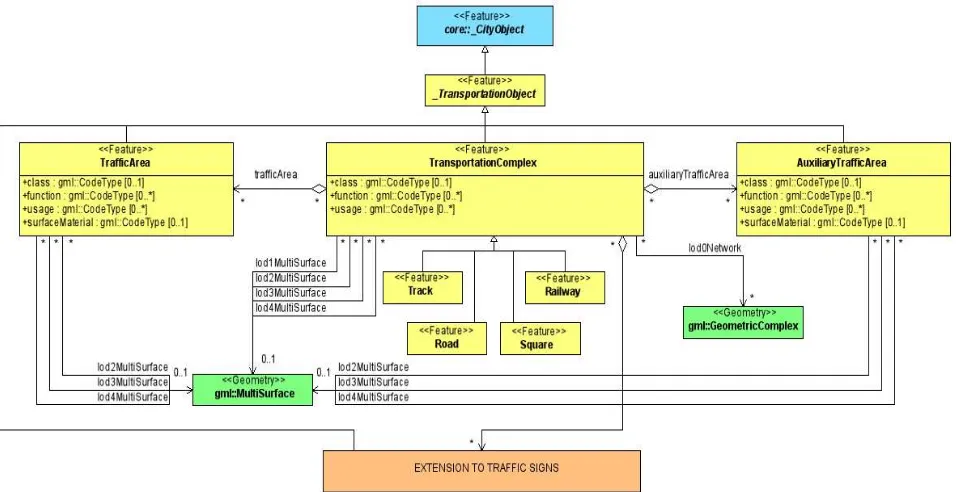
their subclasses. Figure 6 presents the UML diagram of the Transportation module where an extension is proposed for traffic signs.
5.2 Detection and classification of traffic signs from MLS Mobile laser scanning systems are suitable tools to provide all those geometric attributes that define a traffic sign. Thus, traffic signs can be manually selected into a road management tool as shown in section 2 so the process of classification can automatically run. Also, poles can be automatically detected in the point cloud without human operator intervention as shown by Pu et al. (2011), or after developing robust intensity thresholds as proposed in section 4.1.1
Figure 7. Detection and inventorying of traffic signs from MLS data.
Once the set of points corresponding to the sign panels hung on poles are grouped as shown in figure 7 (after applying a clustering algorithm) they can be evaluated separately so basic geometric information can be extracted to feed the 3D model of the city.
Figure 6. UML diagram of Transportation module including an extension for traffic signs.
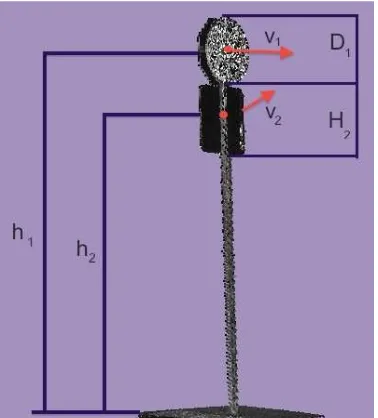
As shown in figure 8, the sign panel can be characterized by the position of its centroid, the height of the sign, size of panel, orientation of panel plane, shape, etc. All these parameters can be easily obtained from the point cloud using basic algorithms such us rasterization and subsequent application of image processing algorithms, Principal Component Analysis, among others.
As stated in section 4.1.2, complementary sensors are still required to complete the inventory of the traffic signs because point cloud density provided by MLS does not permit distinguishing sign prints.
Figure 8. Some of the geometric features that can be automatically extracted from point clouds to define explicit geometry of traffic signs.
6. CONCLUSIONS
In order to improve the management of road infrastructures and road safety based on the potential of the cityGML scheme, it is essential to extend the scheme to include all the properties related to this management aim. Some important features relate to traffic signs, which are currently modelled as CityFurniture, without linking their function to the transportation network.
An extension of cityGML scheme is proposed by using an
Application Domain Extension (ADE). Thus, traffic signs are supplied with specific feature types, attributes, and relations into the Transportation module because this module contain the road networks modelling, in which traffic signs play a key role.
In the last years mobile mapping was probed to be a valid technology to automatically provide geometry about the city, but more research is still required until cities can be completely modelled in 3D under the new paradigms of 3D modelling. Consequently, having into account the amount of data that can be modelled by many researchers around the World, a code or standard that guides the process of automation is required.
Regarding instrumentation, there are some limitations that difficult the automatic 3D modelling of city objects, particularly, small elements such as traffic signs: sensor resolution, and information about proprietary algorithms of LiDAR manufacturers used to compute the intensity attribute
which one of the most critical parameters during the automatic detection of traffic signs.
ACKNOWLEDGEMENTS
This work has been partially supported by the Spanish Ministry of Economy and Competitiveness through the project “HERMES-S3D: Healthy and Efficient Routes in Massive Open-Data based Smart Cities (Ref.: TIN2013-46801-C4-4-R) and by Xunta de Galicia (Grant No. CN2012/269).
REFERENCES
A. Serna, B. Marcotegui. 2014. Detection, segmentation and classification of 3D urban objects using mathematical morphology and supervised learning, ISPRS Journal of Photogrammetry and Remote Sensing, 93, pp 243-255.
C. Cabo, C. Ordoñez, S. García-Cortés, J. Martínez. 2014. An algorithm for automatic detection of pole-like street furniture objects from Mobile Laser Scanner point clouds, ISPRS Journal of Photogrammetry and Remote Sensing, 87, pp 47-56.
S. Pu, M. Rutzinger, G. Vosselman, S.O. Elberink. 2011. Recognizing basic structures from mobile laser scanning data for road inventory studies, ISPRS Journal of Photogrammetry and Remote Sensing, 66 (6), Supplement, December 2011.
González-Jorge, H., Riveiro, B., Armesto, J., Arias, P. 2013. Geometric evaluation of road signs using radiometric information from laser scanning data. Optica Applicata, 43(3), pp. 421-433.
Gerhard Gröger, Lutz Plümer. 2012. CityGML – Interoperable semantic 3D city models, ISPRS Journal of Photogrammetry and Remote Sensing, 71, pp 12-33.
J. Martínez-Sánchez, M. Nogueira, H. González-Jorge, M. Solla, and P. Arias. 2013. SITEGI Project: Applying Geotechnologies to Road Inspection. Sensor Integration and software processing. ISPRS Ann. Photogramm. Remote Sens. Spatial Inf. Sci., II-5/W2, 181-186, 2013.