Global scale comparison of simultaneous
ionospheric potential measurements
R. Markson
a,), L.H. Ruhnke
a, E.R. Williams
b aAirborne Research Associates, Weston, MA 02493, USA
b
Massachusetts Institute of Technology, Cambridge, MA 02139, USA
Abstract
Ž .
A unique series of simultaneous ionospheric potential VI balloon soundings were obtained
every 3 h over 2 full days at Weston, MA and Darwin, Australia, on the other side of the earth. These comparisons were to test the assumption that the ionosphere at sub-auroral latitudes is an equipotential and that a single measurement can provide a globally representative number. Another objective was to evaluate meteorological conditions affecting the measurements in a clean
Ž .
dry continental atmosphere Darwin compared with a more variable moist less clean atmosphere
ŽWeston . The results indicate that for the Darwin data the V measurements were within 10% of. I
the classic Carnegie curve diurnal variation while the Weston data were more variable and often too large. The major source of error appears to be due to hydrated aerosol at Weston causing high electric fields in the exchange layer that were not fully compensated by electric fields above the inversion. The prototype instrumentation also contributed some error. The major finding of this experiment is that a layer of low conductivity air near the ground can have an unexpectedly large
effect on electric field sounding data leading to error in the estimates of V magnitude. ThisI
finding would not have been possible if simultaneous measurements in different airmasses had not
been made since the individual electric field profiles appeared normal.q1999 Elsevier Science
B.V. All rights reserved.
Keywords: Ionospheric potential; Weston; Darwin
1. Introduction and background
Ž .
An attractive feature of utilizing ionospheric potential VI measurements as a proxy
index for monitoring the variation of global temperature is that only a single sounding is required to provide a globally representative value. This is because the ionosphere can
)Corresponding author. Tel.:q1-781-8991834; e-mail: [email protected]
0169-8095r99r$ - see front matterq1999 Elsevier Science B.V. All rights reserved.
Ž .
( ) R. Markson et al.rAtmospheric Research 51 1999 315–321
316
be considered essentially an equipotential at latitudes below the polar cap region; at high latitudes upper atmosphere electric generators add to the potential caused by convection at lower latitudes and can influence the data. Thus, the measurement can be obtained at any convenient sub-auroral latitude location with favorable meteorological conditions. To test the equipotential concept and the affect of local conditions, simultaneous soundings were made over the course of two full days at Darwin, Northern Territory,
Ž . Ž .
Australia 12S, 131E and Weston, MA, USA 42N, 71W .
Previously there have been two experiments where simultaneous aircraft or balloon
measurements at remote locations were used to test the equipotential concept. Muhleisen
¨
Ž1971 summarizes 15 simultaneous balloon soundings between a ship in the equatorial.
Atlantic and southern Germany 6000 km away. Twelve of the measurements agreed to within 10% of each other, 8 were within 3%, 1 pair was 16% and 2 were 20% apart.
Ž .
Markson 1985 reported simultaneous aircraft V soundings made over a 12-h periodI
between the ocean east of Boston and Scheferville, Quebec, 1400 km to the north, which
closely paralleled each other. The absolute difference in V between the locations wasI
less than 5% and when the effect of the high latitude upper atmosphere generator was removed each of the sets of measurements were practically identical. The temporal variation closely matched the Carnegie Curve diurnal variation.
In order to obtain a truly global data set, it was decided to make simultaneous measurements on opposite sides of the world and in different hemispheres. Darwin, Australia, 17,000 km distant, was chosen as the remote site because of favorable meteorological conditions and an offer of support from the Australian Bureau of Meteorology in Darwin.
2. Instrumentation
The electric field was measured with an electrometer and radioactive probes 2.5 m apart interfaced with a standard VIZ meteorological radiosonde. Calibrations were performed for each radiosonde both in the lab and in the field before launch by directly applying known voltages. A new type of resistivity meter based on constant current
Ž .
biasing was designed and flown as part of the project Ruhnke, 1996 . This instrument was used because it is particularly sensitive to low conductivity air in the lower atmosphere compared to the normal Gerdien instrument which is most effective at high altitudes. In addition, the standard temperature and relative humidity soundings were obtained. The resistivity data provided diagnostic information about the electrical structure of the atmosphere that was useful in evaluating the electric field data.
3. Measurements and data analysis
Because of the diurnal variation of the global circuit, which, on the average, can be
Ž .
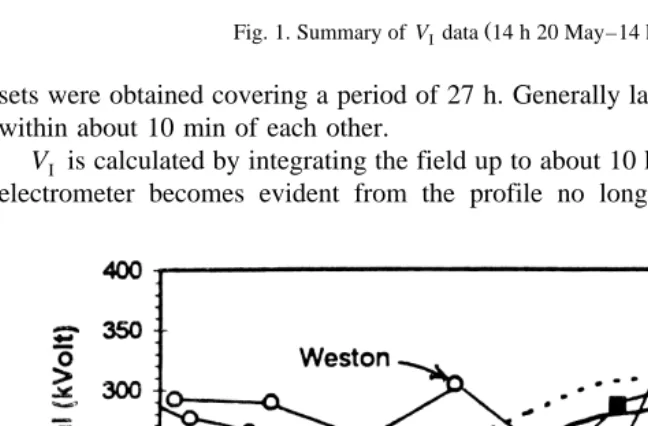
Ž . Fig. 1. Summary of V data 14 h 20 May–14 h 21 May .I
sets were obtained covering a period of 27 h. Generally launches at both locations were within about 10 min of each other.
V is calculated by integrating the field up to about 10 km where the zero drift of theI electrometer becomes evident from the profile no longer following the Gish curve
Ž .
( ) R. Markson et al.rAtmospheric Research 51 1999 315–321
318
ŽIsrael, 1971 . From this point, the remaining potential to the ionosphere about 10% is. Ž .
calculated by integrating the Gish curve upward.
Fig. 1 summarizes the 9 measurement pairs made on 20–21 May 1995. The Carnegie
curve diurnal variation with a "10% envelope is shown for comparison. Most of the
data fall within or near the envelope. The Darwin data are remarkably close to the
Ž .
Carnegie curve. The second Weston measurement 03 UT appears too large. The
average of the V measurements for the more reliable Darwin data on this day is 247 kV.I
Ž
Fig. 2 summarizes the 10 pairs made on 1–2 June 1995 plus an extra one at Weston
.
with no comparison at Darwin . On this day, the Darwin data closely parallel the Carnegie Curve but the Weston data are consistently above the envelope except for two
Ž
soundings. The last 6 of the Weston soundings daylight hours with lower relative
.
humidity vary like the Carnegie Curve. The average of the more reliable Darwin VI
data for this day is 241 kV.
4. Discussion
A significant source of error in the electric field instrument appears to be caused by
the 1012 V resistor in the input. Due to long lead time in acquiring high quality glass
encased high ohm resistors and constraints on when we could go to Australia, the decision was made to use resistors that were readily available but of lower quality. These resistors had non-linear temperature and voltage characteristics so calibration was difficult. While analysis indicates that most of the discrepancies between the measure-ment pairs was due to atmospheric conditions, there was also some error from the instrument. Better resistors and other improvements to the electric field system have been incorporated for future soundings.
We conclude that the dominant source of error in these soundings, which occurred for the Weston data, is related to large electric fields beneath the inversion which are not fully compensated adequately by lower electric fields above the inversion. The large electric fields are caused by aerosol in the exchange layer which grow rapidly when the relative humidity reaches about 75–80%. This is the ‘deliquescence point’ of salt aerosols when they begin to grow rapidly lowering the conductivity of air. If the low conductivity air is sufficiently wide in extent horizontally, then the electric field above the exchange layer will adjust to smaller values so the integrated potential to the sounding is unaffected. However, if the horizontal extent is insufficient the upper level electric fields will not decrease as much as they should. Sounding balloons typically are carried 50 or more km horizontally during their ascent by the winds. If they measure anomalously large fields in the lower atmosphere and subsequently move into a region where the columnar resistance through the exchange layer is less than in the region of the launch, than the electric fields aloft will be larger than they would have been over the launch region. Therefore, both the lower level and upper level electric fields will be
enhanced and their integration over the flight path will lead to a larger V than the actualI
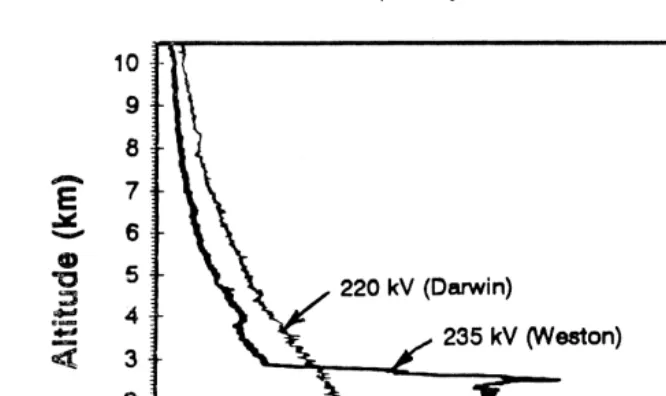
Fig. 3 depicts the sequence of Weston soundings at 01, 03 and 06 UT on 20 May.
Ž .
The 03 UT sounding dark line has much larger values below the inversion than the
Ž .
before and after soundings. The area under the curve represents V . The enhancedI
potential comes mostly from below the inversion which is readily identified by a characteristic decrease in field intensity. The upper sections of these soundings are
practically identical. In each instance where the pairs of V values are not well matched,I
there is an enhanced electric field bulge in the lower part of the Weston sounding which
produces the larger V value.I
Ž
Fig. 4 depicts a pair of simultaneous soundings the first pair on the left side of Fig.
.
1 which illustrates how reliable measurements occur when there is proper compensation in the atmosphere; the profile with highest electric fields in the lower atmosphere has the smaller electric fields in its upper portion. While these profiles are quite different, their
Ž .
integrated potentials are about the same 15 kV, 6% difference . The sharp spikes at the inversion in both soundings and at 1 km in the Weston sounding are caused by thin cloud or aerosol layers of low conductivity which create enhanced electric fields.
In the past, it has not been possible to determine if variations in columnar resistance of the air masses sampled by atmospheric electrical sounding balloons affect the
Ž
measurements. If only a single sounding is made and it looks about right sharp drop in
.
field at inversion and exponential decrease in field above inversion , the assumption has been made that the data are reliable. In these experiments, however, there were simultaneous soundings which individually looked reasonable but sometimes yielded
Ž .
quite different V values. From past measurements Muhleisen, 1971; Markson, 1985I
¨
and theory we assume that the ionosphere should have been at about the same potential over Weston and Darwin. Therefore, we conclude that the discrepancy must be due to the variable columnar resistances along the balloon sounding path.
( ) R. Markson et al.rAtmospheric Research 51 1999 315–321
320
Fig. 4. Compensation of E-field leading to about the same VI values from dissimilar profiles in widely seperated locations.
Previous aircraft measurements have reported close matches between remote
loca-Ž .
tions Markson, 1985 and diurnal variations quite similar to the Carnegie Curve
ŽMarkson, 1976, 1986 . Our aircraft soundings have been made to avoid air mass.
sampling problems by spiraling up and down in a 2 km diameter circle. Balloons typically are blown farther horizontally by the wind than their vertical rise. Aircraft also can obtain profiles over the ocean in relatively clean air with large scale horizontally stratified layers of aerosol so proper compensation will occur.
From the above investigation, the following guidelines have been defined and will be
used in the future to obtain the most reliable V balloon soundings over land.I
Ž .1 Avoid air masses with enhanced electric fields in the mixed layer. This can be
recognized best from a preliminary profile or more easily from larger than normal electric fields at ground level.
Ž .2 Avoid times when the balloon would pass through or near clouds.
Ž .3 Sufficiently dry air in the boundary layer will prevent the growth of aerosols
causing the enhanced electric fields below the inversion. Soundings made by the Weather Bureau can provide this information.
We conclude that differences between simultaneous V measurements are due toI
atmospheric and instrumental factors, and that with good conditions, a single VI
measurement at sub-auroral latitudes would be globally representative.
Acknowledgements
Ž .
Darwin Office of the Bureau of Meteorology: Jim Arthur Director , Jim Core, Steve Fendt, Dale Ingarfield and the other personnel who helped with the soundings. In Weston, Steve Blom, Ken Wilson, Jim Aplin and Peter Jansen of Airborne Research Associates built the radiosonde packages and conducted the soundings.
References
Israel, H., 1971. Clearinghouse for Fed. Sci. and Tech. Info., Atmos. Elect., Vol. 1, Springfield, VA 22151, p. 75.
Markson, R., 1976. Ionospheric potential variations obtained from aircraft measurements of potential gradient. J. Geophys. Res. 81, 1980–1990.
Markson, R., 1985. Aircraft measurements of the atmospheric electrical global circuit during the period 1971–1984. J. Geophys. Res. 90, 5967–5977.
Markson, R., 1986. Tropical convection, ionospheric potentials and global circuit variation. Nature 320, 588–594.
Muhleisen, R.P., 1971. New determination of the air–earth current over the ocean and measurements of¨
ionospheric potential. PAGEOPH 84, 112–115.